Citi Stock Deep Dive: Earnings, Buffet factor support our BUY rating and $60 price target

Welcome back to our deep dive series where this time we look at Citigroup (C). This is the first deep dive we have done on a bank or financial institution, and regular readers will notice a different valuation method at play here. Valuing banks is different from more traditional businesses. For most businesses, we analyze future cash flows and discount them to the current value to come up with our fair share price.
Banks are inherently different. This is due to the nature of capital and debt and how those are used. For a traditional company, debt and equity are capital and so can be used to fund or expand the business. For banks though, capital and debt are part and parcel of the business operations. When you deposit money in a bank, that is treated as a debt to you or liability in the bank's financial accounts. However, that debt can also be used to make money. The bank lends multiples of your deposit as mortgages, loans, etc. The difference in interest rates paid on your deposit versus what the bank receives from loans is called Net Interest Income (NII) or Net Interest Margin (NIM) – probably the most important metric for commercial banks.
However, treating deposits as a liability messes up the standard DCF calculation method, so we cannot really use DCF to value a bank or financial company. In this case, we adjust the DCF accordingly, meaning we just take net income forecasts and discount to get a current value. One alternative is to use a dividend discount model, but some banks do not pay dividends, so this can be less than clear.
We still go through the main methods to come up with our fair price. We then add in macroeconomic considerations to determine if this adds to or reduces our fair value price and finally complete the picture with a look at the technical setup. This then leads to our final 12-month price target. We differ slightly from Wall Street in that we adjust our initial fair value price target based on the market cycle, macroeconomic cycle, and technical forecast. This gives a more accurate estimation in our view. We also go through differing scenarios in each valuation model to arrive at the "best fit" based on recent earnings and forecasts.
Contents
- Company overview and history
- Wall Street consensus forecasts
- Key valuation rating metrics
- Peer value comparison
- Macroeconomic backdrop, market cycle and sector analysis
- Recent news and earnings
- Forecast and valuation
- Technical analysis
- Executive summary, recommendation and price target
Citigroup – Company overview and history
Citigroup is a huge financial conglomerate that operates in multiple geographic regions across two main divisions: consumer banking and institutional clients. The consumer banking group offers traditional banking products such as retail banking, credit cards, lending services, etc. Ths institutional group is more of an investment bank operation, offering trading and research services to institutional clients as well as trading services across all financial markets – fixed income, foreign exchange and equities. The investment banking division also offers clearing and prime brokerage services.
Also read: Walmart Deep Dive: Hold rating on Walmart, Price target at $121
Citigroup in its current guise is a result of various mergers throughout the 1980s and 1990s. Travelers Group, a diverse financial organization, was acquired in the 1980s, while Salomon Brothers was acquired by Travelers in 1997 and renamed Salomon Smith Barney. This was essentially the investment banking division of today. Salomon Brothers was one of the oldest Wall Street Investment firms and was idolized in the famous Liars Poker book. Finally, in 1998, Travellers and Citicorp merged to form the current Citigroup. Travelers has since been sold off.
Citi, as it is known, trades under the ticker C on the New York Stock Exchange and has over 2,000 branches across the US, Mexico and Asia. It was originally founded in New York as the City Bank of New York in 1812.
During the Great Financial Crisis, Citi reportedly received the largest bailout of any US bank under the Troubled Asset Relief Program (TARP).
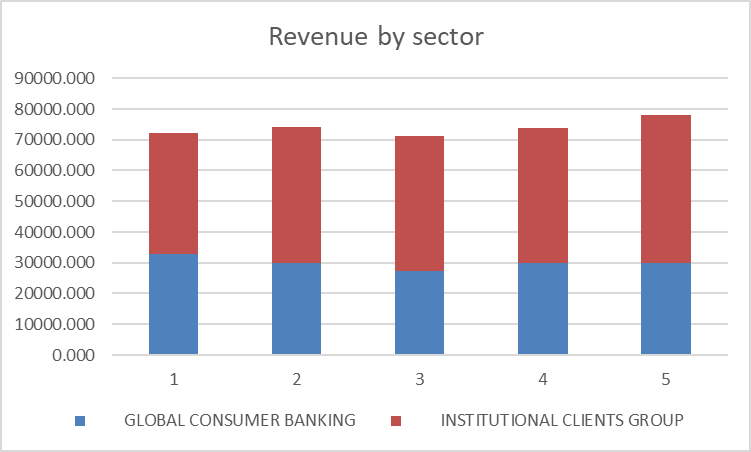
As we can see from the table below, Citi makes the majority of its money from its Institutional Group.
Source: Refinitiv FXStreet calculations
Investment banking entered a boom phase during the pandemic as stay-at-home traders ensured massive stock market volatility for market makers. Corporate finance deals surged as interest rates were set to zero, and this was most notable in the rise of SPAC deals. According to mergermarket.com, Citi increased its merger deal value by over 138% from 2020 to 2021. However, the table below from the FT shows how fee income across all investment banking is down sharply in 2022 as the investment banking cycle follows its traditional boom-bust model.
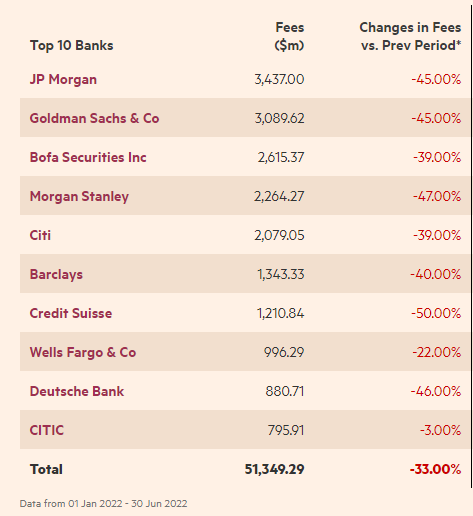
Source: FT.com
This slowdown in investment banking fees is reflected in C stock price falling 17% so far in 2022, but admittedly that is largely in line with the main indices as the chart below shows.
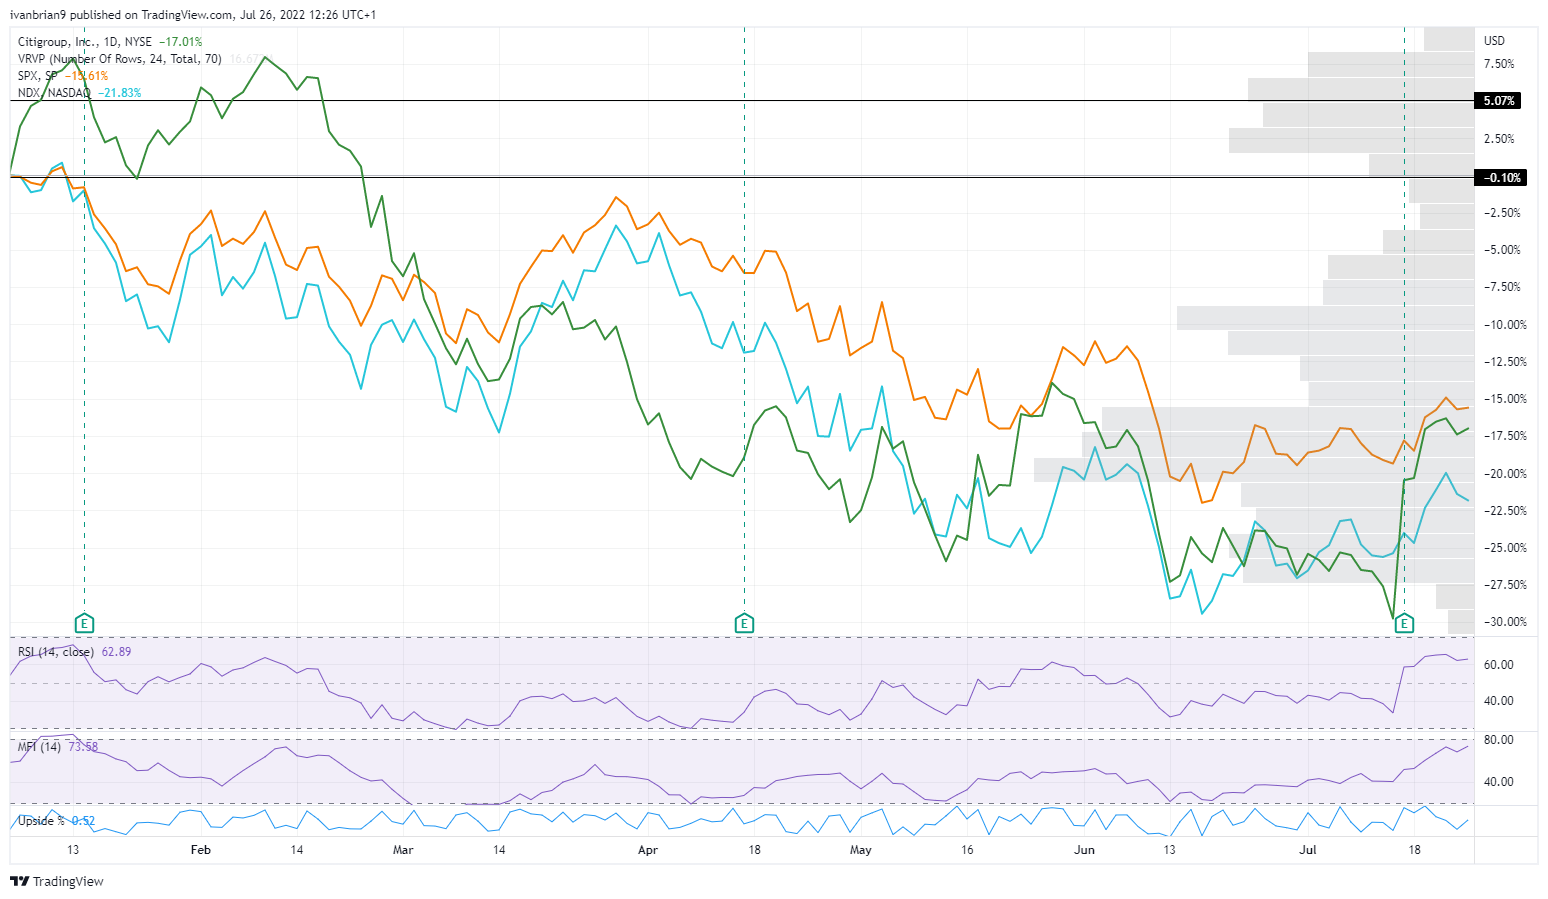
Citi (C) green line versus S&P 500 (orange) and Nasdaq (green), year to date
Over the past five years though, Citi stock performance has hugely lagged both the Nasdaq and the S&P 500. Over this time period, Citi stock is down over 20%, while the benchmark S&P 500 is up over 60%.
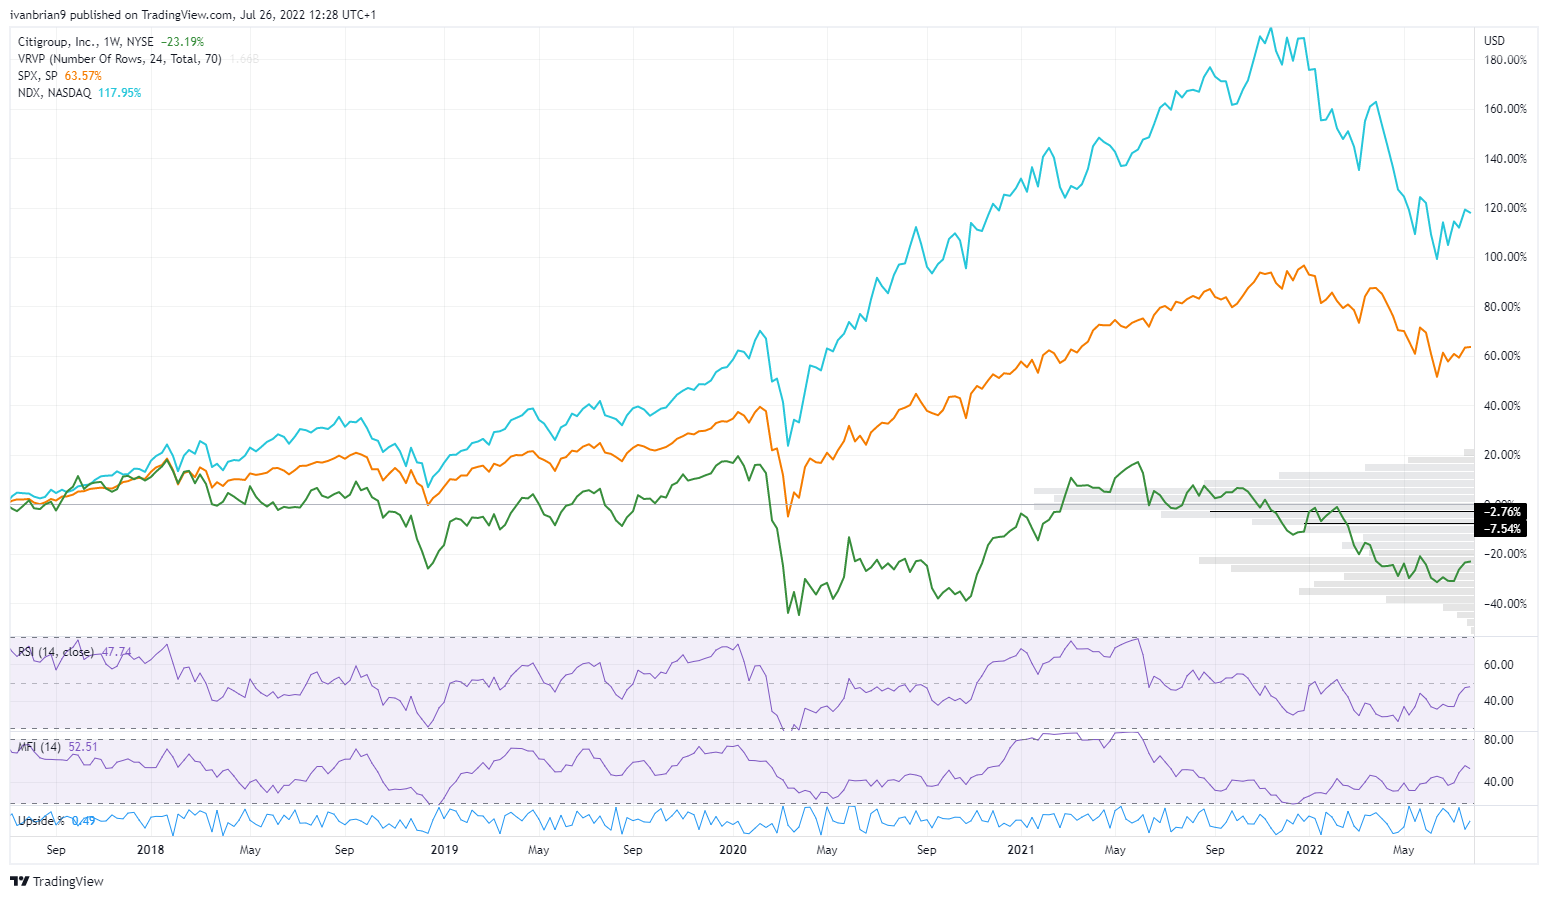
Citi (green) versus S&P 500 (orange) and Nasdaq (blue) last 5 years.
Some of this outperformance is due to the influence of big tech, however, Citi has trailed behind its peer group as the lower chart for the past five years again demonstrates.
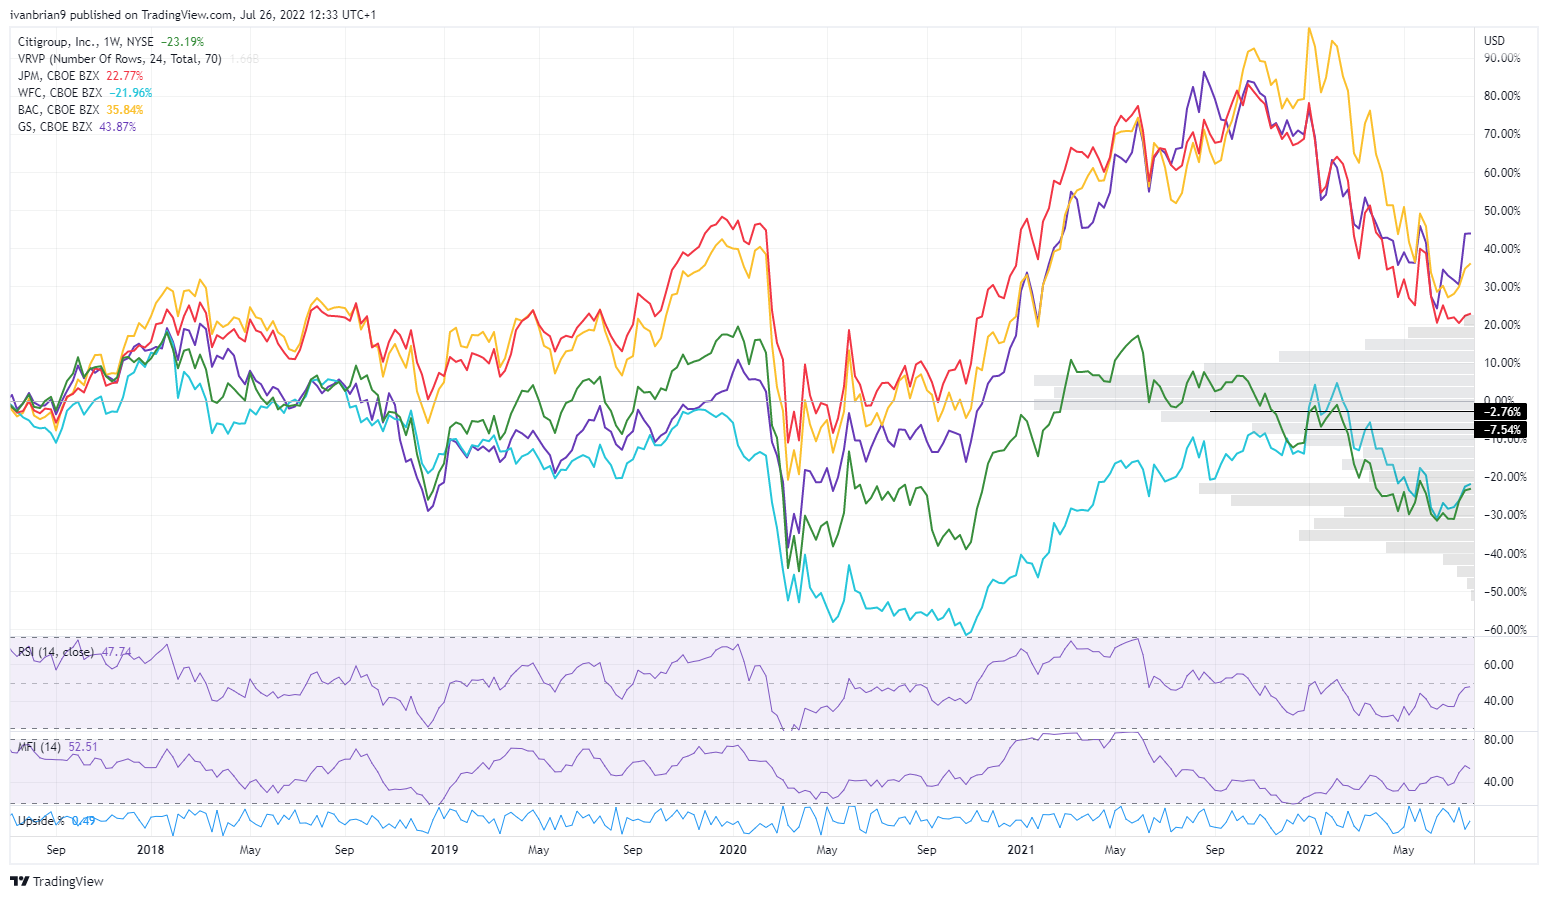
Citi (green), Wells Fargo (blue), Goldman Sachs (purple), JPMorgan (red) and Bank of America (yellow) last 5 years
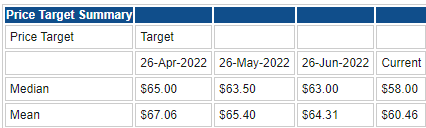
C stock Wall Street consensus forecasts
Current forecasts have been recently updated as Citi released earnings only one week ago. The current consensus remains bullish with an average price target of $60, which is nearly $10 dollars above the current price. This is a 20% upside from the current share price based on Wall Street's consensus.
Source: Refinitiv
Citi key valuation rating metrics
Market cap: $101 billion
Enterprise value: $580 billion
52-week high: $74.64
52-week low: $43.44
Short interest: 2.60%
YTD performance: -17%
5.year performance: -23%
Dividend yield: 4%
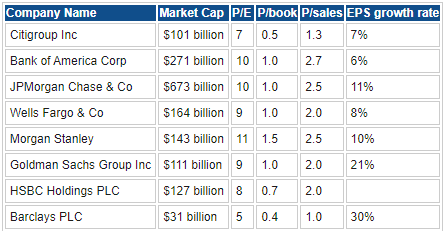
Peer value comparison
For comparison, the average P/E of the S&P 500 is now down to approximately 17.
Source: Refinitiv, TradingView
C stock macroeconomic backdrop, market cycle and sector analysis
Regular readers of our deep dive series will know we focus on the macro background as that determines a so-called stress test of our price target.
There is no point in having a price target that is noticeably bullish if we are in an all-encompassing bear market. Just for clarity, we define several series of bear markets. Bearish market situations will bring all stocks lower but at different speeds and correlations. When those correlations get closer to 1, that is everything goes down together and there is no alpha (outperformance), then that is basically the capitulation phase. A normal bear market phase will see alpha generation as investors focus on company specifics. Nonetheless, bear markets must mean price targets are reduced in the region of 20-40% to take into account overall market conditions. That is why we combine microanalysis with macro and technical overlay to determine our price targets.
By now we are all no doubt aware of we are in a bear market. Inflation is raging, interest rates are surging, and equities are falling. Different sectors and cycles of equity are seeing differing declines. High growth has been hit the hardest as these are long duration and susceptible to changes in interest rates. Value or cash-rich companies have fared well as these are also susceptible to interest rates but will navigate economic slowdowns better.
Citi has multiple conflicting issues. Rising rates should impact favourably its NII or NIM as it is sometimes called. Basically, higher rates mean it earns more from borrowing cheaply from the Fed or interbank market and lending at higher rates to customers. A slowdown in demand for loans increases the possibility of bad debts, and this is especially evident in the housing sector. We do not want a repeat of 2008, so banks have been stress-tested and are now increasing bad debt provisions.
Bear markets are also not good for investment banks. We have shown above that investment banking fee income is down sharply as those frenzied SPAC deals dry up and demand for fixed income issuances and share sales, IPOs and M&A all slow in bear markets and recessions.
We are making the assumption that we are in or are very close to a US recession. We can use many metrics to determine this, but the US GDP release later this week is likely to determine it. We know already that we are in a bear market, but at what stage are we? The worrying aspect is that earnings growth is only now beginning to slow noticeably. This will likely pick up pace after this quarter and follow through into Q3. This will mean earnings downgrades, which are already picking up speed, will increase further.
Corporate #earnings downgrades are picking up steam as economic growth slows.
— Lance Roberts (@LanceRoberts) July 21, 2022
h/t @thedailyshot. pic.twitter.com/7NFIQEmJGp
Earnings downgrades will increase, leading the fabled price/earnings (P/E) ratio to decline further for the S&P 500. Price has already declined, making the ratio return to acceptable-looking levels. With earnings coming down, it means the price also needs another leg lower. Otherwise, P/E ratios will rise again, and that is not usual in a recession or bear market.
SP500 down to 16X Forward earnings is cheaper but not cheap
— Douglas Orr, CFA (@EquitOrr) July 25, 2022
- yes it's now below the "Taper Ave" of 16.5X
- but EPS downgrades are very likely sizable for 3-6mths
- previous downgrade periods saw 15X/13X in '15/'12 respectively
=> EPS downgrades & deratings likely = headwinds pic.twitter.com/bywvdEF47u
The aggregated earnings outlook looks steady but, under the hood, estimates are eroding. Here we see the percentage of companies in the S&P 500 with rising estimates from three months ago. There clearly is slippage here. pic.twitter.com/LJ5Fea3WhX
— Jurrien Timmer (@TimmerFidelity) July 20, 2022
Also, it does appear the housing market is slowing rapidly with reports of a reduction in bidding wars and price cuts. This should not come as that much of a surprise when we factor in rising rates, affordability ratios blowing out and consumer confidence collapsing.
The percentage US home for sale that have cut their asking price over the last 4 weeks is at the highest level we've seen since Redfin started tracking the data in 2015.https://t.co/i26yC3A0R0 pic.twitter.com/fiPBcVYkdF
— Charlie Bilello (@charliebilello) July 24, 2022
Less than 50% of US homes for sale faced bidding wars in June, the lowest level we've seen since May 2020. A year ago the rate was 65% and in January it hit a high of 69.6%.
— Charlie Bilello (@charliebilello) July 25, 2022
(note: bidding war is defined as an offer with at least one competing bid).https://t.co/6LJOb8JySE pic.twitter.com/WpDwXaXZUp
All this means that whatever price target we arrive at based on micro factors, discounted cash flows need to be adjusted for the overall market as described above. We will show adjusted DCF and relative valuation models taking these adjustments into consideration.
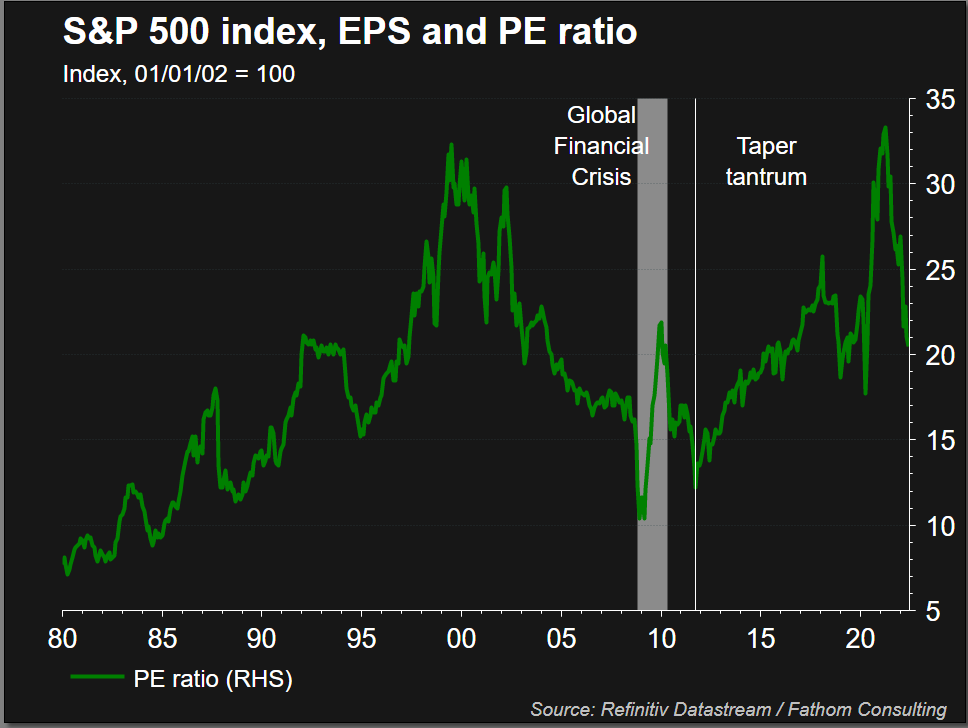
What all this means for equities on a macro level are lower valuations and lower profits, a bearish combination. Below we show the average price-to-earnings ratio for the S&P 500 going back to the 1980s. The average has come back to 20, but in periods of recession the P/E tends to fluctuate between 10 and 15.
Citi recent news and earnings
Citi has recently released its latest quarterly earnings report, which gives us some visibility. The big bank corp beat on the top and bottom lines, EPS was $2.30 versus $1.68 expected, and revenue was $19.64 billion versus $18.3 billion expected. Citi is going to pause its share buyback program due to capital requirements. Citigroup did not pass the most recent bank stress tests with such strong metrics as other banks in the sector. Its current CET1 ratio is just under 12%, and it is pausing dividend hikes and share buybacks to build this to over 13%.
Also read: Nvidia Stock Deep Dive Analysis: NVDA price target at $205 with strong revenue growth
The current CEO Jane Fraser is not long on the job and looks to be instigating a culture shift within the bank. Commenting this year on Citi's underperformance versus peers that we detailed above, she said "It's not a surprise that we've been outperformed and failed to meet the expectations of our investors."
Warren Buffet has been a notable recent investor as he purchased 55 million shares in Citi, according to SEC filings in Q1. The reasoning is likely tied to the serious underperformance that has plagued C stock over the years and as well as confidence in the new executive team led by the new CEO. Buffet puts serious store into management capability, so his investment is a serious boost for Fraser. It is also a large position and cannot be discounted.
Citi forecast and valuation
Here is where we get into determining our fair value share price for Citi. We will use a basic DCF as well as a Dividend Discount Model (DDM) and relative valuation and then tweak for macro forecasts as well as technical outlook.
First, DCF models for banks are complicated by the treatment of debt, so we have simplified it. We have outlined our worst-case provision here with increased bad debt provisions based on a slowing economy. We have also taken into account the current Tier 1 capital adjustment and assumed that this may have to continue again based on a slowing economy in recession. The worst case in our view puts the price at around current levels, $51.66.
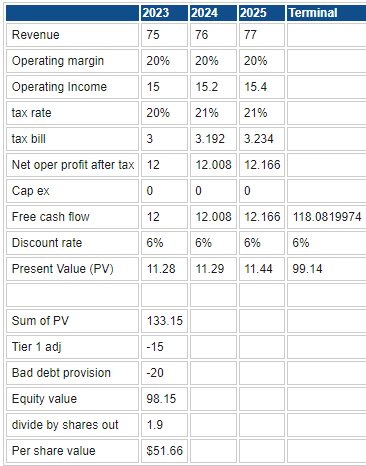
Source: Refinitiv, FXStreet calculations
Using a dividend discount model gives a much lower outlook, but we are less confident in dividend models as dividends are variable and can be discontinued. Payout ratios vary largely. Below we use a payout ratio of 30% and elevate it to 40%. Citi's average payout ratio over the past five years is 40%. Usually, a payout ratio above 50% is considered high.
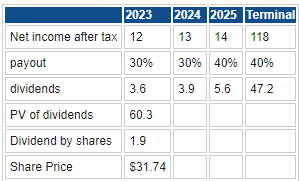
Source: Refinitiv, FXStreet calculations
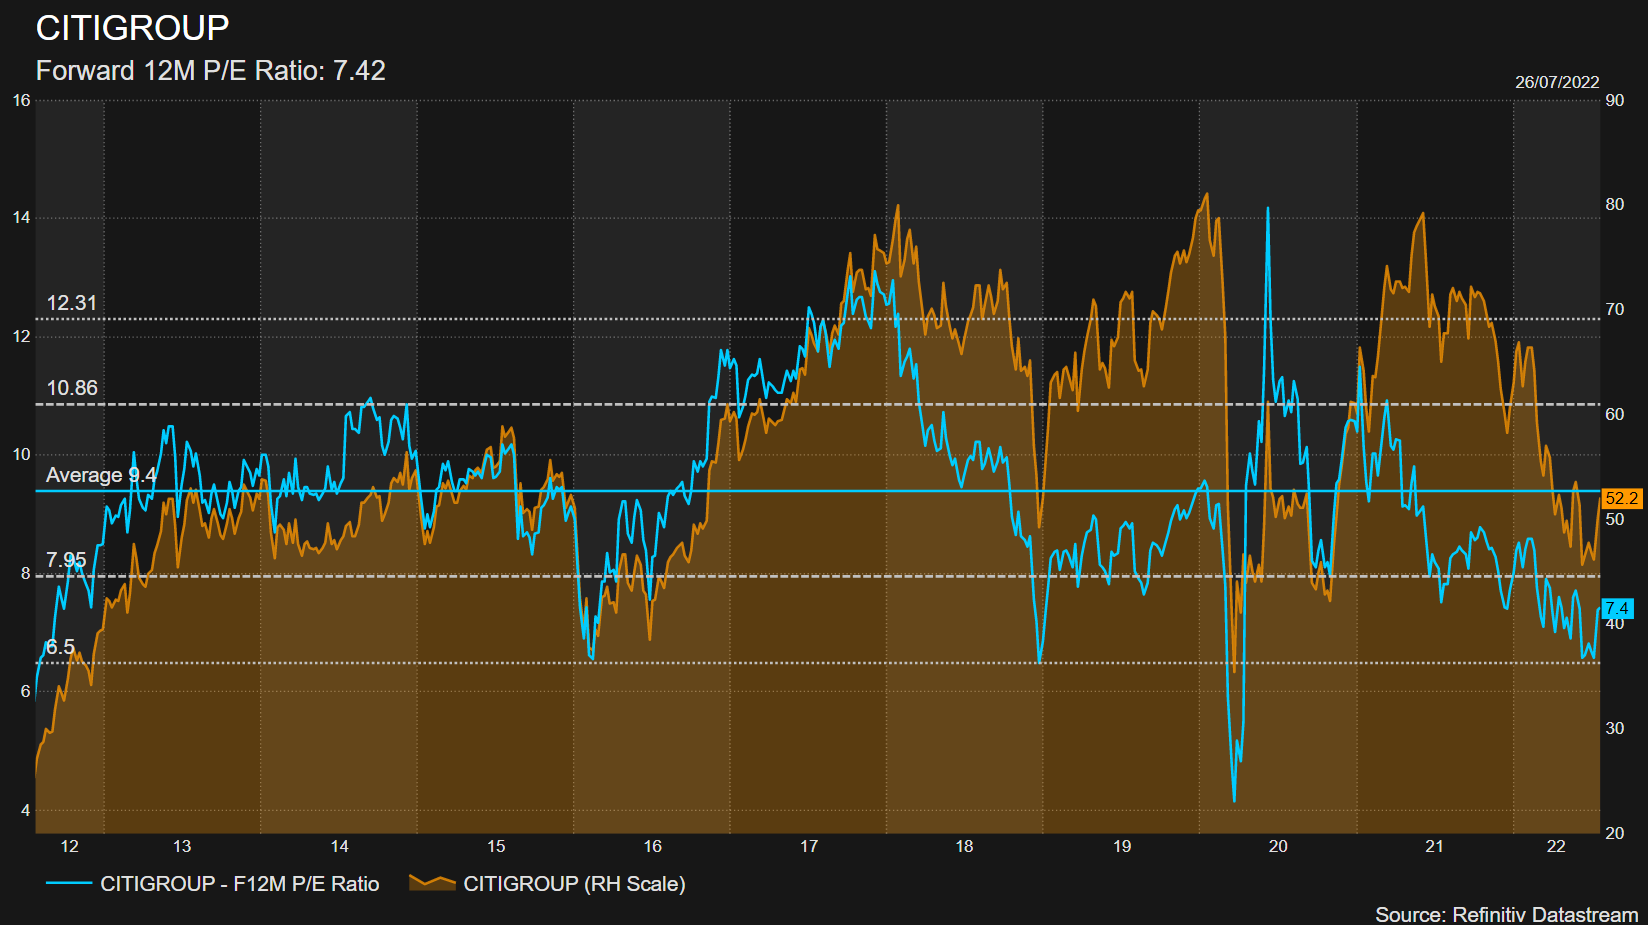
Our relative valuation uses Citi's current P/E ratio of just over 6, but if we assume the buyback program resumes later this year or next year that gives some upside to current projections. Citi has paused its buybacks but has reduced its share count aggressively in recent years.
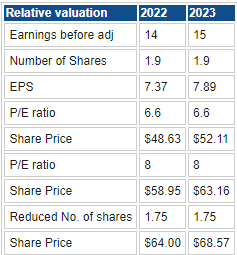
Source: Refinitiv, FXStreet calculations
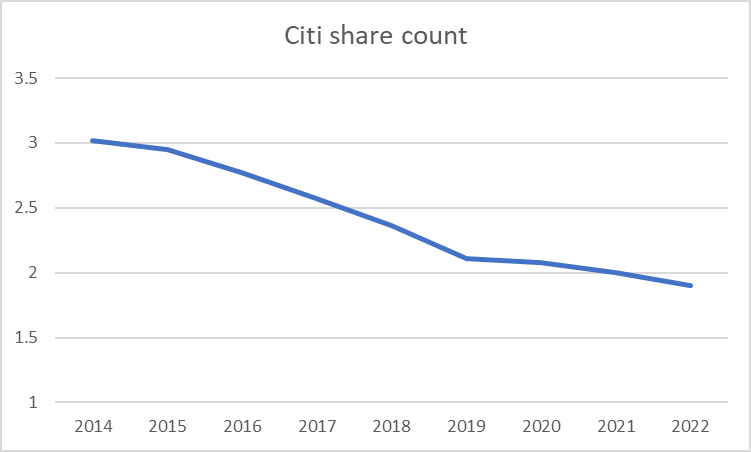
Source: Ycharts, Refinitiv, FXStreet calculations
A continued reduction in the share count drives outperformance, both in terms of EPS and dividends per share, and increases our valuation.
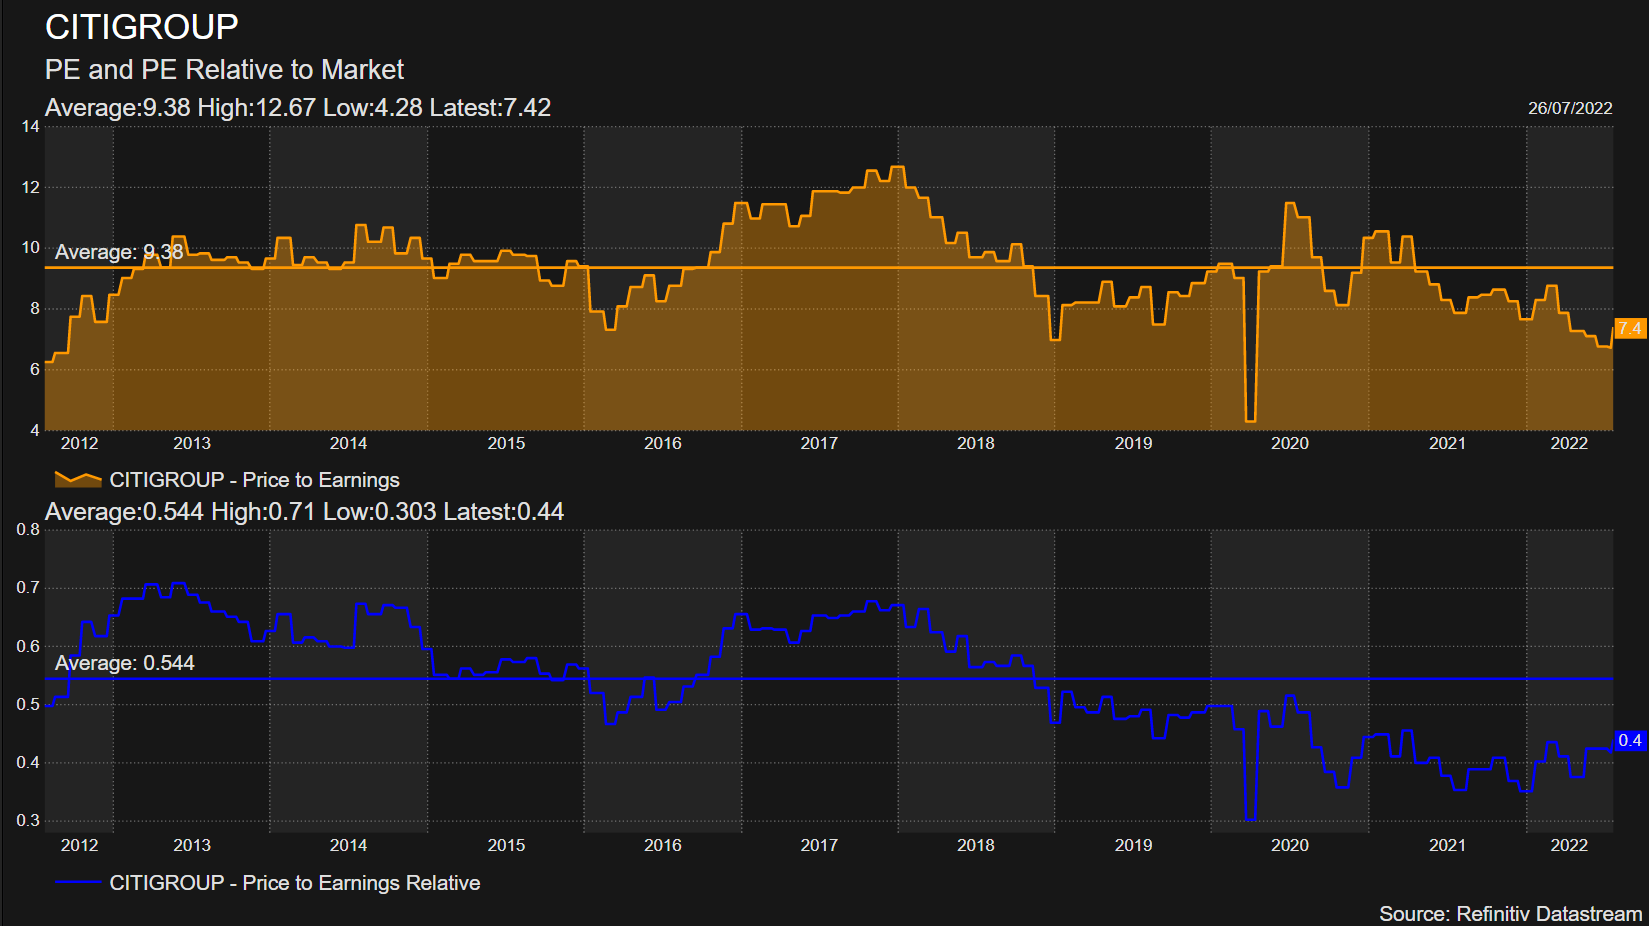
Based on all this, we currently run with an average price target of $60. Of note, we show below how the P/E ratio has been as high as 14 and averaged nearly 10 over the last ten years. Currently, it is depressed, which is perhaps why Warren Buffet stepped in. Despite usually adjusting our price target lower to account for a bear market and recession, we are leaving it at $60 given the low P/E rating. We believe the low P/E reflects low confidence in the former management team following years of underperformance. This low rating is also reflected, and so has priced in the recession and bear market. Hence we are not adjusting our price target lower.
Citi technical analysis
C stock forecast could get worse before it gets better. The chart is clearly bearish, but the recent earnings may have formed a potential bottom. Holding above $44 is key for C share price as it defends the recent low in June but also the lows from October 2020. Traditionally rising interest rates tend to favor commercial banks, so long as bad debts are kept relatively controlled. Net interest margin should continue to grow. Holding above $44 allows Citi to move above the volume gap, which would make a move to $60 easier to achieve. $60 is a key level as the 200-day and 50-day moving average currently sit at that level.
Overall, we remain happy with using $60 as a 12-month price target based on the Citi stock chart. Breaking above there would represent a bullish move as that would break the moving averages and the channel. Citi does need to hold above $44, however, which it may see in the short term.
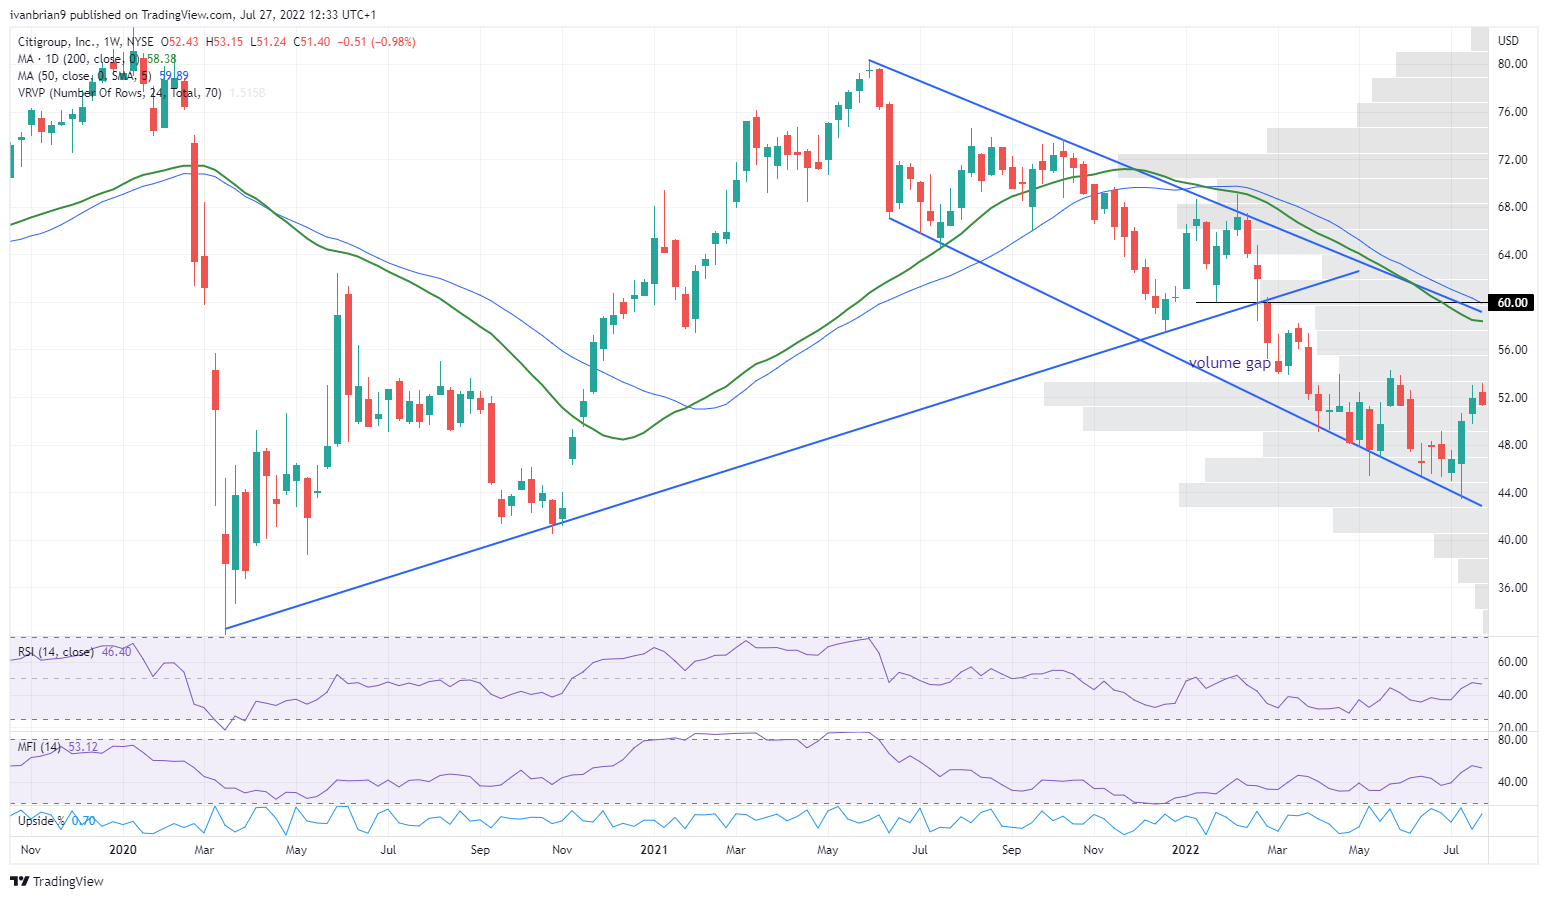
Citi (C) chart, weekly
Citi: Executive summary, recommendation and price target
$60 is our 12-month price target, but there may be some further near-term downward pressure despite strong results. However, those strong earnings combined with a new management team we feel should be able to drive the business forward and lead to the market rerating Citi shares higher. This underpins the valuation in our view. Given that $60 is nearly 20% above the current share price, we have a BUY rating on Citi (C) stock.
Upside risks
- The economy recovers quickly.
- Market rerates Citi more quickly than we forecast.
Downside risks
- Depe recession and bear market mean bad debts rise even more than our pessimistic projection.
- Buyback not resumed
Author

Ivan Brian
FXStreet
Ivan Brian started his career with AIB Bank in corporate finance and then worked for seven years at Baxter. He started as a macro analyst before becoming Head of Research and then CFO.


