All-time highs in sight: The critical signals you can’t ignore in S&P 500 [Video]
![All-time highs in sight: The critical signals you can’t ignore in S&P 500 [Video]](https://editorial.fxstreet.com/images/Markets/Equities/SP500/wall_street_nyse3-637299021683820849_XtraLarge.jpg)
Watch the free-preview video below extracted from the wlgc session before the market open on 14 may 2024 to find out the following:
- Is the S&P 500 showing signs of a sustainable rally, or are we headed for a pullback
- Why the volume in the past week might be a concern
- The most important signal to judge for a bearish reversal
- Analogue comparison of the current volume
Market environment
The bullish vs. bearish setup is 462 to 91 from the screenshot of my stock screener below.
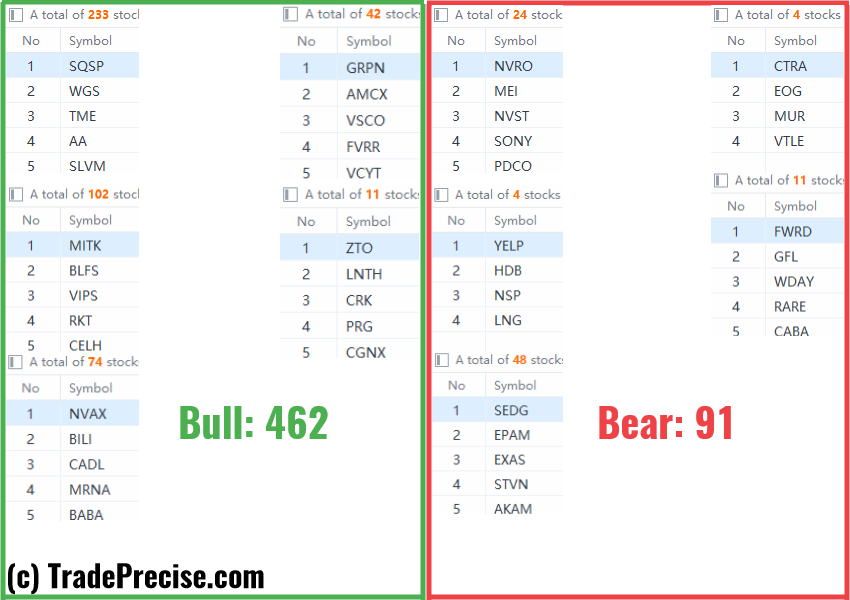
There is no shortage of bullish setup while the market is still grinding up.
However, I am paying close attention to any potential reversal from the key levels due to the volume analogue as discussed in the video.
Meanwhile, enjoying the trade entry setup as they are still working well.
Market comment
8 “low-hanging fruits” (VIST, RMD) trade entries setups + 10 actionable setups (DELL) were discussed during the live session before the market open (BMO).
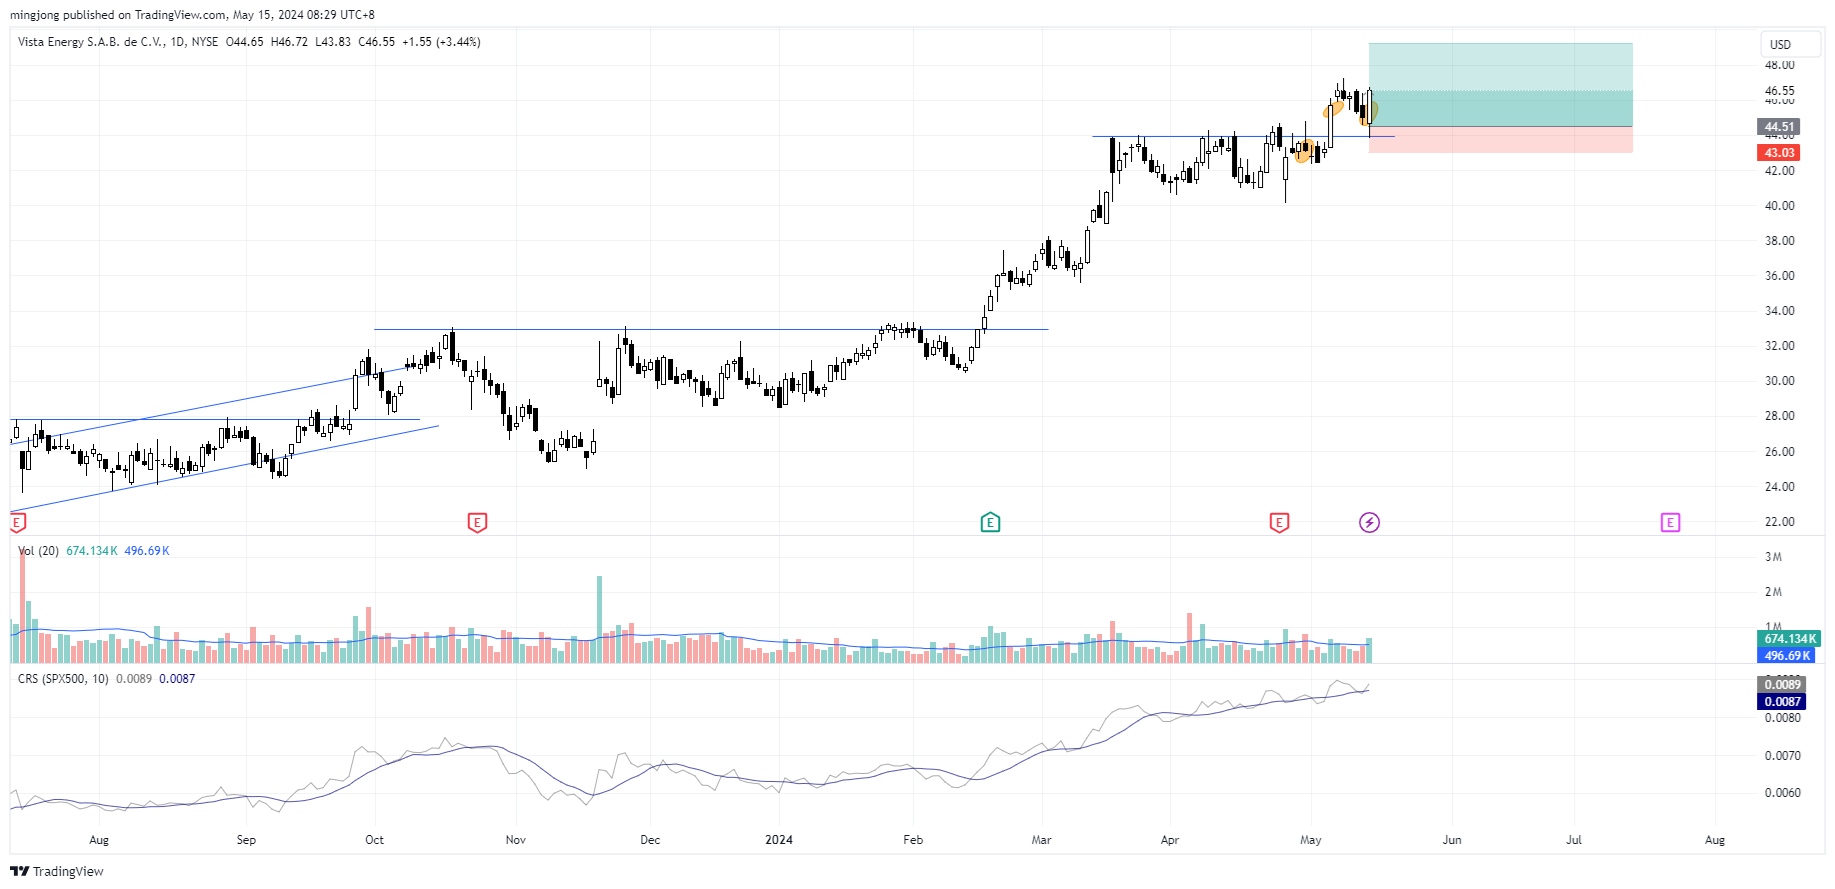
VIST
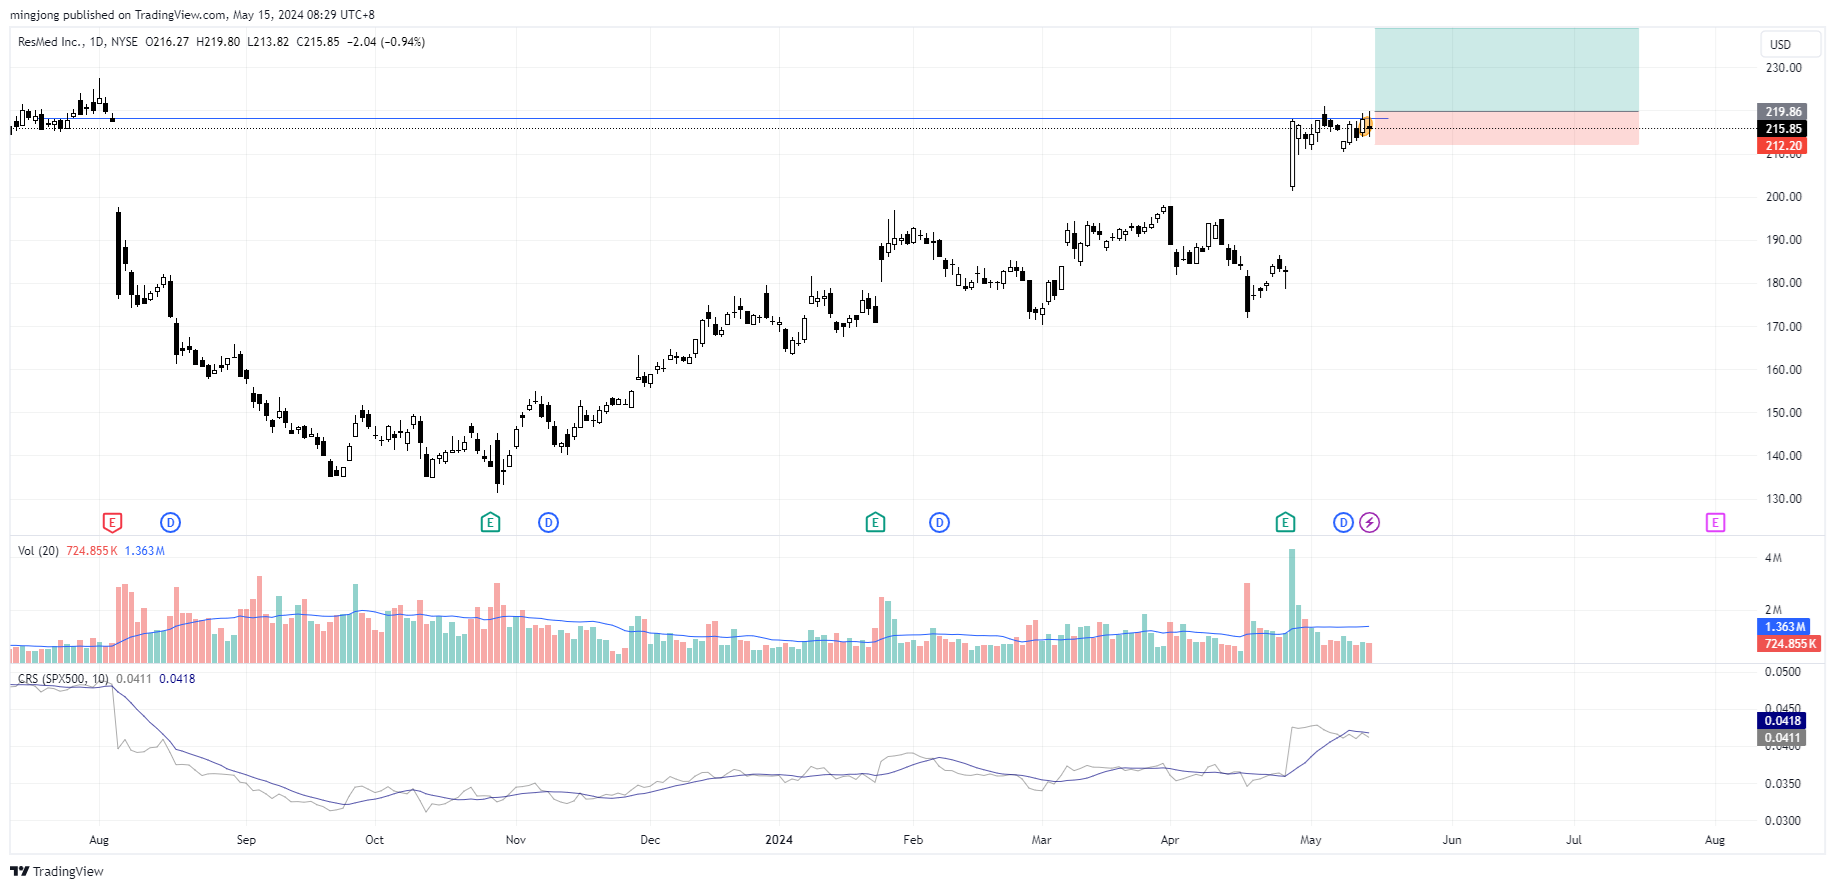
RMD
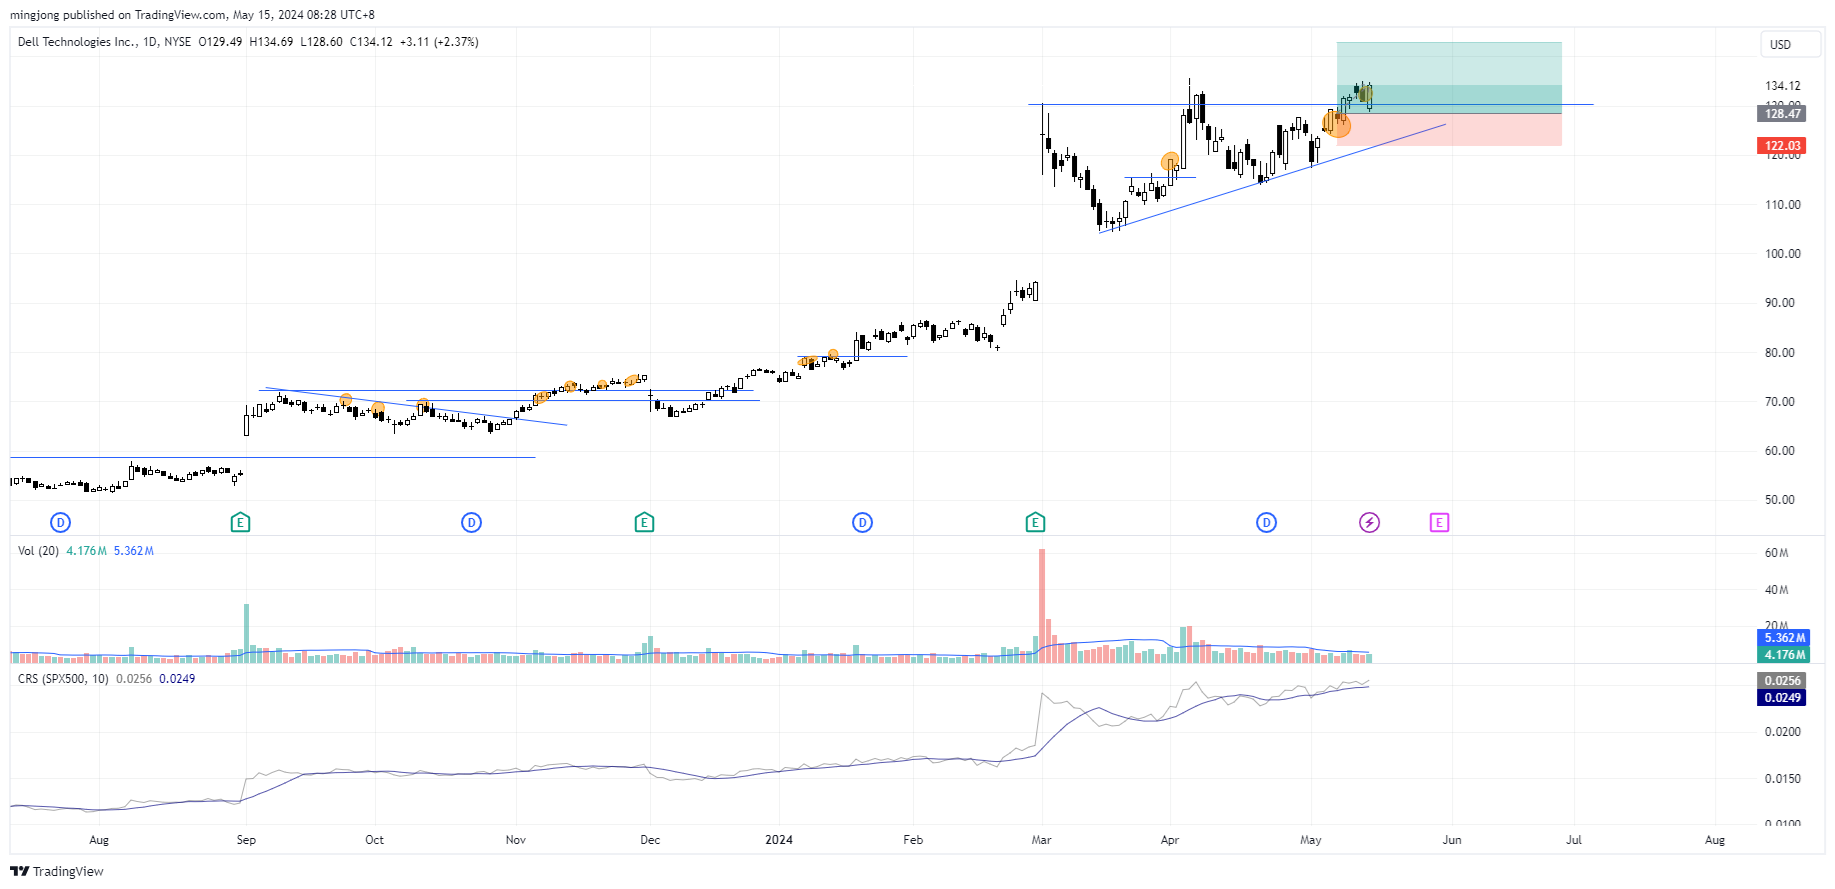
DELL
Author

Ming Jong Tey
Independent Analyst
Ming Jong Tey has been trading since 2008. He started his learning journey from technical analysis (indicators, Fibonacci, etc...) to value investing. Throughout his journey, he develops an interest in price action with chart pattern trading.


