Alibaba Group Holdings Ltd.,(BABA) Elliott Wave technical analysis [Video]
![Alibaba Group Holdings Ltd.,(BABA) Elliott Wave technical analysis [Video]](https://editorial.fxstreet.com/images/Markets/Equities/Mexbolsa/currency-exchange-rate-board-5927602_XtraLarge.jpg)
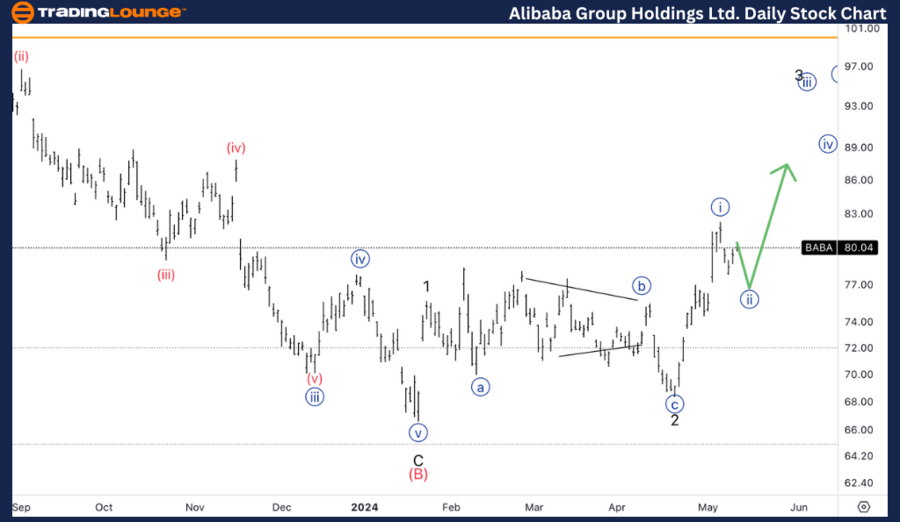
Alibaba Group Holdings Ltd.,(BABA) Daily Chart.
BABA Elliott Wave technical analysis
Function: Trend.
Mode: Impulsive.
Structure: Motive.
Position: Minute {i} or {a}.
Direction: Correction in {ii}.
Details: We had five waves up in either a wave C, or else as shown in the chart we could be in wave {i} of else 3.
BABA Elliott Wave technical analysis – Daily chart
On the daily chart, BABA's trend is identified as impulsive, with a motive structure, likely positioned in either Minute {i} or {a}. However, the analysis suggests a corrective phase in Minute {ii}, following a five-wave uptrend, possibly representing Wave C or {i} of Wave 3. This interpretation indicates a temporary pullback before potential continuation to the upside.
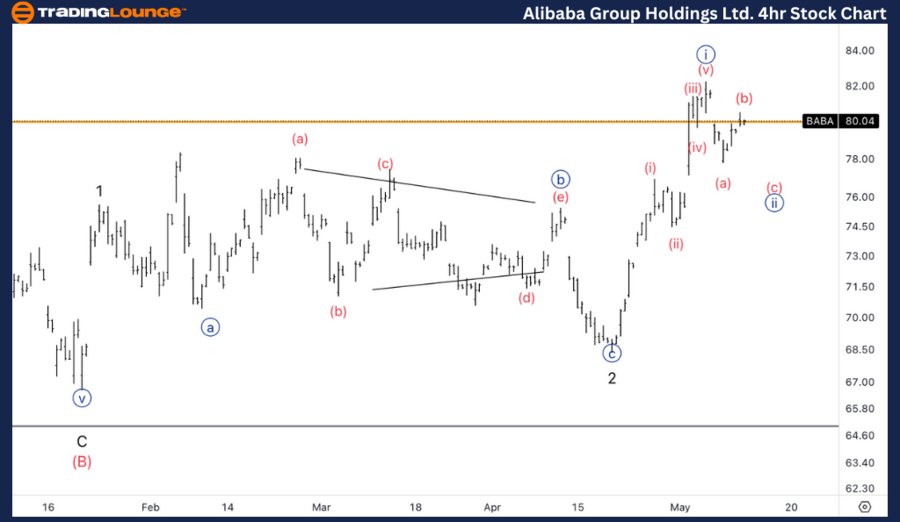
BABA Elliott Wave technical analysis – Four-hour chart
Similarly, the 4-hour chart echoes the impulsive trend structure, with BABA positioned in either Minute {i} or {a}. The analysis anticipates a correction in Minute {ii}, providing an opportunity for traders to capitalize on potential long positions. The correction is projected to occur around the Classic Trading Levels Pattern (CTLP) at $80, which could act as a significant support level.
Function: Trend.
Mode: Impulsive.
Structure: Motive.
Position: Minute {i} or {a}.
Direction: Correction in {ii}.
Details: Looking for a correction around TL8 at 80$, ideally looking for a ClassicTradingLevelsPattern(CTLP) around 80$ to then looking for longs.
In the realm of Elliott Wave analysis, Alibaba Group Holdings Ltd. (BABA) presents an intriguing setup, with both the daily and 4-hour charts indicating potential corrections amidst an overall impulsive trend.
BABA Elliott Wave technical analysis [Video]
Author

Peter Mathers
TradingLounge
Peter Mathers started actively trading in 1982. He began his career at Hoei and Shoin, a Japanese futures trading company.


