Adidas is a German multinational corporation designing and manufacturing shoes, clothing and accessories. Created in 1934 by Adolf Dassler and headquartered in Herzogenaurach, Germany, the company is the largest sportswear manufacturer in Europe. Adidas is a part of both DAX40 and of SX5E indices. From the all-time lows, Adidas is showing a strong bullish behavior. In particular, from the 2008 lows it has gained more than 10x in value. In the initial article from January 2021, we were calling for a new cycle up. We were right, Adidas has printed a new all-time high at 336.25. In this blog, we provide an update.

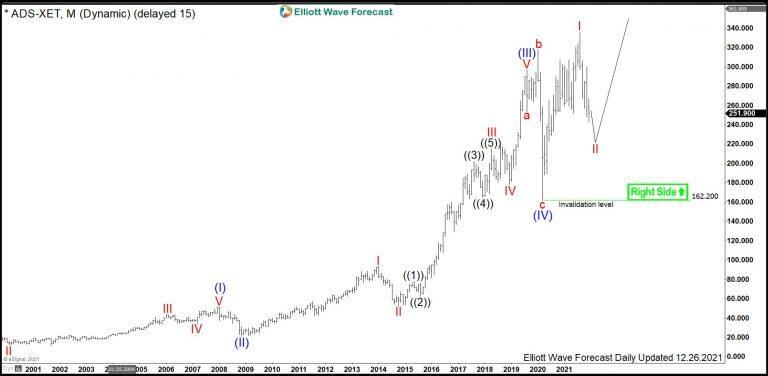
Adidas Monthly Elliott Wave Analysis 12.28.2021

The monthly chart below shows the Adidas stock $ADS traded at XETRA. From the all-time lows, the stock price has developed a cycle higher in blue wave (I) of super cycle degree towards January 2008 highs at 51.63. From there, a correction lower in blue wave (II) has retraced part of the rise. It has printed a bottom on November 2008 at 21.22. From November 2008 lows, a cycle in wave (III) has extended towards August 2019 highs at 296.75. Hereby, the extension beyond 4.236 qualifies the cycle as a 3rd wave. From the August 2019 highs, a correction lower in wave (IV) has unfolded as an expanded flat structure towards the March 2020 lows at 162.20.

From the March 2020 lows, a new cycle in wave (V) is in progress and has broken to the new all-time highs. The minimum target higher being 328.80 has been already met. However, $ADS might have ended only the wave I of (V). Therefore, investors can buy Adidas in a pullback expecting more upside beyond 328.80 target.

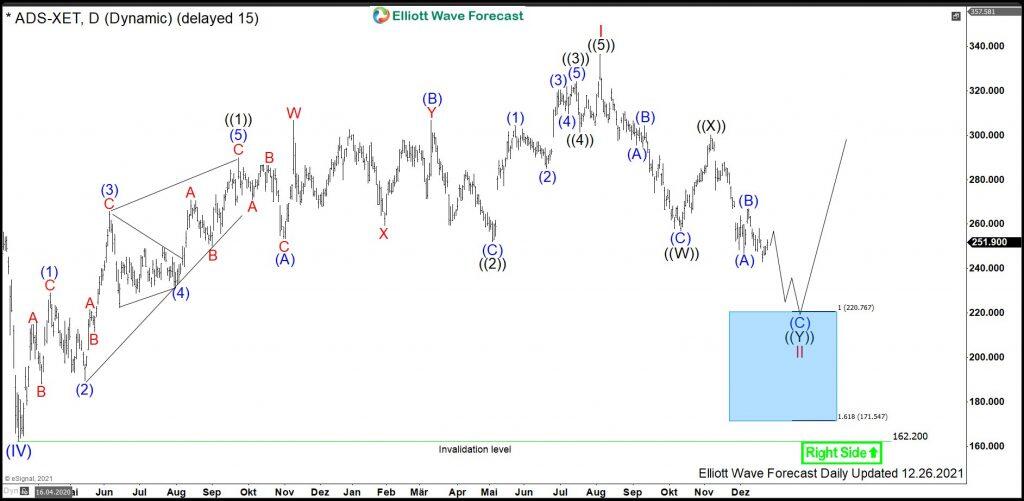
Adidas Daily Elliott Wave Analysis 12.28.2021

The daily chart below shows in more detail the advance higher in red wave I of blue wave (V) and the pullback in wave II. First, from the March 2020 lows at 162.20, a cycle higher in red wave I has unfolded as an impulse and printed its top in August 2021 at 336.25. Hereby, wave ((1)) shows the extension. Currently, a correction lower in red wave II is taking place and should find support in 3, 7 or 11 swings for more upside in wave III of (V). Right now, while $ADS is trading below 300.25, the prices can fall into the 220.76-171.54 area. There, buyers can enter the market for a rally to the new all-time highs.

Share: Feed news

FURTHER DISCLOSURES AND DISCLAIMER CONCERNING RISK, RESPONSIBILITY AND LIABILITY Trading in the Foreign Exchange market is a challenging opportunity where above average returns are available for educated and experienced investors who are willing to take above average risk. However, before deciding to participate in Foreign Exchange (FX) trading, you should carefully consider your investment objectives, level of xperience and risk appetite. Do not invest or trade capital you cannot afford to lose. EME PROCESSING AND CONSULTING, LLC, THEIR REPRESENTATIVES, AND ANYONE WORKING FOR OR WITHIN WWW.ELLIOTTWAVE- FORECAST.COM is not responsible for any loss from any form of distributed advice, signal, analysis, or content. Again, we fully DISCLOSE to the Subscriber base that the Service as a whole, the individual Parties, Representatives, or owners shall not be liable to any and all Subscribers for any losses or damages as a result of any action taken by the Subscriber from any trade idea or signal posted on the website(s) distributed through any form of social-media, email, the website, and/or any other electronic, written, verbal, or future form of communication . All analysis, trading signals, trading recommendations, all charts, communicated interpretations of the wave counts, and all content from any media form produced by www.Elliottwave-forecast.com and/or the Representatives are solely the opinions and best efforts of the respective author(s). In general Forex instruments are highly leveraged, and traders can lose some or all of their initial margin funds. All content provided by www.Elliottwave-forecast.com is expressed in good faith and is intended to help Subscribers succeed in the marketplace, but it is never guaranteed. There is no “holy grail” to trading or forecasting the market and we are wrong sometimes like everyone else. Please understand and accept the risk involved when making any trading and/or investment decision. UNDERSTAND that all the content we provide is protected through copyright of EME PROCESSING AND CONSULTING, LLC. It is illegal to disseminate in any form of communication any part or all of our proprietary information without specific authorization. UNDERSTAND that you also agree to not allow persons that are not PAID SUBSCRIBERS to view any of the content not released publicly. IF YOU ARE FOUND TO BE IN VIOLATION OF THESE RESTRICTIONS you or your firm (as the Subscriber) will be charged fully with no discount for one year subscription to our Premium Plus Plan at $1,799.88 for EACH person or firm who received any of our content illegally through the respected intermediary’s (Subscriber in violation of terms) channel(s) of communication.

Recommended content


Recommended content

Editors’ Picks

EUR/USD clings to daily gains above 1.0650

EUR/USD clings to daily gains above 1.0650

EUR/USD gained traction and turned positive on the day above 1.0650. The improvement seen in risk mood following the earlier flight to safety weighs on the US Dollar ahead of the weekend and helps the pair push higher.

EUR/USD News

GBP/USD recovers toward 1.2450 after UK Retail Sales data

GBP/USD recovers toward 1.2450 after UK Retail Sales data

GBP/USD reversed its direction and advanced to the 1.2450 area after touching a fresh multi-month low below 1.2400 in the Asian session. The positive shift seen in risk mood on easing fears over a deepening Iran-Israel conflict supports the pair.

GBP/USD News

Gold holds steady at around $2,380 following earlier spike

Gold holds steady at around $2,380 following earlier spike

Gold stabilized near $2,380 after spiking above $2,400 with the immediate reaction to reports of Israel striking Iran. Meanwhile, the pullback seen in the US Treasury bond yields helps XAU/USD hold its ground.

Gold News

Bitcoin Weekly Forecast: BTC post-halving rally could be partially priced in Premium

Bitcoin Weekly Forecast: BTC post-halving rally could be partially priced in

Bitcoin price shows no signs of directional bias while it holds above  $60,000. The fourth BTC halving is partially priced in, according to Deutsche Bank’s research. 

Read more

Week ahead – US GDP and BoJ decision on top of next week’s agenda

Week ahead – US GDP and BoJ decision on top of next week’s agenda

US GDP, core PCE and PMIs the next tests for the Dollar. Investors await BoJ for guidance about next rate hike. EU and UK PMIs, as well as Australian CPIs also on tap.

Read more

Forex MAJORS

Cryptocurrencies

Signatures