![]() Russ Allen
Russ Allen
Online Trading Academy
In today’s global economic environment, each and every one of us needs to be a long-term investor if we ever intend to retire (or stay retired). Job security and fixed pensions are things of the past, while inflation is here to stay.
Public pension program benefits (such as Social Security) must inevitably decline as the number of workers per retiree steadily drops over the next decades. Meanwhile, if other social programs expand the drop in Social Security benefits could be further accelerated because the money for those programs has to come from somewhere. The size of the millennials’ voting bloc growing to exceed that of the baby boomers could further exacerbate the issue as their priorities and vision will likely differ from the retired boomers and Gen-Xers. There is simply no option not to plan to take care of your own financial needs in retirement, because no one else is going to do it. Hence – we all must be long-term investors, like it or not.
For your long-term investments, the perfect choice would be one that grows in value every year, while paying out substantial income, with no chance of any loss. As you probably know, there is no such investment. Instead, we must choose between investments with varying levels of the three main measures of an investment:
-
Growth – an increase in value over time, so that assets can eventually be sold at a profit.
-
Cash Flow – regular periodic income in the form of interest, dividends, rents or royalties.
-
Safety – freedom from risk of loss
Safety
By far the most important thing you can do with your retirement savings is not lose them – safety must be paramount.
There is no such thing as a perfectly safe investment. The closest we can get to an investment with no risk of loss of principal would be to keep cash in a federally insured bank account, or to buy short-term U.S. Treasury securities. The chances that the money you commit to one of these will not be available when you want it are very small (but not entirely absent – ask bank depositors in Cypress). However, cash in the bank and short-term Treasuries tend to yield very small interest income, such that the return is negative after inflation and taxes. Note that this is generally true, and not just at times of very low interest rates. By keeping cash in the bank, we would be choosing a very high degree of safety while sacrificing any reasonable chance of growth of principal, and likely accepting a net cash flow that is actually negative.
The box score for cash is:
-
Safety: Very High
-
Growth: None
-
Cash Flow: Negative after tax
So, although we all need to keep some cash on hand for immediate spending needs and a rainy-day fund, it can in no way be considered an investment.
As we discover when we look at other types of investments, it is generally the case that any investment that offers a high degree of safety sacrifices growth and cash flow; while any investment that promises an extreme amount of growth (like stocks, real estate or interest in a small business), or an extremely high current cash flow (like junk bonds or low-quality second mortgages), does so at the cost of safety of principal. Anything that has a chance of a big gain generally also has a chance of a big loss; anything that has a very small chance of a loss generally also has little to no chance of a large profit.
So, what is an investor to do? The answer is that we need to select several different investments and manage each of them so as to optimize returns.
In the graph below, long-term average rates of return are shown for certain asset classes, as represented by exchange-traded funds based on those assets. The time period is from 1972 through 2018 for most assets. This includes several recessions/market downturns as well as periods of strong economies and markets. For each asset there is a point on the graph labeled with the name of an ETF that represents that asset. The vertical axis on the graph shows the Compound Average Annual Growth Rate (CAGR), the best measure of average annual returns. The horizontal axis measures the standard deviation of those returns. This is a measure of how variable those returns were over the period studied.
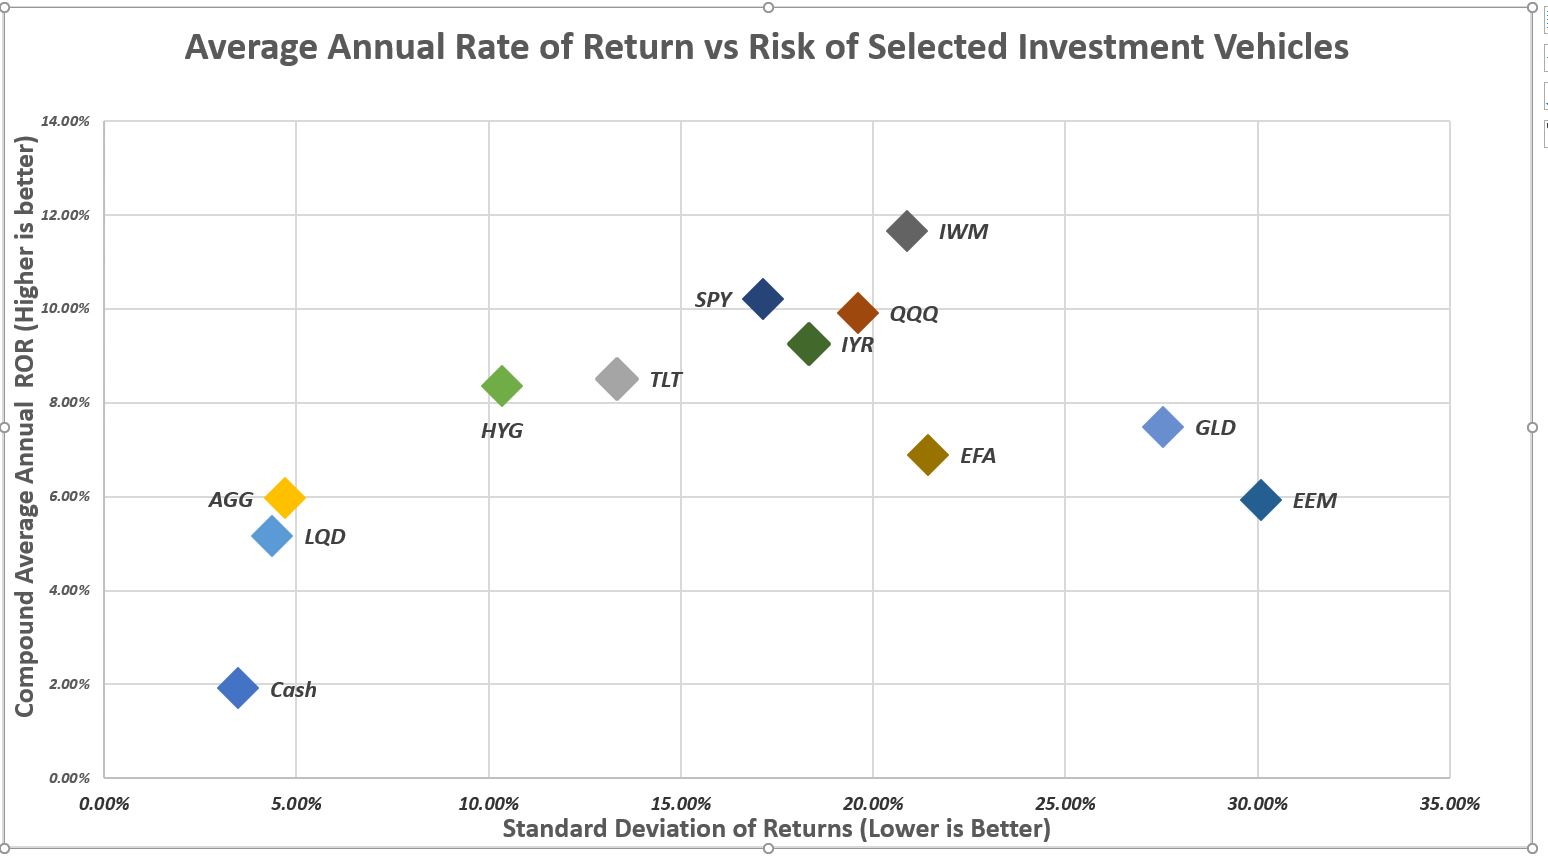
Assets shown above:
-
Cash – Average interest paid on short-term bank deposits
-
LQD – Investment grade corporate bonds
-
AGG – U.S. Bond Index, including corporate and U.S. Treasury securities
-
HYG – High-yield bonds (Junk Bonds)
-
TLT – Long-term (20-year+) U.S. Treasury bonds
-
SPY – Standard & Poor’s 500 stock market index
-
IYR – REIT index
-
QQQ – NASDAQ 100 index (large cap tech stocks)
-
IWM – U.S. Small cap stocks
-
EFA – Non-U.S. large cap stocks
-
EEM – Emerging Market Stocks
In the graph above, higher rates of return are shown higher on the vertical scale. The left-right axis of the graph represents a measure of the risk of holding that asset as measured by the standard deviation of that asset’s annual return. Higher risk is farther to the right.
The best investment would be one that appears on the graph as close as possible to the upper left corner – high return (near top of chart) with minimal risk (near left side of chart). The lower right corner would be the worst place to be – low returns with high risk.
For example, the rightmost point on the graph is labeled EEM. This is an exchange-traded fund that owns stocks of companies in emerging markets. EEM’s average rate of return is 5.93% (including both price change and dividends), and its standard deviation is 30.08%. The standard deviation defines the range within which the rate of return could be expected to be in a typical year; that is where its past history has placed it about 68% of the time.
In the case of EEM, its risk is extreme. With an average ROR of about 6% and a standard deviation of about 30%, the range within which a given year’s rate of return might fall is anywhere between (6% + 30%) down to (6% – 30%) – that is from a gain of 36% down to a loss of 24%. Such a range would be considered normal for this asset! Many people would not be comfortable with an investment where a 24% loss in a year would be normal, even if a 36% gain would also be normal.
For around a 6% return, a far less risky choice would be AGG, the ETF representing the U.S. Bond index. It has almost the same average rate of return as EEM (5.97%) – but a standard deviation of only 4.71%. This means the range of returns for a typical year would be from + 1.26% to +10.68%.
From this comparison, it should be clear that any investment that has a standard deviation that is larger than its average rate of return is expected to have losing years within its typical range of returns. The larger the standard deviation is compared to the average, the larger the chance that any given year will be a losing year. That is why the size of the standard deviation is a measure of risk of holding the asset. Think of the average rate of return as what you might expect as a long-term average if you held the asset for a hundred years. Think of the size of the standard deviation as the chance that any one year will be massively different from the average – up or down.
Higher-earning assets like IWM, SPY, IYR and QQQ (with average rates of return in the 9-12% range) all have standard deviations that are larger than the average return, but not nearly as dramatically as EEM. Many people would (and do) consider that the risk of owning these assets is justified, as the chances of a disastrous year are not large compared to the average return.
Which brings us back to the point that to make sure that we have some chance for growth as well as some funds earning money at all times (and not losing it), it is necessary to select multiple asset types to invest in, and then properly manage each one.
In future articles we’ll focus more on the growth and income aspects of assets for your portfolio. In all your investing remember – safety first!
This content is intended to provide educational information only. This information should not be construed as individual or customized legal, tax, financial or investment services. As each individual's situation is unique, a qualified professional should be consulted before making legal, tax, financial and investment decisions. The educational information provided in this article does not comprise any course or a part of any course that may be used as an educational credit for any certification purpose and will not prepare any User to be accredited for any licenses in any industry and will not prepare any User to get a job. Reproduced by permission from OTAcademy.com click here for Terms of Use: https://www.otacademy.com/about/terms
Editors’ Picks

EUR/USD keeps the rangebound trade near 1.1850
EUR/USD is still under pressure, drifting back towards the 1.1850 area as Monday’s session draws to a close. The modest decline in spot comes as the US Dollar picks up a bit of support, while thin liquidity and muted volatility, thanks to the US market holiday, are exaggerating price swings and keeping trading conditions choppy.

GBP/USD flirts with daily lows near 1.3630
GBP/USD has quickly given back Friday’s solid gains, turning lower at the start of the week and drifting back towards the 1.3630 area. The focus now shifts squarely to Tuesday’s UK labour market report, which is likely to keep the quid firmly in the spotlight and could set the tone for Cable’s next move.

USD/JPY advances on weak Japanese GDP, holiday-thinned trading
USD/JPY rises while US and Japanese markets remain closed for holidays. Weak Japanese Gross Domestic Product figures curb tightening expectations. Investors await speeches from Federal Reserve Vice Chair for Supervision.
Editors’ Picks

AUD/USD retargets 0.7100 ahead of RBA Minutes
AUD/USD keeps the slightly bid bias around 0.7070 ahead of the opening bell in Asia. Indeed, the pair reverses two daily pullbacks in a row, meeting some initial contention around 0.7050 while investors gear up for the release of the RBA Minutes early on Tuesday.
EUR/USD keeps the rangebound trade near 1.1850
EUR/USD is still under pressure, drifting back towards the 1.1850 area as Monday’s session draws to a close. The modest decline in spot comes as the US Dollar picks up a bit of support, while thin liquidity and muted volatility, thanks to the US market holiday, are exaggerating price swings and keeping trading conditions choppy.

Gold battle around $5,000 continues
Gold is giving back part of Friday’s sharp rebound, deflating below the key $5,000 mark per troy ounce as the new week gets underway. Modest gains in the US Dollar are keeping the metal in check, while thin trading conditions, due to the Presidents Day holiday in the US, are adding to the choppy and hesitant tone across markets.

AI Crypto Update: Bittensor eyes breakout as AI tokens falter
The artificial intelligence (AI) cryptocurrency segment is witnessing heightened volatility, with top tokens such as Near Protocol (NEAR) struggling to gain traction amid the persistent decline in January and February.

The week ahead: Key inflation readings and why the AI trade could be overdone
It is likely to be a quiet start to the week, with US markets closed on Monday for Presidents Day. European markets are higher across the board and gold is clinging to the $5,000 level after the tamer than expected CPI report in the US reduced haven flows to precious metals.
RECOMMENDED LESSONS
Making money in forex is easy if you know how the bankers trade!
I’m often mystified in my educational forex articles why so many traders struggle to make consistent money out of forex trading. The answer has more to do with what they don’t know than what they do know. After working in investment banks for 20 years many of which were as a Chief trader its second knowledge how to extract cash out of the market.
5 Forex News Events You Need To Know
In the fast moving world of currency markets where huge moves can seemingly come from nowhere, it is extremely important for new traders to learn about the various economic indicators and forex news events and releases that shape the markets. Indeed, quickly getting a handle on which data to look out for, what it means, and how to trade it can see new traders quickly become far more profitable and sets up the road to long term success.
Top 10 Chart Patterns Every Trader Should Know
Chart patterns are one of the most effective trading tools for a trader. They are pure price-action, and form on the basis of underlying buying and selling pressure. Chart patterns have a proven track-record, and traders use them to identify continuation or reversal signals, to open positions and identify price targets.
7 Ways to Avoid Forex Scams
The forex industry is recently seeing more and more scams. Here are 7 ways to avoid losing your money in such scams: Forex scams are becoming frequent. Michael Greenberg reports on luxurious expenses, including a submarine bought from the money taken from forex traders. Here’s another report of a forex fraud. So, how can we avoid falling in such forex scams?
What Are the 10 Fatal Mistakes Traders Make
Trading is exciting. Trading is hard. Trading is extremely hard. Some say that it takes more than 10,000 hours to master. Others believe that trading is the way to quick riches. They might be both wrong. What is important to know that no matter how experienced you are, mistakes will be part of the trading process.
The challenge: Timing the market and trader psychology
Successful trading often comes down to timing – entering and exiting trades at the right moments. Yet timing the market is notoriously difficult, largely because human psychology can derail even the best plans. Two powerful emotions in particular – fear and greed – tend to drive trading decisions off course.