Why Any Serious Trader Should Use the “New York Close” Chart

Why New York Charts...
Why any serious trader should use the New York Close chart? Learning to trade the forex market can be a tough experience. You have probably read a lot of articles about trading strategies, registered to various online forex forums, and you are practicing whenever you have time to look at the charts. But, there is probably one thing that you've missed, that can have an enormous difference in your trading performance and learning efforts.
It's the type of charts that you use. To make the right trading decisions based on price-action, you need a simple and clean chart which shows you the real market sentiment, is compact and not cluttered with unnecessary information. You may ask, "Wait, but all charts are the same, aren't they?" -No, they are not. There is actually a big difference in the price feeds that forex brokers are using, with two main probably one thing that you’ve missed, that can have an enormous difference in your trading performance charts which we will discuss below: the GMT chart, and the New York Close chart.
The FOREX Market and New York Charts
Let me explain. The forex market is open six days per week, 24 hours a day. The New York session, London session, and Asia-Pacific trading session are all open at a different time, which makes the forex market open around the clock. The following table shows when the trading sessions open according to EST and GMT time zones.
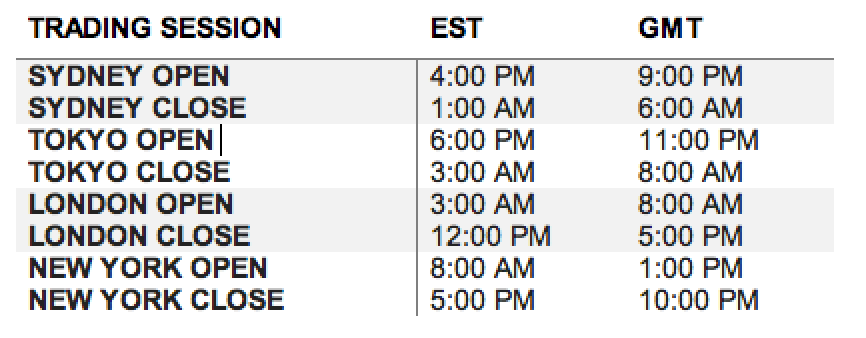
Not all trading sessions have the same daily trading volume. You probably already know, that most of the market volatility takes place with the overlap between the London and New York session, which is from 8:00 AM to 12:00 PM EST. After that, the only session which has a significant market impact is the New York session, which ends each day at 5:00 PM from Monday to Friday. A more thorough explanation of why I am using the Daily timeframe can be found HERE.
What you want to look at is the closing price of the New York session. Unfortunately, the majority of brokers use chart types that are based on GMT time. This means, each candle opens at exactly 00:00 AM GMT, which creates a total of six daily candles per week. This type of charting creates unnecessary confusion and fake signals, as it usually has a small "Sunday" candle which opens at Sunday 11:00 PM GMT and closes at 00:00 AM GMT.
Be Careful: GMT charts are cluttered with redundant, unnecessary information (candles) which can also be confused with doji candles. Doji candles have a small body and usually mean a possible trend reversal, but as they are not true daily candles they are not relevant!
New York Close charts, on the other hand, have a total of five candles during a week and equal the closing price of each New York session. The closing prices are the most important number for price-action trading, as they truly represent the fight between bulls and bears and show who won the battle in the previous trading session.
In a nutshell, charts that don't rely on the New York Close are not suitable for any type of professional trading and analysis and I can't recommend them at all. Beside the small "Sunday" candles that clutter the chart and create fake signals, the particular closing prices of GMT charts are not showing the real picture of the market sentiment. In the end, if you are not using New York Close FOREX Charts, you will not see the same results. That's why I encourage you to try them, especially if you are serious about price-action trading.
What Is The Difference Between GMT and New York Close Charts On The Screens?
Let's take a look at the difference between a GMT chart and a New York Close chart.
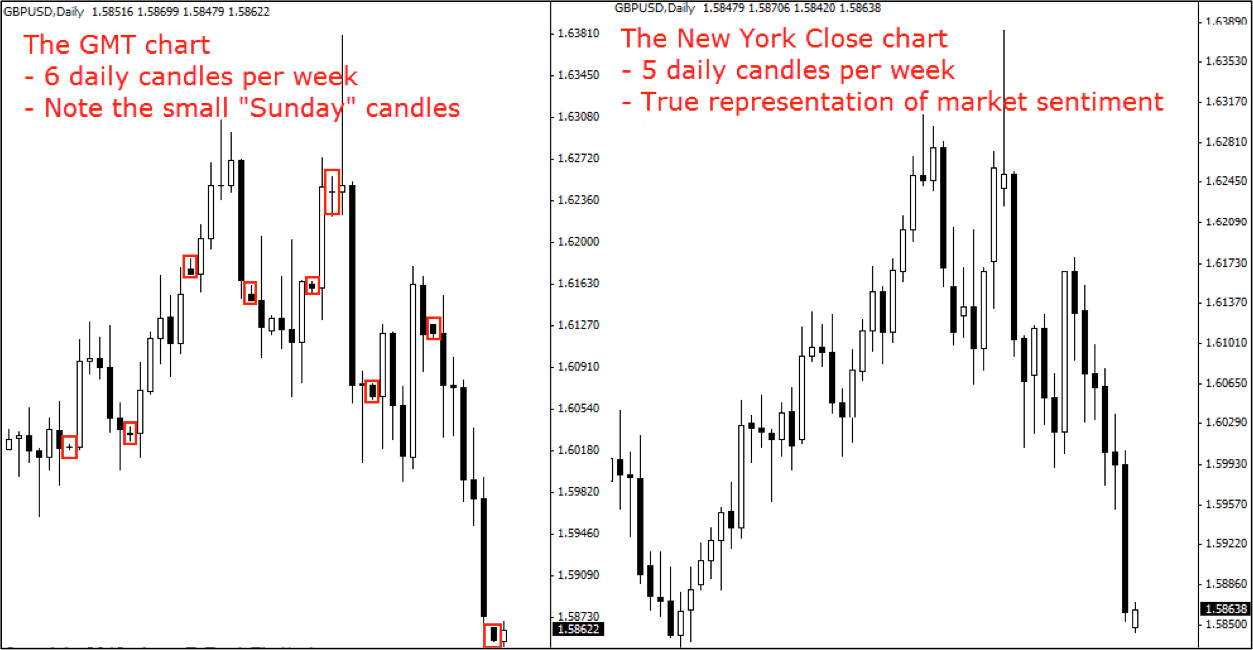
As you can see, the New York Close chart has no unnecessary "Sunday" candles which can confuse traders. Notice the small candles in red on the left GMT chart.
Be careful: If you rely on candlestick patterns in your trading, GMT charts would generate a lot of fake signals which could ultimately cost you a lot of money.
There are a lot of dojis and other candlesticks with small bodies, due to the small time-frame that they represent (only one hour after the Tokyo session opens). The New York Close chart, on the other hand, represents exactly the New York session trading day, which is extremely important for price-action trading. Closing prices are the most important prices for any market, not just forex. To make the right trading decisions, you need to make sure that you have the right price feed.
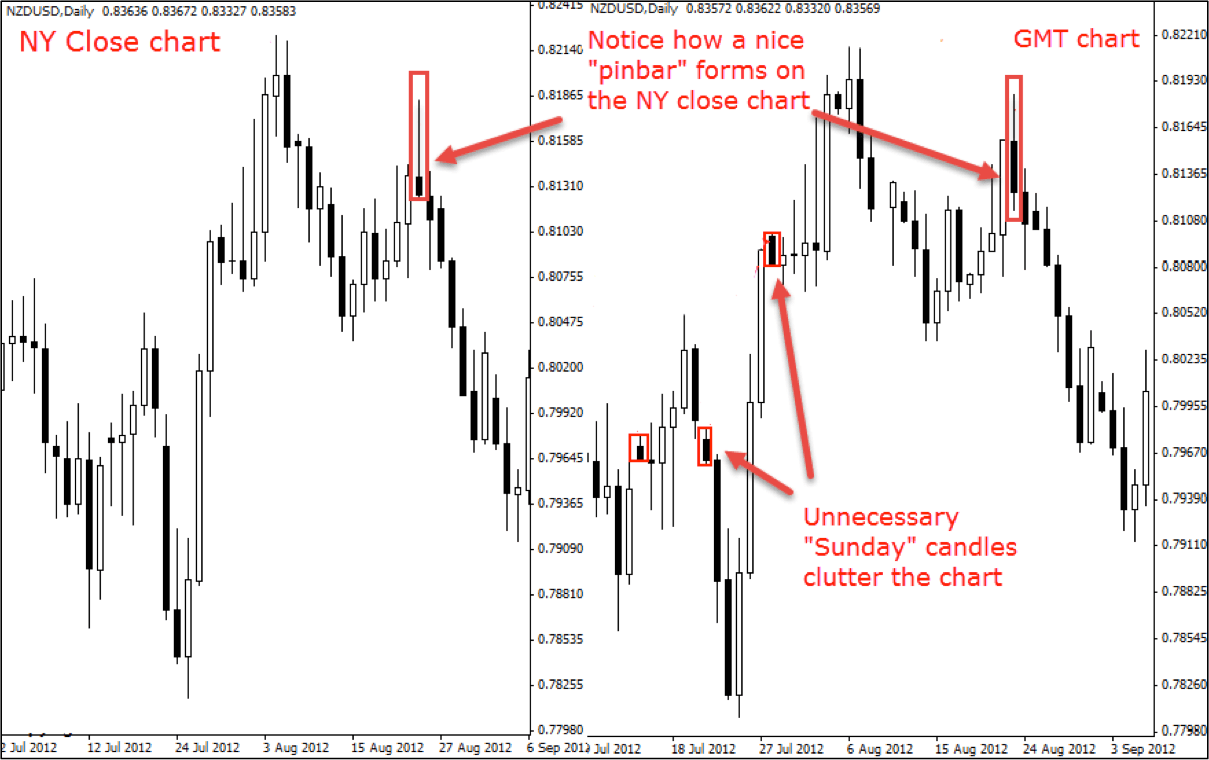
Look at the real-life difference between the NY Close chart (left) and GMT chart (right). While a nice pinbar candlestick forms on the NY Close chart, which triggers a profitable short position afterwards, there is nothing similar on the GMT chart. Even more, the "Sunday" candles dilute traders' attention and can give costly "fake signals", i.e. if the irrelevant "Sunday" candles form a doji or shooting star.
If you don't know which charts your broker uses, the easiest way to find out is by watching when the daily candle closes.
Tip: If the time is different from 5:00 PM EST, your broker uses another chart feed than the New York Close, most probably the GMT type of chart.
Final Words
am not saying that you can't be a profitable trader with GMT charts. I have traded myself on GMT charts before I discovered the New York Close charts. Once you switch to New York Close charts, you will immediately feel the difference while just looking at the chart – it's more compact, has 5 daily candles during a week, and you know that each candle's closing price represents the close of the New York session at 5:00 PM EST. I find it now much easier to discover profitable trading patterns while looking at the New York Close charts.
If you want to become a professional price-action trader, one of the most important things is to start from the foundation – which are the charts. You want compact and clean charts, which truly represent the fight between the bulls and the bears.
Happy Trading,
Author

Colibri Trader
Colibri Trader
Colibri Trader, as he is known in the circles, is based in London, UK. He Started his career in one of the leading prop trading houses at the time and then has moved out to form his own company- Colibri Trader Limited.


