Share:

When individuals set out to initiate their trading endeavor they have three aspects of trading they have to hone-in on. The first is risk, which is the easiest to figure out. Most new traders quickly grasp this concept.


How to Calculate Risk on a Trade

Measuring the risk on a trade is simply a measure of the amount of money exposed between the entry and the stop loss. A simple example would be in a trade of WTI (West Texas Intermediate) Crude Oil for the March Expiration (CLH20).  In this particular contract, every one dollar move is worth $1000. This value is derived by the fact that every contract in CL controls 1000 barrels of West Texas Intermediate Crude Oil. The smallest incremental price move (called a tick) is .01, thus there are 100 ticks in a point. Since there 100 ticks in a point ($1000/100) every tick has a value of $10.  If a trader buys 1 contract of  CLH20 at a price of 52.30, with a stop market order of 52.10 her risk would 20 ticks (20 x $10 ) would equal $200 of risk per contract.


How to Calculate Reward on a Trade

The next facet of trading is the reward. Since trading is about risking money, the reward should compensate a trader at a favorable ratio, at least three times the risk. In this oil trade example, the market should allow for at least a $600 profit potential.  This can be projected by understanding where price is likely to turn against the trade after it starts to move in a favorable direction.  In the long oil trade example, a trader must objectively find where the sellers are found on a price chart to know where price might turn against the long trade. This would look like a fresh quality supply zone opposite the buy zone from which the buy was executed.

In the two charts below, we see a recent setup in CLH20 the fit these two parameters.

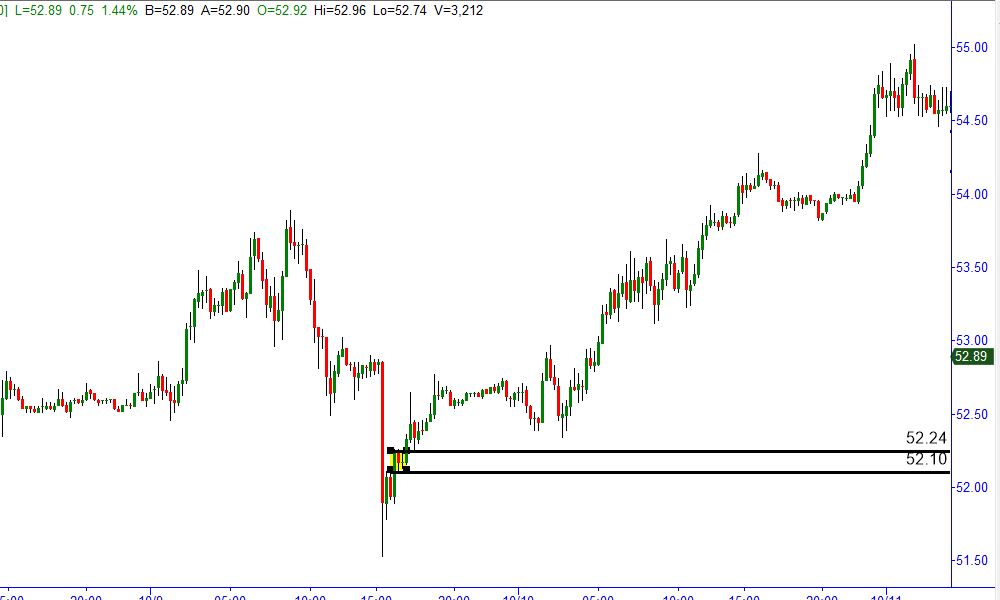
In this first chart we see a quality demand zone that would likely produce a turn in price because price hadn’t returned to the price level after producing a strong rally.

CHART

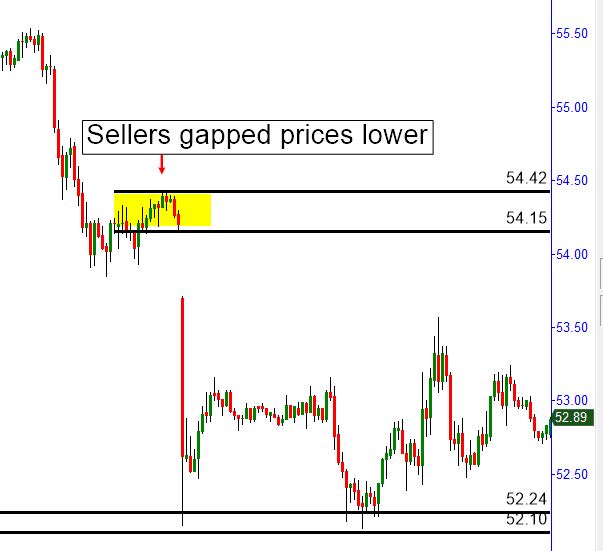
In the second chart below, we see that there is a gap in price which insinuates that there are plenty of sellers at that level, as the sell orders were so overwhelming that the price gapped lower.  This is where a trader can objectively seek to take profits. In fact, a better chance of hitting the target would be to place the target 20% before the selling zone.

Chart

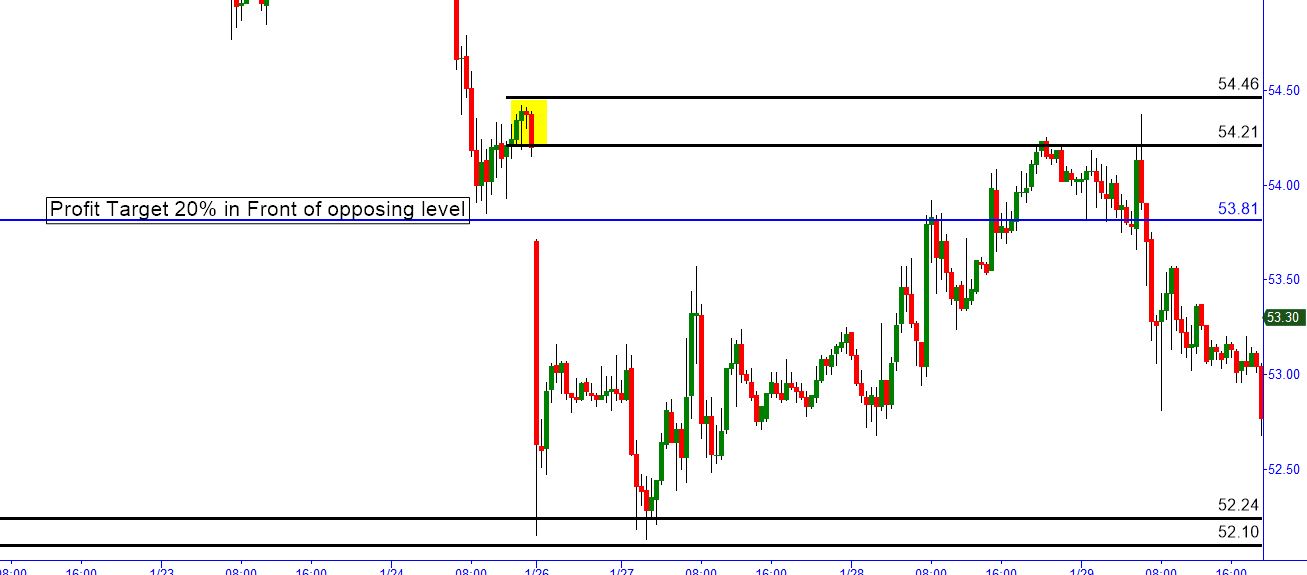
We can see the outcome in the chart below as price rallied into the supply zone and immediately turned lower. If the trader had not looked at this information objectively, she may have let her emotions take hold and may have not taken her profits.

CHART


Probabilities

Probabilities are, in my experience, the most challenging aspect for traders to quantify. One way to think about probability is to look at it as the location where the odds would favor buying, or selling.

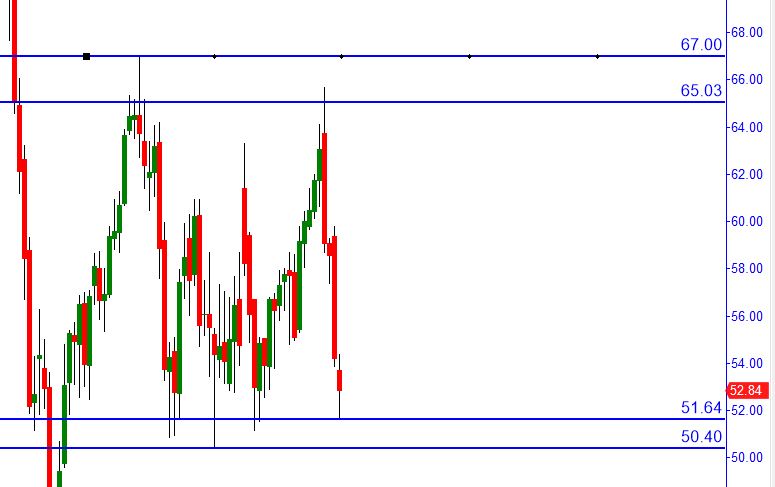
In the oil example, buying was a more favorable opportunity as the price of oil had fallen more than $12 and was approaching a longer term area where buyers had stepped in and purchased lots of contracts in the past year. This, coupled with the fact that Oil had been in a well-defined range and had fallen from the top extremity to the lower boundary of the range, made this a higher probability setup. This is seen in the chart below.

CHART

In conclusion, in order for a trader to experience consistent results, the first step is to formulate a process that can clearly assess risk, reward and probability. Those that fall short of doing that are not likely to see favorable results.

Until next time, I hope every has a great week.

This content is intended to provide educational information only. This information should not be construed as individual or customized legal, tax, financial or investment services. As each individual's situation is unique, a qualified professional should be consulted before making legal, tax, financial and investment decisions. The educational information provided in this article does not comprise any course or a part of any course that may be used as an educational credit for any certification purpose and will not prepare any User to be accredited for any licenses in any industry and will not prepare any User to get a job. Reproduced by permission from OTAcademy.com click here for Terms of Use: https://www.otacademy.com/about/terms

Editors’ Picks

EUR/USD faces a minor resistance near at 1.0750

EUR/USD faces a minor resistance near at 1.0750

EUR/USD quickly left behind Wednesday’s small downtick and resumed its uptrend north of 1.0700 the figure, always on the back of the persistent sell-off in the US Dollar ahead of key PCE data on Friday.

EUR/USD News

GBP/USD returns to 1.2500 area in volatile session

GBP/USD returns to 1.2500 area in volatile session

GBP/USD reversed its direction and recovered to 1.2500 after falling to the 1.2450 area earlier in the day. Although markets remain risk-averse, the US Dollar struggles to find demand following the disappointing GDP data.

GBP/USD News

USD/JPY climbs relentlessly ahead of BoJ meeting

USD/JPY climbs relentlessly ahead of BoJ meeting

The USD/JPY extends its uptrend despite verbal intervention from the Minister of Finance. The wide differential between US and Japanese interest rates is seen as a major factor contributing to the rise. The idea that a lot is already priced into the US Dollar could limit USD/JPY upside.

USD/JPY News

Editors’ Picks

AUD/USD remained bid above 0.6500

AUD/USD remained bid above 0.6500

AUD/USD extended further its bullish performance, advancing for the fourth session in a row on Thursday, although a sustainable breakout of the key 200-day SMA at 0.6526 still remain elusive.

AUD/USD News

EUR/USD faces a minor resistance near at 1.0750

EUR/USD faces a minor resistance near at 1.0750

EUR/USD quickly left behind Wednesday’s small downtick and resumed its uptrend north of 1.0700 the figure, always on the back of the persistent sell-off in the US Dollar ahead of key PCE data on Friday.

EUR/USD News

Gold holds around $2,330 after dismal US data

Gold holds around $2,330 after dismal US data

Gold fell below $2,320 in the early American session as US yields shot higher after the data showed a significant increase in the US GDP price deflator in Q1. With safe-haven flows dominating the markets, however, XAU/USD reversed its direction and rose above $2,340.

Gold News

Bitcoin price continues to get rejected from $65K resistance as SEC delays decision on spot BTC ETF options

Bitcoin price continues to get rejected from $65K resistance as SEC delays decision on spot BTC ETF options

Bitcoin (BTC) price has markets in disarray, provoking a broader market crash as it slumped to the $62,000 range on Thursday. Meanwhile, reverberations from spot BTC exchange-traded funds (ETFs) continue to influence the market.

Read more

US economy: slower growth with stronger inflation

US economy: slower growth with stronger inflation

The dollar strengthened, and stocks fell after statistical data from the US. The focus was on the preliminary estimate of GDP for the first quarter. Annualised quarterly growth came in at just 1.6%, down from the 2.5% and 3.4% previously forecast.

Read more

RECOMMENDED LESSONS

7 Ways to Avoid Forex Scams

The forex industry is recently seeing more and more scams. Here are 7 ways to avoid losing your money in such scams: Forex scams are becoming frequent. Michael Greenberg reports on luxurious expenses, including a submarine bought from the money taken from forex traders. Here’s another report of a forex fraud. So, how can we avoid falling in such forex scams?

What Are the 10 Fatal Mistakes Traders Make

Trading is exciting. Trading is hard. Trading is extremely hard. Some say that it takes more than 10,000 hours to master. Others believe that trading is the way to quick riches. They might be both wrong. What is important to know that no matter how experienced you are, mistakes will be part of the trading process.

Strategy

Money Management

Psychology