Ichimoku Kinko Hyo (often refered to as Ichimoku or simply Ichi), is a method of technical analysis developed by a Japanese journalist. Here’s everything you need to know about it…
Advantages of using Ichimoku
Ichimoku merges three indicators on one graph to provide a clear picture of the market. It simultaneously provides the trader with an eye on previous price trends, clear cross-over points to initiate a position, as well as an indication on the strength of the entry points.
It is a technique which really utilises the power of information, allowing the trader to make very well informed decisions.
Let’s jump in at the deep end…
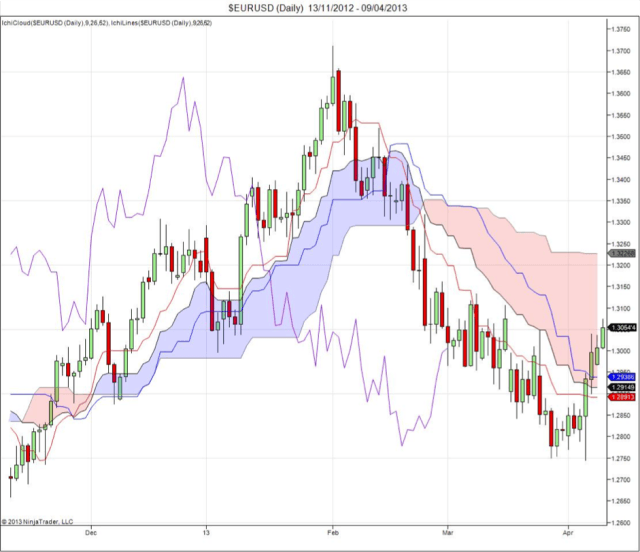
At first sight the combination of three indicators on one graph can be a little overwhelming, but it’s a good idea to simply have quick glance at a Ichimoku graph featuring all three indicators. This will give us something to dissect – one indicator at a time – as well as something to refer back to.
Understanding the three indicators
Kijun-Sen & Tenkan-Sen
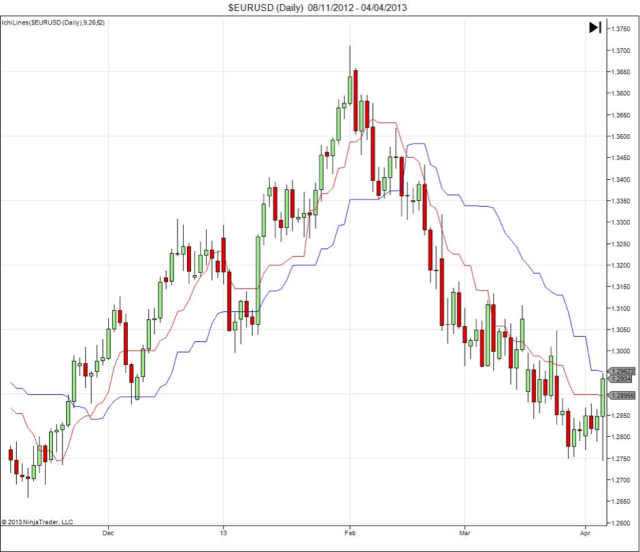
Below is the very familiar candlestick chart, with the addition of a red line (Tenkan-Sen) and a blue line (Kijun-Sen); these are our first indicators.
The first thing to understand is that a red over blue line indicates a bullish market, and a blue over red line indicates a bearish market.
However the most critical thing the Tenkan-Sen & Kijun-Sen lines reveal is a clear cross-over point; this is the point at which a trader should consider initiating a position.
Chikou Span
The Chikou Span is represented in the initial graph (and the graph below) by a purple line. When this sits above the price line, it is a bullish market. When it sits below the price line, it is a bearish market.
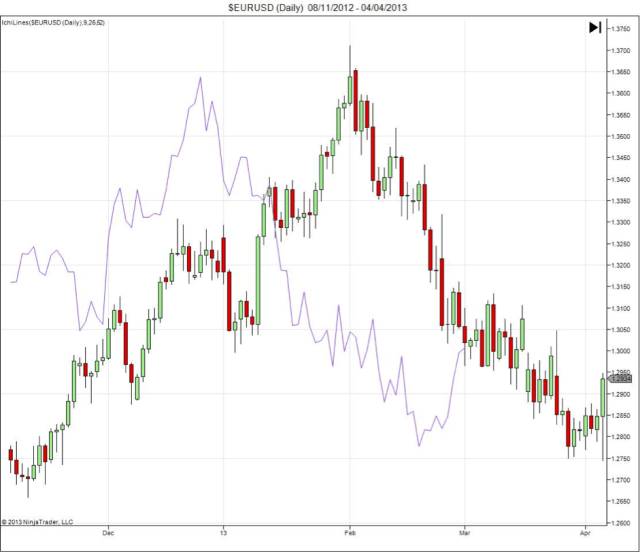
The Chikou Span is directly translated as the lagging line. This is because it is not an up-to-date indicator and always lags at least 24 candles behind the current price – see above.
It is intended to give the trader an eye on previous price trends and give a clue to any potential upcoming trends. For example, if the current close price is lower than 24 candles ago, it would indicate that there is a more bearish price action to come and vise versa.
Clouds
This is potentially the most important indicator of the of Ichimoku strategy.
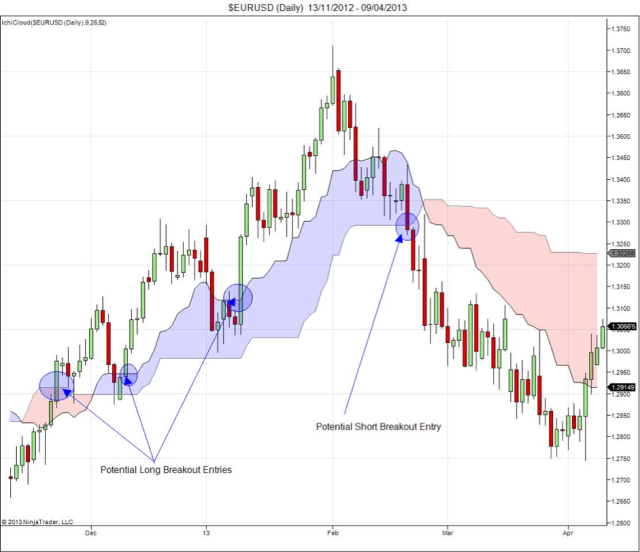
As with the previous indicators, the first thing to understand is that price above the cloud indicates a bullish market, and price below the cloud indicates bearish. Anything inside the cloud is considered neutral, as resistance is being tested.
The cloud is a measure of support and resistance and is used to identify potential breakout points. It becomes extremely powerful when it is used alongside the cross-over points provided by the red and blue lines of the Tenkan-Sen & Kijun-Sen.
Note that a cross-over point is the point at which a trader should consider initiating a position.
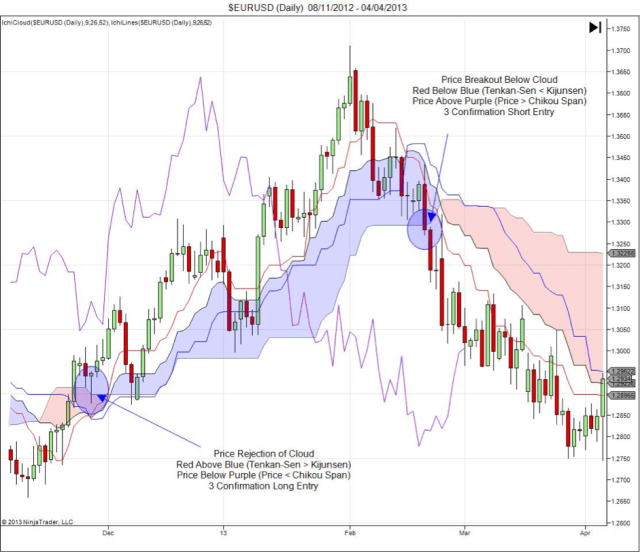
Below is a graph featuring all three indicators.
The first cross-over which takes place indicates an upward trend (red crosses over blue), which is supported by the graph. The cloud gives the trader further insight as the cross-over takes place at the bottom end of the cloud (bottom end of resistance), which indicates that the upward trend will have average strength.
A cross-over below the cloud indicates weak strength, and a cross-over above the cloud is the strongest indicator, as it is clear of resistance.
Hopefully this hasn’t been too confusing due to the various components of the strategy, but its almost fool-proof indicators will allow you to capture some very profitable trends.
All comments, charts and analysis on this website are purely provided to demonstrate our own personal thoughts and views of the market and should in no way be treated as recommendations or advice. Please do not trade based solely on any information provided within this site, always do your own analysis.
Editors’ Picks

EUR/USD: US Dollar to remain pressured until uncertainty fog dissipates Premium
The EUR/USD pair lost additional ground in the first week of February, settling at around 1.1820. The reversal lost momentum after the pair peaked at 1.2082 in January, its highest since mid-2021.

Gold: Volatility persists in commodity space Premium
After losing more than 8% to end the previous week, Gold (XAU/USD) remained under heavy selling pressure on Monday and dropped toward $4,400. Although XAU/USD staged a decisive rebound afterward, it failed to stabilize above $5,000.

GBP/USD: Pound Sterling tests key support ahead of a big week Premium
The Pound Sterling (GBP) changed course against the US Dollar (USD), with GBP/USD giving up nearly 200 pips in a dramatic correction.

Bitcoin: The worst may be behind us
Bitcoin (BTC) price recovers slightly, trading at $65,000 at the time of writing on Friday, after reaching a low of $60,000 during the early Asian trading session. The Crypto King remained under pressure so far this week, posting three consecutive weeks of losses exceeding 30%.

Three scenarios for Japanese Yen ahead of snap election Premium
The latest polls point to a dominant win for the ruling bloc at the upcoming Japanese snap election. The larger Sanae Takaichi’s mandate, the more investors fear faster implementation of tax cuts and spending plans.
RECOMMENDED LESSONS
Making money in forex is easy if you know how the bankers trade!
I’m often mystified in my educational forex articles why so many traders struggle to make consistent money out of forex trading. The answer has more to do with what they don’t know than what they do know. After working in investment banks for 20 years many of which were as a Chief trader its second knowledge how to extract cash out of the market.
5 Forex News Events You Need To Know
In the fast moving world of currency markets where huge moves can seemingly come from nowhere, it is extremely important for new traders to learn about the various economic indicators and forex news events and releases that shape the markets. Indeed, quickly getting a handle on which data to look out for, what it means, and how to trade it can see new traders quickly become far more profitable and sets up the road to long term success.
Top 10 Chart Patterns Every Trader Should Know
Chart patterns are one of the most effective trading tools for a trader. They are pure price-action, and form on the basis of underlying buying and selling pressure. Chart patterns have a proven track-record, and traders use them to identify continuation or reversal signals, to open positions and identify price targets.
7 Ways to Avoid Forex Scams
The forex industry is recently seeing more and more scams. Here are 7 ways to avoid losing your money in such scams: Forex scams are becoming frequent. Michael Greenberg reports on luxurious expenses, including a submarine bought from the money taken from forex traders. Here’s another report of a forex fraud. So, how can we avoid falling in such forex scams?
What Are the 10 Fatal Mistakes Traders Make
Trading is exciting. Trading is hard. Trading is extremely hard. Some say that it takes more than 10,000 hours to master. Others believe that trading is the way to quick riches. They might be both wrong. What is important to know that no matter how experienced you are, mistakes will be part of the trading process.
The challenge: Timing the market and trader psychology
Successful trading often comes down to timing – entering and exiting trades at the right moments. Yet timing the market is notoriously difficult, largely because human psychology can derail even the best plans. Two powerful emotions in particular – fear and greed – tend to drive trading decisions off course.
