Moving averages represent the most popular trend indicators. If the RSI (Relative Strength Index) is the most popular oscillator, when it comes to trend trading, moving averages are the first choice for a trader.
While I do favor pure price action when trading the currency market, the idea behind this article is to show how a simple approach to trading could work, too.
Like any trend indicator, the moving average is plotted directly on the actual chart, not on a separate window. It effectively averages the values in the previous candles, to plot the current one.
Based on the calculation formula, there are different types of moving averages (MA): simple moving average (SMA), exponential moving average (EMA), displaced moving average (DMA), etc.

Traders favor either the SMA or the EMA. The SMA simply averages the closing prices for the period it considers.
For example, the SMA (100) considers the last one hundred candles and averages their closing prices to plot the current value. And so on and so forth.
For some, the EMA is more accurate. It reduces the lag by applying more weight to recent prices.
IMPORTANT: In the end, it depends very much on the trading strategy used. Some strategies work better with SMA’s rather than EMA’s. Or, the other way around.
To put this into perspective, think of the Bollinger Bands indicator. It is considered that the indicator is far more accurate if the MBB (Middle Bollinger Band) is an EMA.
Support and Resistance with Moving Averages
A moving average offers great support and resistance. The bigger the period the moving average considers, the stronger the support and resistance area.
Moreover, the bigger the time frame, the stronger the support and resistance. In other words, when the price hits a 200 EMA on the monthly chart, there’s a strong likelihood it will hesitate at the level.
True Fact: Further, price acts around moving averages just like it does around a classical trend line. Once broken, the support becomes resistance. Once resistance gets broken, it turns into support.
However, when compared with classical support or resistance, the one provided by moving averages is as powerful. It is called dynamic support and resistance. I am still in favour of the classical support and resistance.
In fact, it means it moves together with price. Due to the way they’re calculated, traders use moving averages to trail stops when riding a trend.
Others use them to add to a strong trend. As a rule of thumb, the more price comes to a moving average, the weaker the trend becomes.
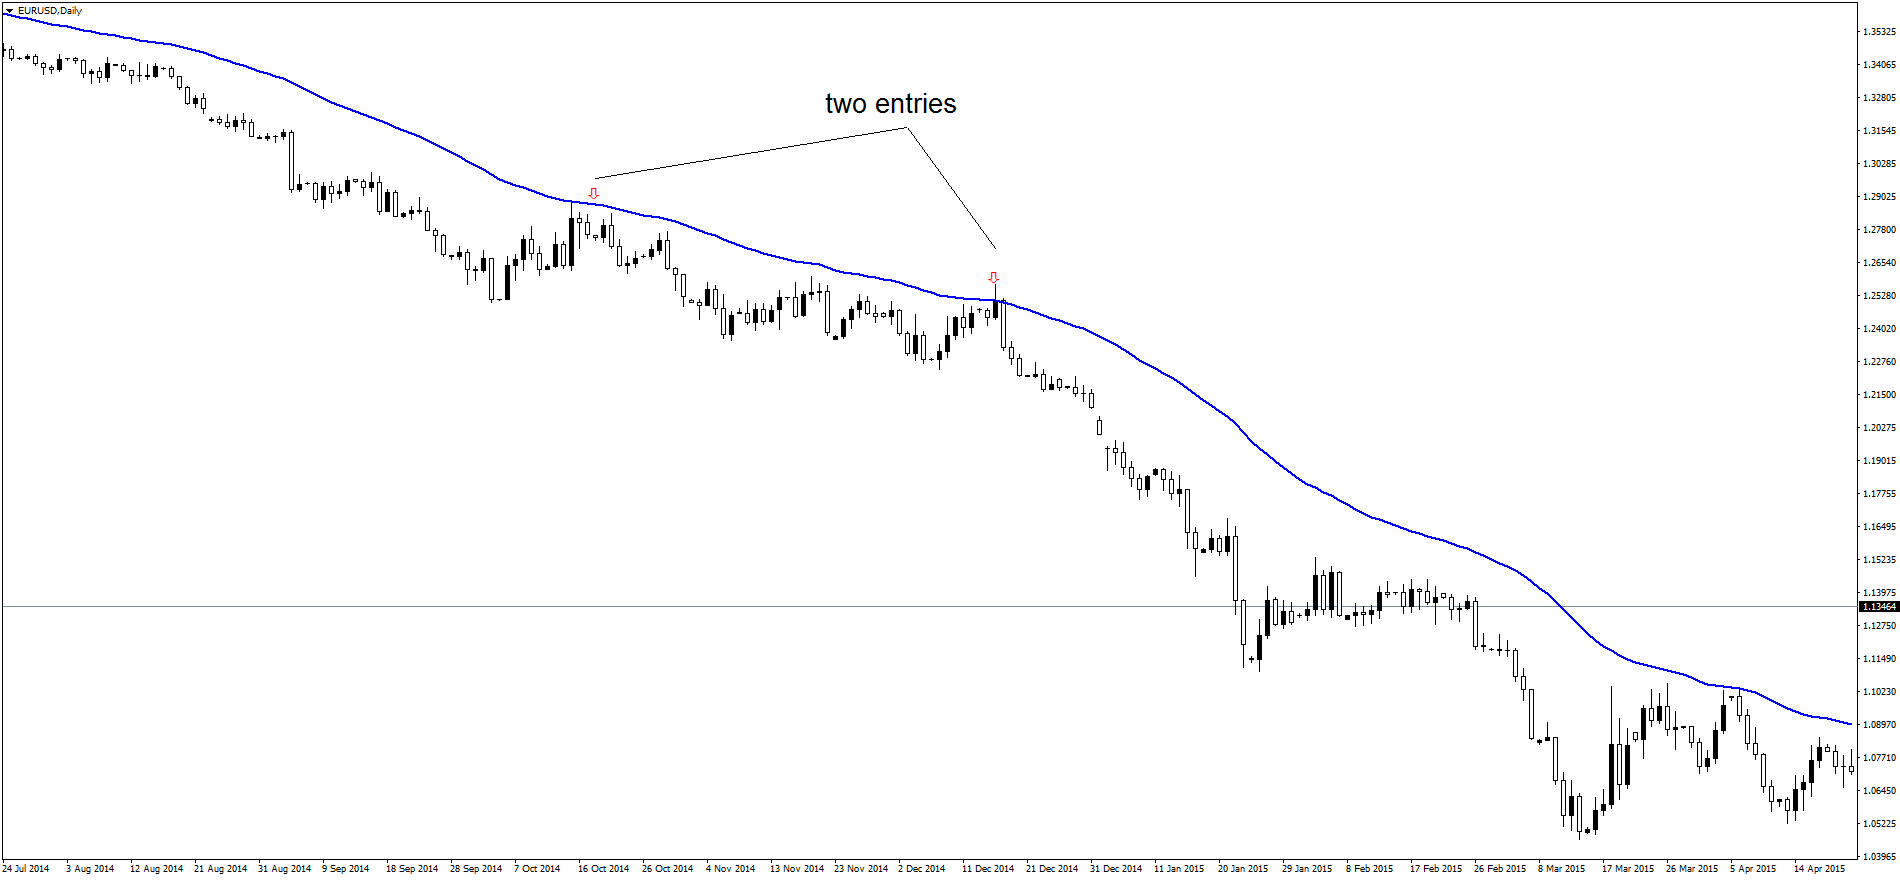
Therefore, it is not recommended to use a moving average to add more than two times to a trend. If the price finds the strength to reach it again, the trend is not that strong. Check out the Daily EURUSD chart below. There are two times where price is close to moving average. It is a perfect dynamic resistance zone that pushes price lower.
Defining Bull and Bear Markets with Moving Averages
Traders define a bull or bear market when different moving averages cross on the same time frame. The most known crosses are the golden and death ones.
A) Golden Cross
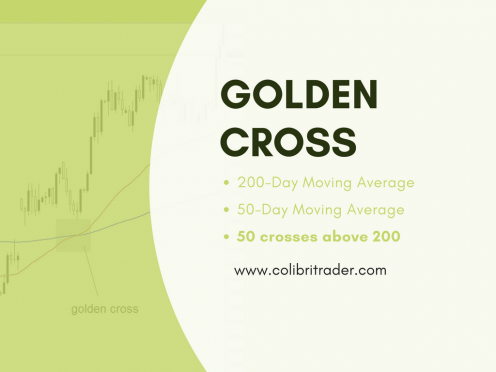
A golden cross forms when the 50-day moving average moves above the 200-day one. It shows bullish conditions.
When this happens on the major stock indices, it is said that the market enters “bullish territory”. From this moment on, traders will look to buy the dips.
The same is valid when trading a currency pair. A golden cross shows the start of a new bullish trend and the challenge will be to pick the best entry places. That usually happens when a retracement occurs. Check out this article if you are not sure how to enter when you have already missed the initial signal.
B) Death Cross
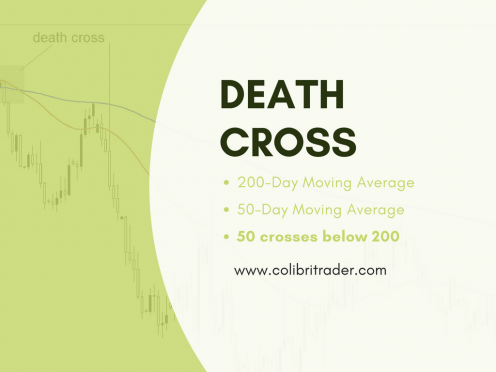
On the other hand, when the 50-day moving average crosses below the 200-day one, a death cross forms. The death cross is the opposite of a golden one. Hence, it shows a bearish market.
This simple strategy is enough to define the state of a market. Sometimes, when the market consolidates on such a time frame, these crosses form multiple times.
Yet, the price will hesitate when it meets the averages. There is an example taken from the Daily EURSD chart. The first cross is a death cross as can be seen from the chart.
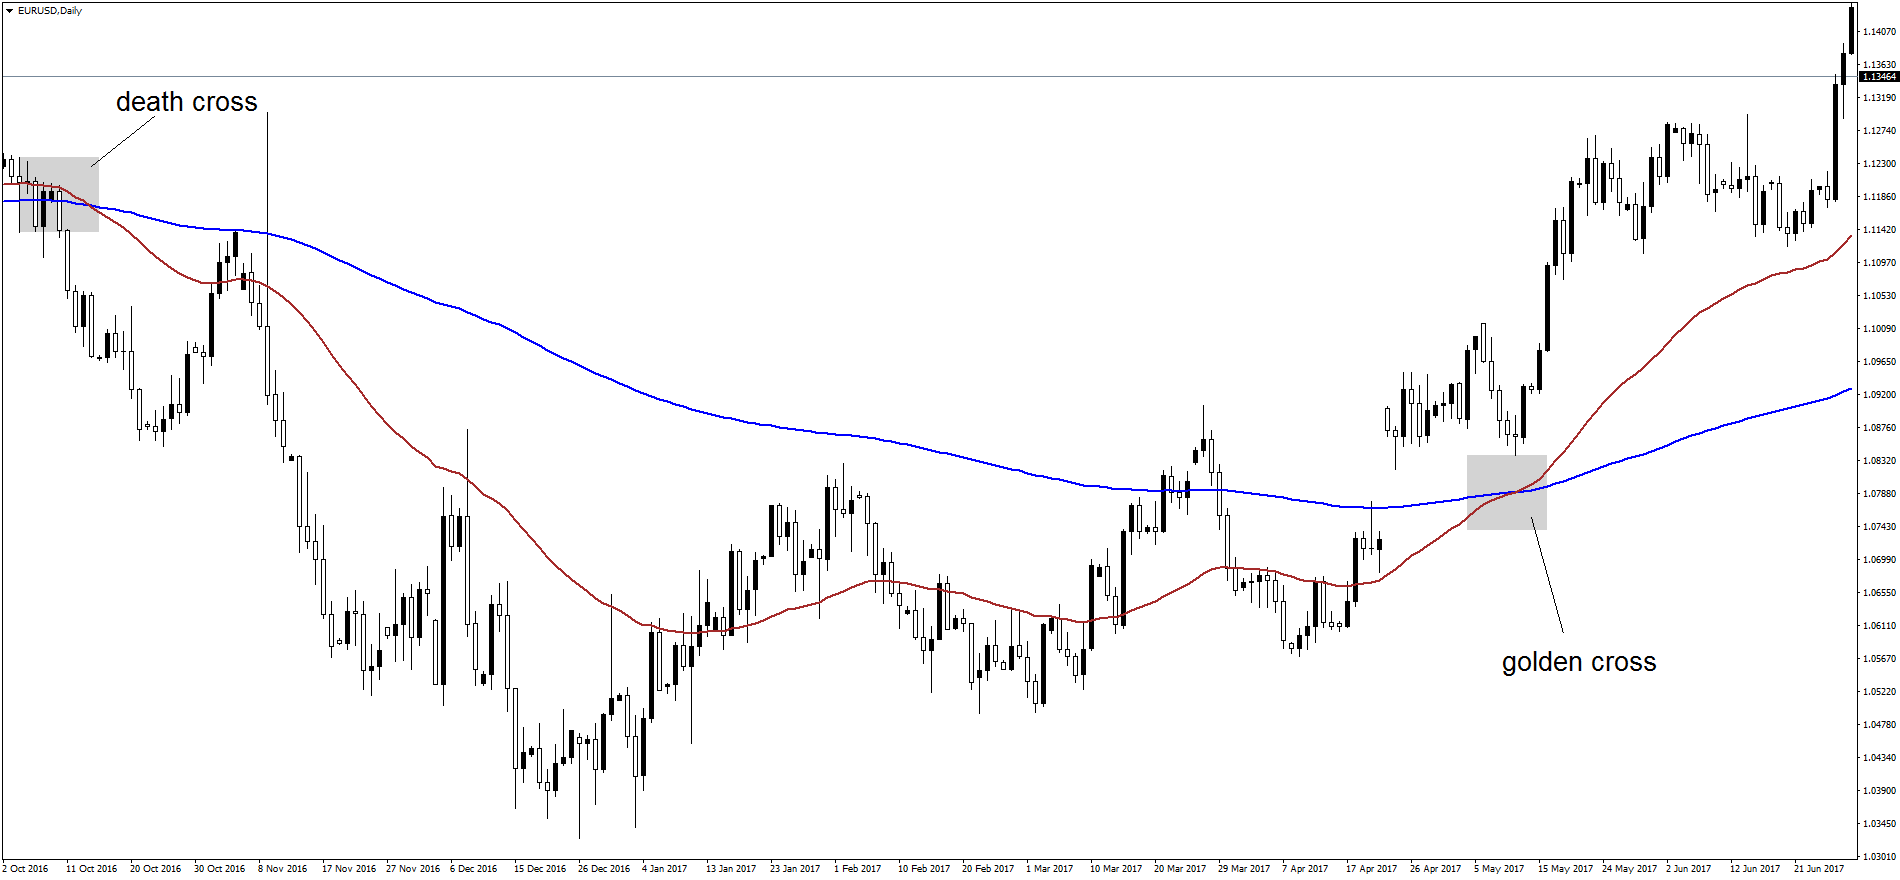
The 50-day moving average is going below the 200-day moving average in a classic bearish scenario. In the beginning of November, price retraces back to the 200-day moving average, giving a chance to those that have missed the first entry to re-enter. It has surely taken out a lot of traders that had their stops around the 1.1300 area.
The second cross on this EURUSD chart is a bullish one. The 50-day moving average crosses above the 200-day moving average forming a classic golden cross. This is showing a change the trend. From that point on, price has been on a steady rise.
IMPORTANT: Usually traders using moving averages are using wider stops, as well. As can be seen from the “Death Cross” if your stop loss was too tight, you would have been taken out of a profitable trade very quickly.
Traders using moving averages as their primary strategy know that and are trying to position themselves favourably, using wider stops. I am not going to dive into the intricacies of moving average trading strategies, because they are too many.
There are whole books written on this topic and as you know, I do use primarily price action in trading.
Look for Confluence Areas
Some trend-following traders do not settle only with golden or death crosses. They create a system that works/should work on every time frame.
As such, they end up applying on a chart multiple moving averages. They start with a small one (20-day), add the 50-day, then the 100-day and finally the 200-day one.
The idea is to measure a trend’s strength. When the averages are perfectly aligned or travel in a “perfect order”, the trend is at its maximum strength.
When the smaller moving averages cross the higher ones, the trend falters. To spot if this is a fake move or not, traders look for confluence areas.
If price hits the moving averages in a confluence area, the support or resistance level is stronger than usual. As such, that’s the perfect place to add to a trade.
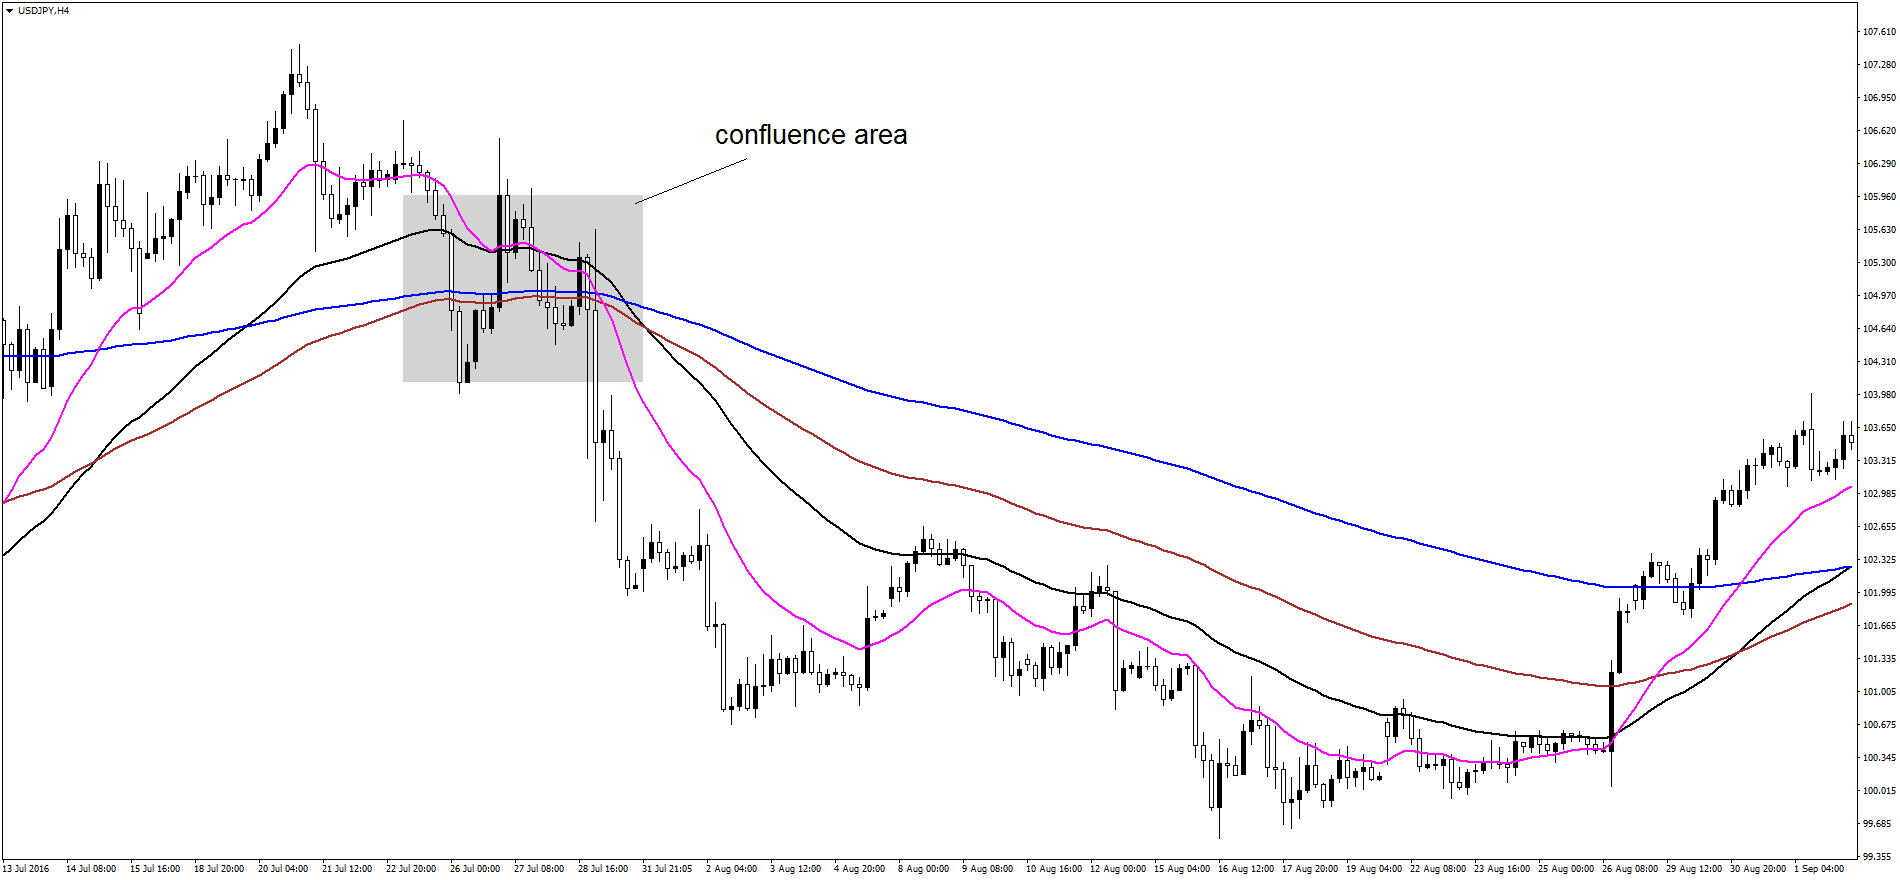
Confluence areas are rare, but when they occur, they are very powerful. Some traders are only taking trades when price approaches such area. As I like to say, there is no holy grail in trading. Those pleases sometimes break and price pierces through them establishing a new trend.
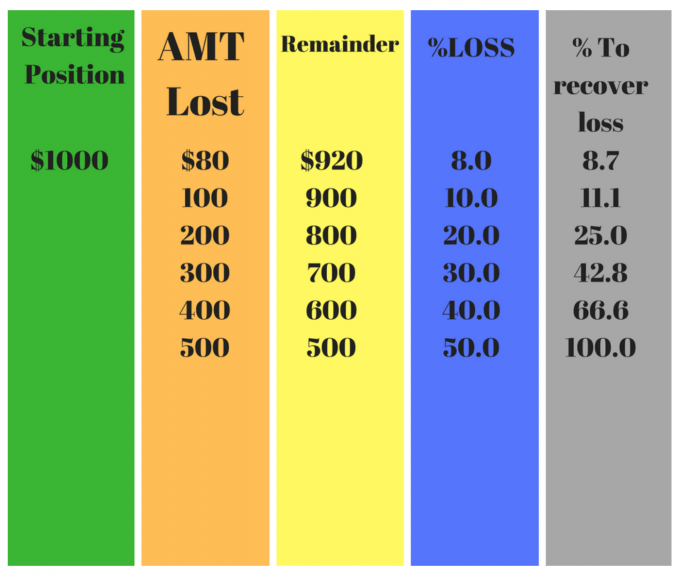
It is of utter importance that traders have the right money management skills. If in doubt, check out this essential chart showing what will happen to your capital once you start losing. Pay attention to the part that shows you how much “% to recover loss”.
Conclusion
Moving averages are great trend indicators. Traders like to say that “the trend is your friend”. As such, everyone wants to ride the perfect trend. But is it really possible?
A moving averages system can show the perfect trend. You should keep in mind the following:
-
Whenever adding a position to a trend, do that only the first two times the price hits the moving average. If the price keeps hitting the average, the trend weakens. It will ultimately reverse.
-
When multiple moving averages align perfectly, that’s the trend to ride.
-
Golden and death crosses keep you on the right side of the market. Use the lower time frames to find the perfect entry.
-
As with any other trading system, moving averages do have their perks, so have in place a great money management system. Do not overtrade!
Moving averages are also part of various other trading strategies. For example, they act as confirmation.
Some traders use divergences between the price and an oscillator. When they spot one, it would be better if some other indicator confirms the support/resistance level. This is where the different types of moving averages come to help.
To sum up, a moving average offers the purest perspective of a market. Its most simplistic interpretation is that when the price is above, the market is bullish; when the price is below, the trend is bearish.
To the surprise of many, such a simple approach works more than people think. Especially if the moving average uses a higher period, like the 100-day or 200-day ones. But again, as the latin maxim says: De Omnibus Dubitandum. In other words: Doubt Everything
This material is written for educational purposes only. By no means do any of its contents recommend, advocate or urge the buying, selling or holding of any financial instrument whatsoever. Trading and Investing involves high levels of risk. The author expresses personal opinions and will not assume any responsibility whatsoever for the actions of the reader. The author may or may not have positions in Financial Instruments discussed in this newsletter. Future results can be dramatically different from the opinions expressed herein. Past performance does not guarantee future results.
Editors’ Picks

EUR/USD remains weak near 1.1800
EUR/USD remains on the back foot on Thursday, trading close to the 1.1800 support ahead of the opening bell in Asia. The pair’s pullback comes amid further gains in the Greenback, while investors keep assessing the ECB’s decision to leave its policy rates unchanged

GBP/USD falls to new lows near 1.3530
GBP/USD extends Wednesday’s pullback on Thursday, easing lower towards two week lows around the 1.3530 area. Ongoing strength in the Greenback and the dovish hold from the BoE at its earlier meeting are keeping demand for the British Pound on the defensive for now.

Japanese Yen hangs near two-week low vs. firmer USD; USD/JPY bulls target 157.00 breakout
The Japanese Yen extends its sideways consolidative price move against a broadly firmer US Dollar and currently trades near a two-week low, touched earlier this Thursday. Investors remain worried about Japan's financial health on the back of Prime Minister Sanae Takaichi's expansionary fiscal plans. This, along with political uncertainty ahead of the snap election on February 8, has been another bearish development for the JPY and contributes to its relative underperformance.
Editors’ Picks

AUD/USD remains offered below 0.7000
Broad based selling across risk sensitive assets is weighing on the Australian Dollar on Thursday, with AUD/USD adding to Wednesday’s pullback and slipping back the key 0.7000 handle as the US Dollar extends its advance. Looking ahead, the next domestic focus in Australia will be the Household Spending figures on February 9.
EUR/USD remains weak near 1.1800
EUR/USD remains on the back foot on Thursday, trading close to the 1.1800 support ahead of the opening bell in Asia. The pair’s pullback comes amid further gains in the Greenback, while investors keep assessing the ECB’s decision to leave its policy rates unchanged

Gold fails to sustain gains above $5,000 for third consecutive day
Gold is back under pressure on Thursday, slipping back towards the $4,800 region per troy ounce. A firmer US Dollar is weighing on the yellow metal, even as the broader mood remains risk off. That said, falling US Treasury yields across the curve are helping to cushion the downside and, for now at least, are limiting the depth of the pullback.

Strategy's Bitcoin treasury in focus as MSTR crashes alongside crypto market
Strategy (MSTR), the largest corporate holder of Bitcoin (BTC), is in focus ahead of its earnings call on Thursday amid an intensifying crypto market sell-off. Also caught in the headwinds is the MSTR stock, trading at $114 at the time of writing, down over 12% intraday.

The AI mirror just turned on tech and nobody likes the reflection
Tech just got hit with a different kind of selloff. Not the usual rates tantrum, not a recession whisper, not even an earnings miss in the classic sense. This was the market staring into an AI mirror and recoiling at its reflection.
RECOMMENDED LESSONS
Making money in forex is easy if you know how the bankers trade!
I’m often mystified in my educational forex articles why so many traders struggle to make consistent money out of forex trading. The answer has more to do with what they don’t know than what they do know. After working in investment banks for 20 years many of which were as a Chief trader its second knowledge how to extract cash out of the market.
5 Forex News Events You Need To Know
In the fast moving world of currency markets where huge moves can seemingly come from nowhere, it is extremely important for new traders to learn about the various economic indicators and forex news events and releases that shape the markets. Indeed, quickly getting a handle on which data to look out for, what it means, and how to trade it can see new traders quickly become far more profitable and sets up the road to long term success.
Top 10 Chart Patterns Every Trader Should Know
Chart patterns are one of the most effective trading tools for a trader. They are pure price-action, and form on the basis of underlying buying and selling pressure. Chart patterns have a proven track-record, and traders use them to identify continuation or reversal signals, to open positions and identify price targets.
7 Ways to Avoid Forex Scams
The forex industry is recently seeing more and more scams. Here are 7 ways to avoid losing your money in such scams: Forex scams are becoming frequent. Michael Greenberg reports on luxurious expenses, including a submarine bought from the money taken from forex traders. Here’s another report of a forex fraud. So, how can we avoid falling in such forex scams?
What Are the 10 Fatal Mistakes Traders Make
Trading is exciting. Trading is hard. Trading is extremely hard. Some say that it takes more than 10,000 hours to master. Others believe that trading is the way to quick riches. They might be both wrong. What is important to know that no matter how experienced you are, mistakes will be part of the trading process.
The challenge: Timing the market and trader psychology
Successful trading often comes down to timing – entering and exiting trades at the right moments. Yet timing the market is notoriously difficult, largely because human psychology can derail even the best plans. Two powerful emotions in particular – fear and greed – tend to drive trading decisions off course.