Trading with Divergences- Everything You Need To Know About Divergences

Divergences- Introduction
Learning how to trade with divergences can sometimes be a little daunting. Not only do you have to know what the main kinds of divergences are, but they do not always guarantee the projected outcome a divergence will signal.
Executing a trade with divergences and only divergences is never a wise trading decision. Divergences, while powerful, should only be used as a confirmation tool. But what are divergences?
What is divergence and how do you trade with divergences?
Divergences are simply when you see price moving in one direction and, typically an oscillating indicator, move in different directions.
Basically, if you see the price going up and making new higher highs, but the oscillator is making new lower lows, you have a divergence. Let’s look at some examples of four common kinds of divergences.
Types of Divergences- Bullish Divergence
The first we will observe is a bullish divergence or a regular bullish divergence. I will be using the RSI as the oscillator for this example.
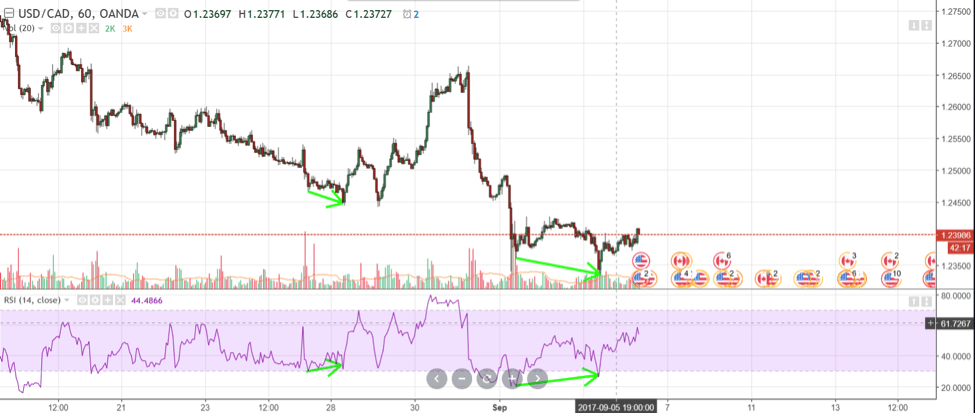
You will notice that when you trade with divergences, there are similar and repeating patterns associated with these divergences. In a regular bullish divergence, you are going to typically spot this near the end of a down trend.
Divergence theory indicates that there is a strong probability of price reversing. Notice how prices have made lower lows but the RSI has made higher lows. Price did the reverse, tested a swing high and then the previous swing low and then continue to drive higher before entering a new down trend and creating another, more obvious regular bullish divergence.
Bearish Divergences
Now let’s observe a regular bearish divergence.
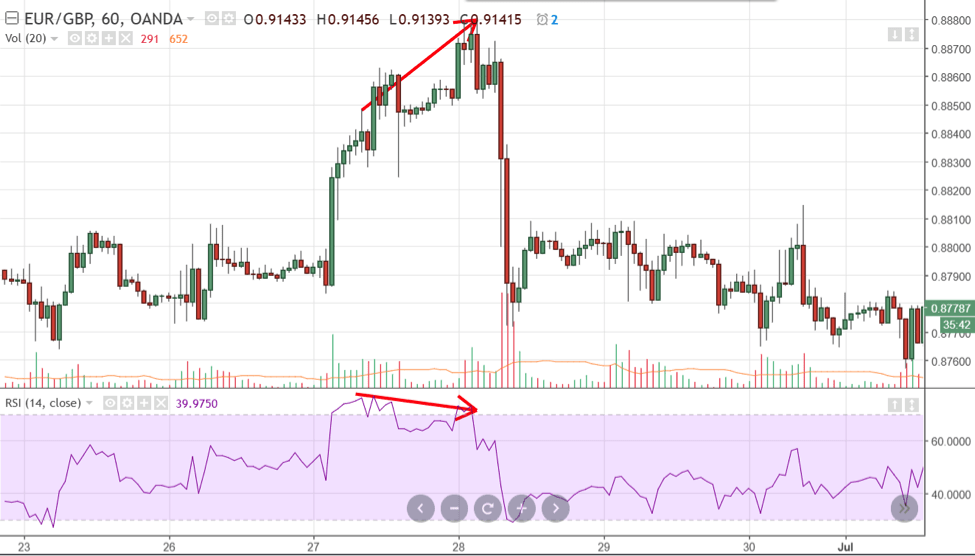
Essentially, a trade with divergences that a bearish are going to signal downwards movement. Just as in a regular bullish divergence pattern we see it from near the end of a down trend, in a regular bearish divergence pattern we see this form at the end of an uptrend.
The divergence we see is that price has made a higher high (on this chart it made quite a leap) but on the RSI oscillator, we have lower highs. Divergence theory with this regular divergence pattern indicates a high probability of price reversing to the downside.
And as can be observed, a trade with divergence on the bearish bias did have prices fall and start a downward trend.
Hidden Divergences
The next two examples of divergences are called hidden divergences. I know that can sound confusing, it was confusing to me when I first started trading!
But hidden divergences only mean that there is a divergence with in a trend. While a trade with divergences that are regular indicates a reversal of trending price action, hidden divergence is an indication that the trend will continue.
I like to think it as identifying a fake out or the end of a pullback.
Hidden Bullish Divergence
The first hidden divergence we will look at is hidden bullish divergence.
Hidden Bearish Divergence
The next and last type of trade with divergence is the hidden bearish divergence.

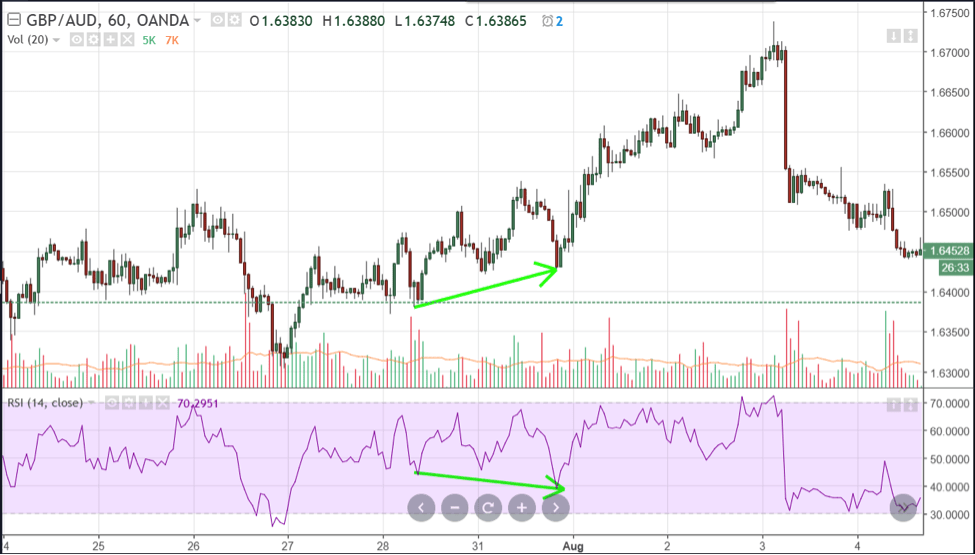
In this example of a trade with divergence, we see that while prices have continued to go lower and formed lower highs, the RSI oscillator has made higher highs. This is what is called a hidden bearish divergence.
Divergence theory tells us that there is a strong probability that the down trend continues. Again, a hidden bearish divergence pattern means that the trend is continuing to the downside.
I drew this head and shoulders pattern just to show how price reacted to the formation of this common pattern and how the lower high failed to push beyond the right shoulder. That was another confirmation tool of trend continuation.
Types of Divergences- Summary
So again, in summary, these are the four divergence patterns we discussed.
Regular Bullish Divergence
- End of a down trend.
- Second bottom.
- Price makes new Lower Low, but oscillator makes Higher Low.
- Trend changes to the upside.
Regular Bearish Divergence
- End of an uptrend.
- Second top.
- Price makes Higher High, but oscillator makes Lower High.
- Trend changes to the downside.
Hidden Bullish Divergence
- During an uptrend
- Once price makes a Higher Low, but oscillator makes a Lower Low.
- The trend should continue to the upside.
Hidden Bearish Divergence
- During a downtrend.
- Once price makes a Lower High, but oscillator makes Higher High.
- The trend should continue to the downside.
Trading With Divergences
Now that we’ve identified four common types of divergences, how does on trade with divergences?
The oscillator I used in the above four examples was the RSI. It is probably the most common type of oscillator for detecting divergences. But there are a substantial number of oscillators, each has their own merit: Stochastics, RSI, Chaikin Money Flow, Awesome Oscillator, Ultimate Oscillator, etc.
There are just so many oscillators that you could use. The most popular oscillators for divergences are the RSI and Stochastics. But the latest one I have found and I believe the easiest to observe and easiest to trade with divergences is the Stochastic RSI.
Less Known and Still Great Indicators- Stochastic RSI
The Stochastic RSI is basically an indicator of an indicator. Where Stochastics measure the momentum of price and RSI measures the strength of the price movement, Stochastic RSI measures the momentum of the RSI.
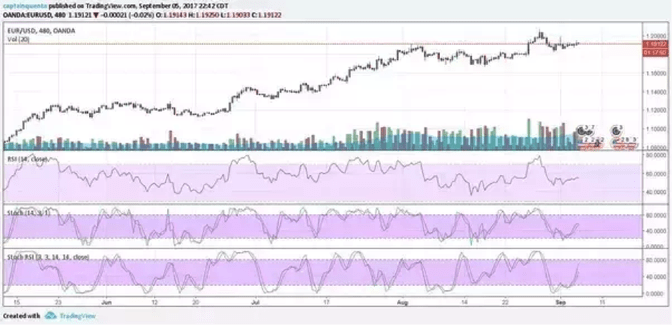
Maybe a chart here can show you difference and similarities between RSI, Stochastics and Stochastic RSI.
Trading with Divergences
Really, they do not look a lot different. However, in my opinion, the Stochastic RSI is one of the less known and still powerful ways you can use to trade with divergences.
If you use the standard RSI and Stochastics for finding divergences, you not only missing out on better divergence detection, but you can get caught in some false divergence signals.
The Stochastic RSI does a fantastic job of eliminating the false signals and strong confirmation for actual divergences. As always, there is no holy grail in trading and this is just another way to look at divergences. In my trading, I do sometimes use the RSI indicator by itself.
For the sake of this article, I am using the combination of both the RSI and Stochastic.
Examples- Trading with Divergences
Look at this chart.
- This is considered normal Bearish divergence. You would not have seen that as clearly with either the RSI or Stochastics, but it’s obvious with Stochastic RSI.
- Hidden Bullish Divergence. Again, it looks like the standard RSI and Stochastic are just following the trend, is it a coincidence that the Stochastic RSI shows that hidden divergence right before another move up? No.
When you are trading with divergences, it is important that it won’t be the only tool in your trading box. Like any tool in a tool box, they are generally simple tools. And so, should your trading strategies.
I am a keen fan on Price Action, but there are so many tools and strategies out there. That is why I believe it is fair to write about them and share the knowledge that is out there. As a price action trader, I cannot exclude all other types of trading out there. And believe me, there are a lot…
More on Stochastic RSI and Trading With Divergences
Utilizing strategies like divergences can seem daunting and confusing at times and it is ok to have to refer to them sometimes when you forget. I often forget myself!
Sometimes I must make myself a little cheat sheet and say to myself, “Oh, ok, the price has been making higher highs but the Stochastic RSI is making lower highs, what is that again?
Oh, that’s regular bearish divergence.”
You also want to make sure that when you trade with divergences, that is only a companion to your trading strategy. Don’t make divergence trading your main approach.
Reading this article and looking at these numerous examples can sometimes be deceiving (not intentional) to new traders because the examples I have posted and listed show… just the examples.
You will find in your trading career that when you use divergence as a tool, sometimes it doesn’t work. Again- do not look for the holy grail in trading- build a methodology that works!
When Divergences Carry On For Too Long and Some Common Mistakes When Trading With Divergences
Sometimes a divergence can continue for a long time. You will often be stopped out before the regular bullish divergence changes the trend from bearish to bullish.
An all too common mistake that many new traders make when they learn to how to trade with divergences is the minute they notice a divergence, they take the trade according to the divergence that has appeared.
As new traders (and experienced traders) we need to confirm that the divergence is real and wait for future price action. Like any kind of pattern or indicator, trading with divergences is something that only appears after the confirmation of the pattern.
Wait For the Pull Back
Don’t be too anxious to enter right on a divergence you spotted wait for that pull back. How many examples of these divergences can you find on any chart?
Quite a few.
How many times does price move back to an entry where you can get into the trade again? Quite a few times.
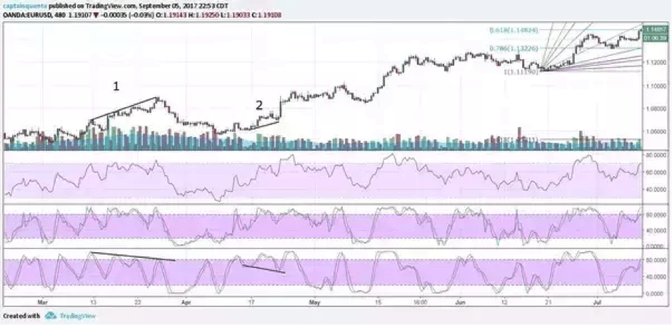
Let’s observe this kind of behavior and analyze this chart.
Now without looking at the explanations of the various divergences above, do you remember the divergence pattern this is exhibiting?
This would be regular bearish divergence.
Trends and Trading With Divergences
Even if you don’t, just think about what is happening here by analysing the price movement relative to the Stochastic RSI. Prices are moving up and continuing to make some highs, it almost appears as if the price movement doesn’t have a lot of conviction behind it.
If prices are moving up and that is supposed to be bullish, shouldn’t the momentum confirm that there is a strength to the upside? The momentum clearly does not match the movement of price.
There are just not enough bulls to push this higher and then we see the reversal of this short trend.
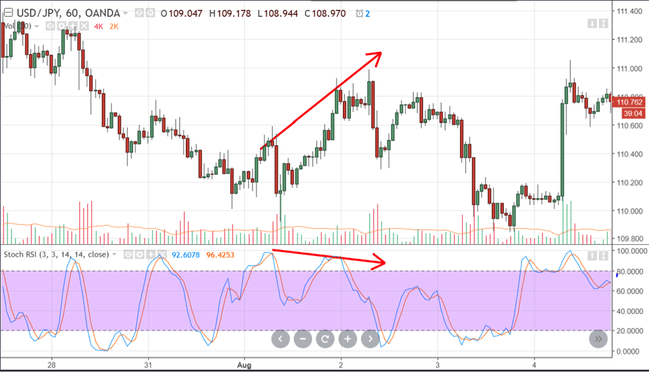
But did you notice anything else about this chart? Did you spot it? We had a short bull trend within a longer bear trend.
On the same chart, we have two conflicting divergences. It’s almost a divergence within a divergence! Again, without looking, what does this look like to you? If you said hidden bearish divergence, you are correct.
If you come across scenarios like this, where you have a trade with divergences showing opposing patterns, you need to take this into consideration:
How strong is the long-term trend? Just look at the volume indicator, does that volume show you that there are a lot of traders who want to trade on prices moving up?
How long has the down trend been active on the pair? This might even be a situation where you don’t place a trade with divergences. This might be a good opportunity to just watch, analyse and track.
The UJ pair has been in a strong downtrend on this chart. Therefore, if the regular reversal indicates a continued trend of the longer-term trend, THAT is the signal you want to take. The hidden divergence to be bullish would have tricked you.
The trend for the hidden bullish divergence is just too minor compared to the longer-term downtrend. So, do be careful to look for these things. It’s very easy to have a bias and only look for reversals and avoid the hidden divergences.
Conclusion
Again, be careful when you trade with divergences. They are an extremely strong predictor of trend change or continuation. Make sure that you are using other methods to confirm your trades.
And don’t jump right in just because a divergence has appeared and you are excited and think you might be able to enter before everyone else. That is probably the bane of many traders: thinking you know or see something that everyone else participating in the market doesn’t.
It will pay dividends for you to observe what happens with the movement of price when you spot the divergence. Big and powerful entities, businesses and traders see the same thing you do and may take a divergence, especially one that is obvious, and try and trap you.
There is a crazy amount of divergences on all time frames on all pairs, find one, wait for the price to test that divergence, look for the pullback/re-entry price you want, confirm it with your other tools in your tool box and then make your decision.
Author

Colibri Trader
Colibri Trader
Colibri Trader, as he is known in the circles, is based in London, UK. He Started his career in one of the leading prop trading houses at the time and then has moved out to form his own company- Colibri Trader Limited.


