Trading stocks with Camarilla pivots

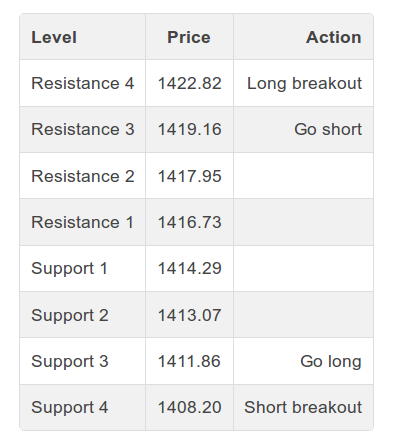
As compared to classic pivots where traders look for Resistance 1 and Support 1 levels, the most important levels for the Camarilla pivot point variation are the third and fourth levels. Examples of each level, along with what might be considered an appropriate trade action, are shown here:
Camarilla pivot point calculations are rather straightforward. We need to input the previous day’s open, high, low and close. The formulas for each resistance and support level are:
- R4 = Close + (High – Low) * 1.1/2
- R3 = Close + (High – Low) * 1.1/4
- R2 = Close + (High – Low) * 1.1/6
- R1 = Close + (High – Low) * 1.1/12
- S1 = Close – (High – Low) * 1.1/12
- S2 = Close – (High – Low) * 1.1/6
- S3 = Close – (High – Low) * 1.1/4
- S4 = Close – (High – Low) * 1.1/2
The calculation for further resistance and support levels varies from this norm. These levels can come into play during strong trend moves, so it’s important to understand how to identify them. For example, R5, R6, S5 and S6 are calculated as follows:
- R5 = R4 + 1.168 * (R4 – R3)
- R6 = (High/Low) * Close
- S5 = S4 – 1.168 * (S3 – S4)
- S6 = Close – (R6 – Close)
Trading strategies
Camarilla pivot points are interesting in that they offer guidance for both sideways and trending markets. Depending on the price levels in play, the indicator can suggest a trade that would exploit a reversion to the mean or a breakout to new highs or lows. Let’s walk through various hypothetical trading scenarios to demonstrate the utility of this approach.
Scenario 1: Price opens at or between Support 3 and Resistance 3
When price opens between S3 and R3, we will use the following rules to guide our trade execution:
- Long trades: Let the price move to S3. At S3, go long with a stop loss placed five ticks below S4. Profit targets for this trade are R1, R2 and R3.
- Short trades: Let the price move to R3. At R3, go short with a stop loss placed five ticks above R4. Profit targets for this trade are S1, S2 and S3.
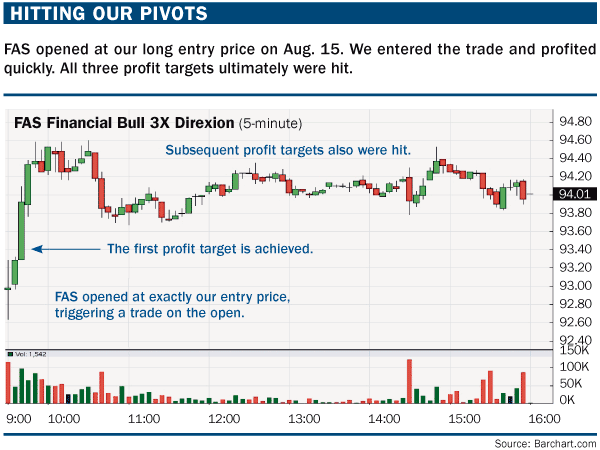
The Financial Bull 3X Direxion (FAS) exchange-traded fund (ETF) tracks the value of financial sector stocks and provides roughly three times the leverage of cash positions in these stocks.
On Aug. 14, FAS had the following: Open, 94.50; high, 95.14; low, 92.55; close, 93.35. Based on these values, our Camarilla pivot point resistance and support levels are:
- R1 = 93.59; R2 = 93.82; R3 = 94.06; R4 = 94.77
- S1 = 93.11; S2 = 92.88; S3 = 92.64; S4 = 91.93
Thus, the trading strategy for Aug. 15 is:
- Buy at 92.64. Stop loss: 91.88; Profit targets: 93.59, 93.82, 94.06
- Sell at 94.06. Stop loss: 94.82; Profit targets: 93.11, 92.88, 92.64
The trade worked out. On Aug. 15 FAS opened at the lower end of the range and our long trade at S3 (92.64) was triggered immediately. Price quickly reached our price targets, and we scaled out of the trade (see “Hitting our pivots,” below). Another helpful risk-control guideline is to manage the stop loss actively. In this case, we moved the stop loss to the entry price when the first profit target was hit.
Now consider another example of the same technique using the S&P 500. On Feb. 14, the S&P 500 had the following: Open, 1351.30; high, 1351.30; low, 1340.83; close, 1350.50. Inputting these prices into the formulas, we find that our Camarilla pivot point resistance and support levels are:
- R1 = 1351.46; R2 = 1352.42; R3 = 1353.38;
- R4 = 1356.26 S1 = 1349.54; S2 = 1348.58; S3 = 1347.62; S4 = 1344.74
Thus, the trading strategy for Feb. 15 is:
- Buy at 1347.62. Stop loss: 1344.69; Profit targets: 1351.46, 1352.42, 1353.38
- Sell at 1353.38. Stop loss: 1356.31; Profit targets: 1349.54, 1348.58, 1347.62
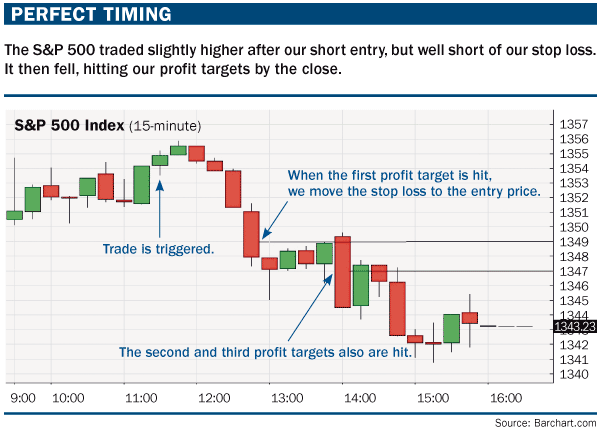
On Feb. 15, the S&P 500 opened at 1350.52, which is between S3 and R3. A short trade was triggered, per our plan, at 11:15 a.m. Subsequently, the S&P 500 made a high of 1355.87, below our stop loss. The market reversed lower and all profit targets were hit by 2 p.m. (see “Perfect timing,” below).
Scenario 2: Camarilla pivot points also are useful in identifying breakout trades. If price breaks beyond Resistance 4 or Support 4, a trade with the trend rather than a reversion trade is signaled. For example, a long trade is set up when price opens between Resistance 3 and Resistance 4. We will buy if price continues above Resistance 4, with profit targets at Resistance 5 and Resistance 6 and a stop loss placed five ticks below Resistance 3.
We can demonstrate with Apple. On Feb. 13, Apple had the following: Open, 499.74; high, 503.83; low, 497.09; close, 502.60. Given these values, our Camarilla pivot point resistance levels are:
- R3 = 504.45; R4 = 506.31; R5 = 508.47; R6 = 509.41
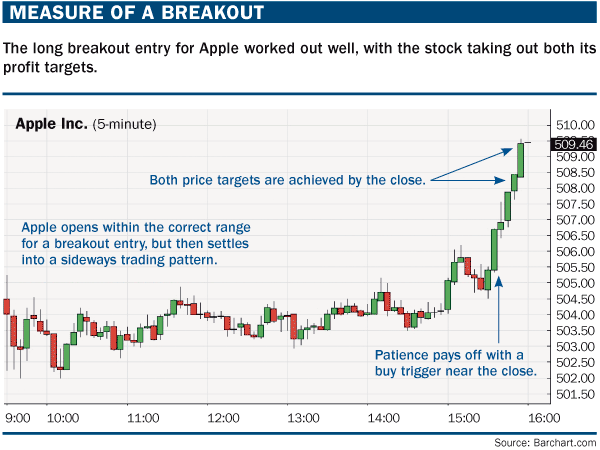
So, our breakout strategy for Feb. 14 is to buy at 506.31 with profit targets at 508.47 and 509.41. Our initial stop loss will be five ticks below R3, or 504.40. It played out, as Apple opened at 504.5 — between R3 and R4 — with the trade triggered at 3:35 p.m., after which Apple achieved the first profit target at 508.47 three (five-minute) bars later and the second profit target immediately after that (see “Measure of a breakout,” below).
Now, let’s look at an example of a short breakout trade. Our logic is the mirror image of the long breakout entry. A short trade is set up when price opens between Support 3 and Support 4. We will sell if price continues below Support 4, with profit targets at Support 5 and Support 6 and a stop loss placed five ticks above Support 3.
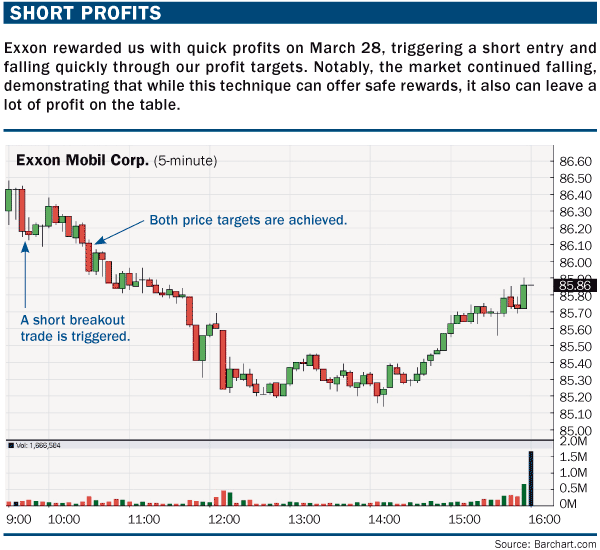
Our example will be based on Exxon Mobil. On March 27, Exxon had the following: Open, 87.13; high, 87.25; low, 86.54; close, 86.62. Given these values, our Camarilla pivot point support levels are:
- S3 = 86.42; S4 = 86.23; S5 = 86.00; S6 = 85.91
This means our strategy for March 28 is to sell at 86.23 if the market opens below 86.42 but above 86.23. Our profit targets will be 86.00 and 85.91. The stop loss is five ticks above 86.42, or 86.37. On March 28, Exxon opened at 86.30 and our short breakout entry was triggered at 9:40 a.m. Both profit targets were hit at 10:30 a.m. (see “Short profits,” below).
Camarilla pivot points are simple but versatile trading tools. They help to find the upper and lower trading ranges for a stock on any particular day. Patience and discipline are key. Traders must wait for the prices to be hit before taking action. Once a trader is comfortable with the core technique, further refinement is possible by combining this strategy with the relative strength index and moving averages.
Author
FXStreet Team
FXStreet
Composed of a group of economic journalists and FX experts, the FXStreet content team produces and oversees all content published on FXStreet. It provides a purely journalistic approach to the Forex market.


