Trading 101: Volume confirms price

The market communicates its mood not only through price but also through volume. This is one message that you really need to pay attention to as volume is a confirmation or a contradiction of price, particularly at certain times.
The message of high volume
The best way to understand high volume is to think of high volume like SOMEONE IS SHOUTING. High volume is like using CAPS LOCK when you are typing. The simple relationship between price and volume is like this:
-
Rising price, rising volume = Increasing demand (bullish).
-
Rising price, falling volume = Decreasing demand (bearish).
-
Falling price, rising volume = Increasing supply (bearish).
-
Falling price, falling volume = Decreasing supply (bullish).
How to view volume?
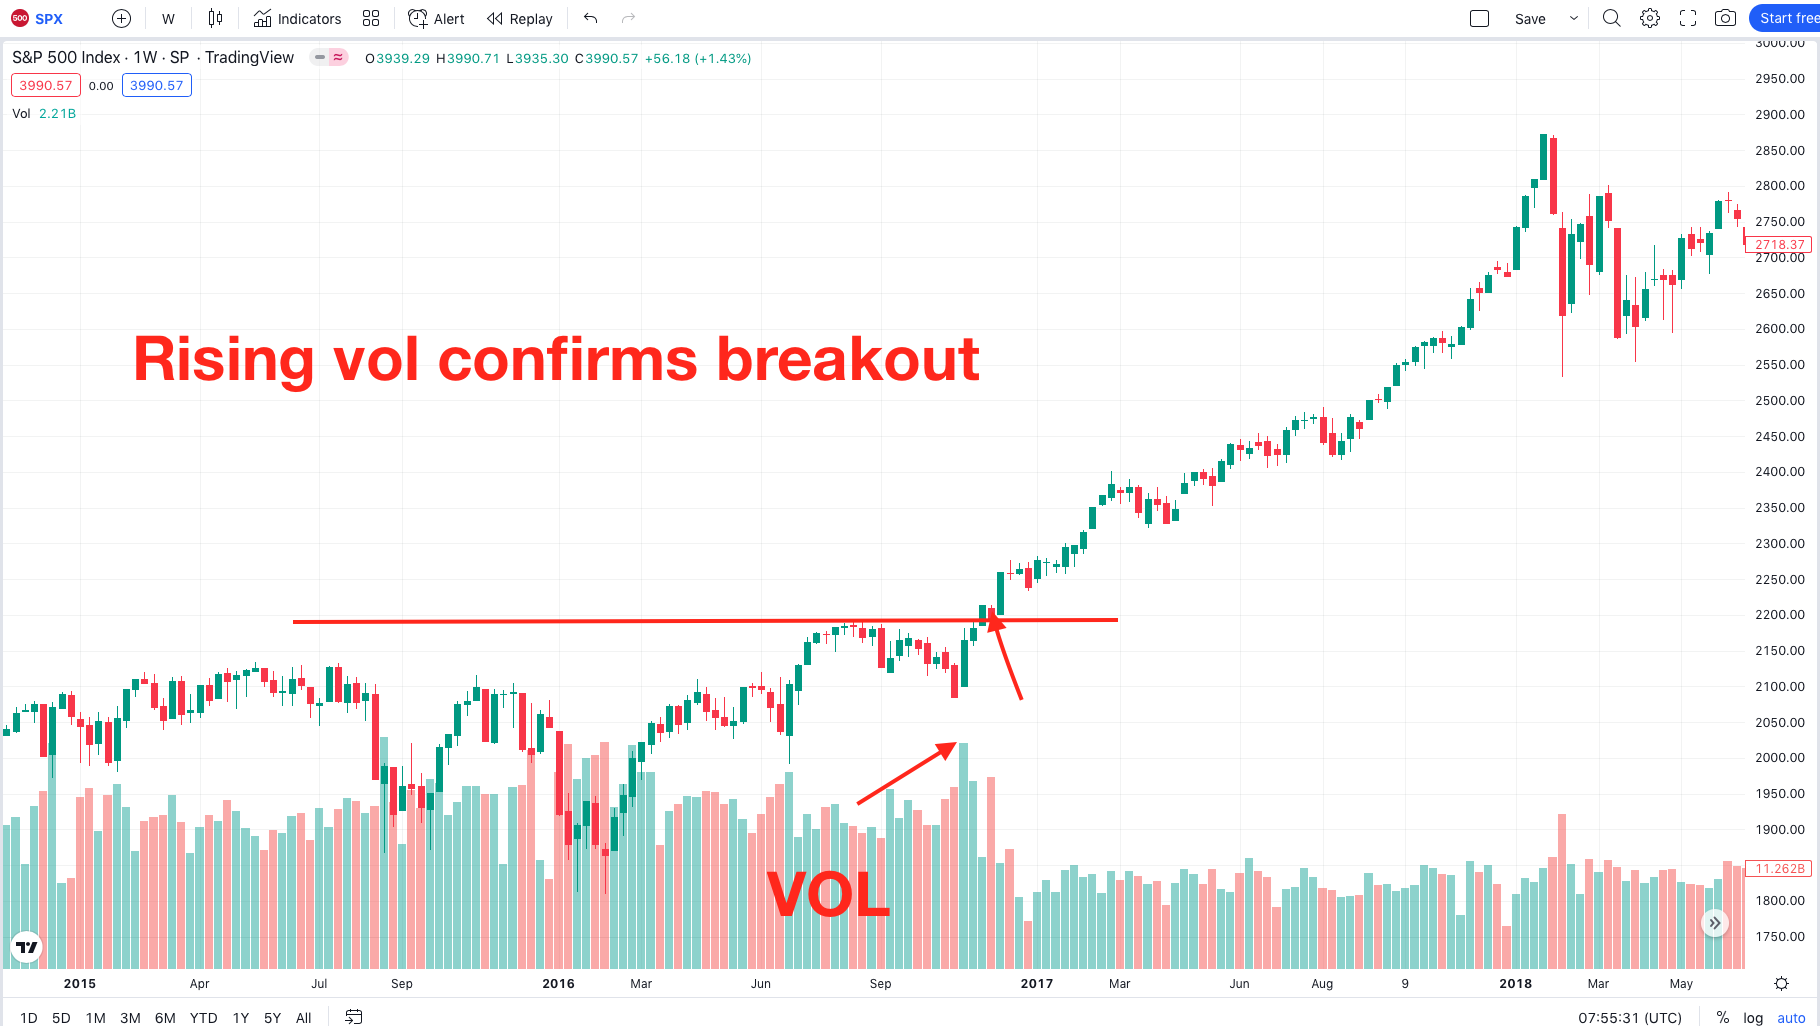
There are many different ways to view volume on a chart, but one of the simplest ways is to just have volume displayed under the price. The interpretation of price is then complimented by volume. Is volume rising or falling with the price? Is this breakout supported with high volume? Remember, volume validates price and a big fundamental shift in the markets accompanied by high volume is a huge vote of confidence. So, if you have not been consulting volume when trading stocks you have been missing out on a key piece of analysis. If you look at the chart below you can see the volume plotted underneath the price.
There are other ways to have volume displayed like using volume profile (very useful) and equivolume charts, but if you have not looked at volume before the simplest way is to look at the example seen here and start with that.
Author

Giles Coghlan LLB, Lth, MA
Financial Source
Giles is the chief market analyst for Financial Source. His goal is to help you find simple, high-conviction fundamental trade opportunities. He has regular media presentations being featured in National and International Press.


