![]() Sam Seiden
Sam Seiden
Independent Analyst
We all want consistent profits, lifelong income from speculating in markets. Anyone can have profitable trades here and there but do they produce consistent returns year after year? The goal in this article is to get right to the point of focusing on the two most important things in trading/investing that lead to consistent returns.
-
Quality Supply and Demand Zones: To identify market turning points and market moves in advance with a high degree of accuracy, you need to know where institutions and banks are buying and selling in the markets. To accomplish this, you must be able to quantify any market’s real supply and demand by looking at a price chart.
-
A Clear Profit Zone: Just as it is important to identify strong supply and demand zones on a chart. It is equally important to be able to identify areas on the price chart where there is very little supply or demand. These are the areas where price will move quickly through.
One of the key components of our patented core strategy that we focus on for every short term and long term trading opportunity is Profit Zone. Without a path for price to move after we enter a position on the chart, there is no trading opportunity. What we are looking for are supply and demand levels with a clear profit zone between them. There are many supply and demand zones on a chart. Often, there is a very quality supply and demand level on a chart, but the problem is they are too close to each other or there is too much trading activity between them, which again means no trade. Typically, we are looking for opportunities on the chart that offer us at least 3:1 reward to risk. Often, we are looking for more but this is a safe minimum to make a trade acceptable to take.
OTA Supply/Demand Grid April 2017: Gold Futures
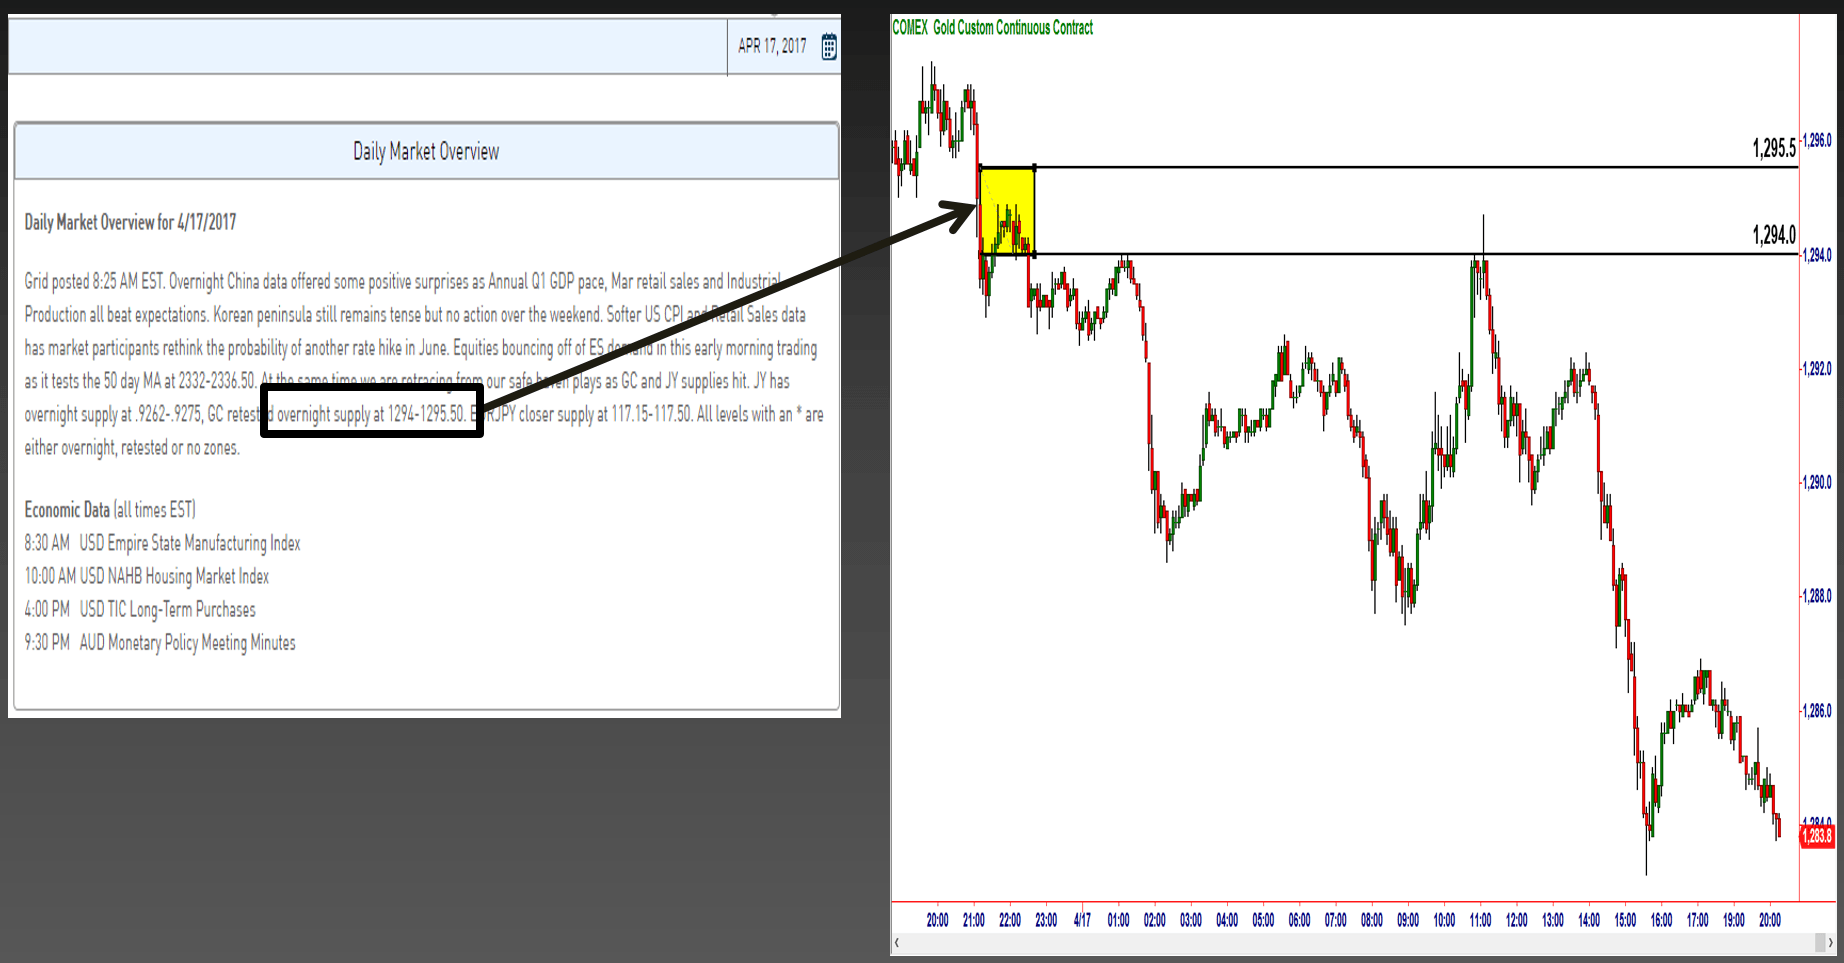
Let me explain through an opportunity found using our Daily Market Overview service for OTA members. This was a trade in the Gold Futures (GC). Notice the supply level on the chart, shaded in yellow. The supply level is the origin of a strong decline in price and has with it some very key Odds Enhancers that make it a significant level where institutions are likely selling, where supply greatly exceeds demand.
The trade was to figure on a downside move, selling short at the supply level to a novice buyer for a potential move down in price. What made this trade work well are two specific things. First was the quality supply level. Second, notice the rally that brought price up to the supply level where we sold short. There was good news, people started buying in a hurry and price shot up quickly. Notice specifically the big green candles. There is no picture of demand in that rally. This means that when price reached the supply level where we sell short, price was likely to fall just as fast as it rallied because there was no significant demand to stop it from falling.
The supply zone causes the turn in price, the lack of demand causes the movement of price.
Everything you need to see is on the price charts, if you know what you’re looking for. If you have been schooled in the theories of conventional technical analysis, you may be blinded by illusions of chart patterns that never really worked for anyone. Have no fear, there is a cure. Remove everything from your charts except price and price alone. My hope is that today’s little nugget of information helps you achieve the consistency you’re looking for.
Hope this was helpful, have a great day.
Note: All information on this page is subject to change. The use of this website constitutes acceptance of our user agreement. Please read our privacy policy and legal disclaimer. Opinions expressed at FXstreet.com are those of the individual authors and do not necessarily represent the opinion of FXstreet.com or its management. Risk Disclosure: Trading foreign exchange on margin carries a high level of risk, and may not be suitable for all investors. The high degree of leverage can work against you as well as for you. Before deciding to invest in foreign exchange you should carefully consider your investment objectives, level of experience, and risk appetite. The possibility exists that you could sustain a loss of some or all of your initial investment and therefore you should not invest money that you cannot afford to lose. You should be aware of all the risks associated with foreign exchange trading, and seek advice from an independent financial advisor if you have any doubts.
Editors’ Picks

EUR/USD extends its optimism past 1.1900
EUR/USD retains a firm underlying bid, surpassing the 1.1900 mark as the NA session draws to a close on Monday. The pair’s persistent uptrend comes as the US Dollar remains on the defensive, with traders staying cautious ahead of upcoming US NFP prints and CPI data.

GBP/USD tilts bullish as markets barrel toward mid-week NFP print
GBP/USD is holding a broader bullish structure on the daily chart, with price trading well above the 50 Exponential Moving Average at 1.3507 and the 200 EMA at 1.3310, confirming the intermediate uptrend that has been in place since the November 2025 low near 1.2300.

USD/JPY slumps below 156.00 as Japanese Yen strengthens after Takaichi's landslide victory
The USD/JPY pair tumbles to near 155.90 during the early Asian session on Tuesday. The Japanese Yen strengthens against the US Dollar after Japanese Prime Minister Sanae Takaichi led the ruling Liberal Democratic Party to a historic landslide win. Traders braced for key US economic data that could offer more clues on the Federal Reserve's monetary policy.
Editors’ Picks

AUD/USD taps three-year highs on broad US Dollar weakness
AUD/USD is trading near three-year highs after a strong break above the 0.7000 psychological level for the first time since February 2023, supported by the Reserve Bank of Australia's surprise 25 basis point rate hike to 3.85% at its February meeting. The daily chart shows the pair in a well-defined uptrend, holding above both the 50-day Exponential Moving Average near 0.6970 and the 200-day EMA around 0.6700.

Gold pushes back above $5,000
The daily chart shows spot Gold in a parabolic uptrend that accelerated sharply from the $4,600 area in late January, printing a record high at $5,598.25 before a violent reversal erased nearly $1,000 in value during the final days of the month.
USD/JPY slumps below 156.00 as Japanese Yen strengthens after Takaichi's landslide victory
The USD/JPY pair tumbles to near 155.90 during the early Asian session on Tuesday. The Japanese Yen strengthens against the US Dollar after Japanese Prime Minister Sanae Takaichi led the ruling Liberal Democratic Party to a historic landslide win. Traders braced for key US economic data that could offer more clues on the Federal Reserve's monetary policy.

Litecoin eyes $50 as heavy losses weigh on investors
Following a strong downtrend across the crypto market over the past week, Litecoin holders are under immense pressure. The Bitcoin fork has trimmed about $1.81 billion from its market capitalization since the beginning of the year, sending it below the top 20 cryptos by market cap.

Japanese PM Takaichi nabs unprecedented victory – US data eyed this week
I do not think I would be exaggerating to say that Japanese Prime Minister Sanae Takaichi’s snap general election gamble paid off over the weekend – and then some. This secured the Liberal Democratic Party (LDP) an unprecedented mandate just three months into her tenure.
RECOMMENDED LESSONS
Making money in forex is easy if you know how the bankers trade!
I’m often mystified in my educational forex articles why so many traders struggle to make consistent money out of forex trading. The answer has more to do with what they don’t know than what they do know. After working in investment banks for 20 years many of which were as a Chief trader its second knowledge how to extract cash out of the market.
5 Forex News Events You Need To Know
In the fast moving world of currency markets where huge moves can seemingly come from nowhere, it is extremely important for new traders to learn about the various economic indicators and forex news events and releases that shape the markets. Indeed, quickly getting a handle on which data to look out for, what it means, and how to trade it can see new traders quickly become far more profitable and sets up the road to long term success.
Top 10 Chart Patterns Every Trader Should Know
Chart patterns are one of the most effective trading tools for a trader. They are pure price-action, and form on the basis of underlying buying and selling pressure. Chart patterns have a proven track-record, and traders use them to identify continuation or reversal signals, to open positions and identify price targets.
7 Ways to Avoid Forex Scams
The forex industry is recently seeing more and more scams. Here are 7 ways to avoid losing your money in such scams: Forex scams are becoming frequent. Michael Greenberg reports on luxurious expenses, including a submarine bought from the money taken from forex traders. Here’s another report of a forex fraud. So, how can we avoid falling in such forex scams?
What Are the 10 Fatal Mistakes Traders Make
Trading is exciting. Trading is hard. Trading is extremely hard. Some say that it takes more than 10,000 hours to master. Others believe that trading is the way to quick riches. They might be both wrong. What is important to know that no matter how experienced you are, mistakes will be part of the trading process.
The challenge: Timing the market and trader psychology
Successful trading often comes down to timing – entering and exiting trades at the right moments. Yet timing the market is notoriously difficult, largely because human psychology can derail even the best plans. Two powerful emotions in particular – fear and greed – tend to drive trading decisions off course.