![]() Elliott Wave Forecast Team
Elliott Wave Forecast Team
ElliottWave-Forecast.com
In this article dated 9/7/2017, we are going to present Elliott Wave Forecast unique and innovative New Elliott Wave Theory through an example. We covered the Elliott Wave Theory in details in our educational part.
Introduction
As a finance trader, we should not trade the charts but a system. The Elliott Wave Forecast chart is a map that our analysts pull up as the most likable path, considering count, correlation, pivot, distribution etc, mainly. A chart describes what happened in order to project price action into the right part of the chart. Now, we don’t fight the map. If an instrument is bullish in daily then we do not sell that instrument even though the 1 hour chart is bearish. The higher trend will prevail most of the time.
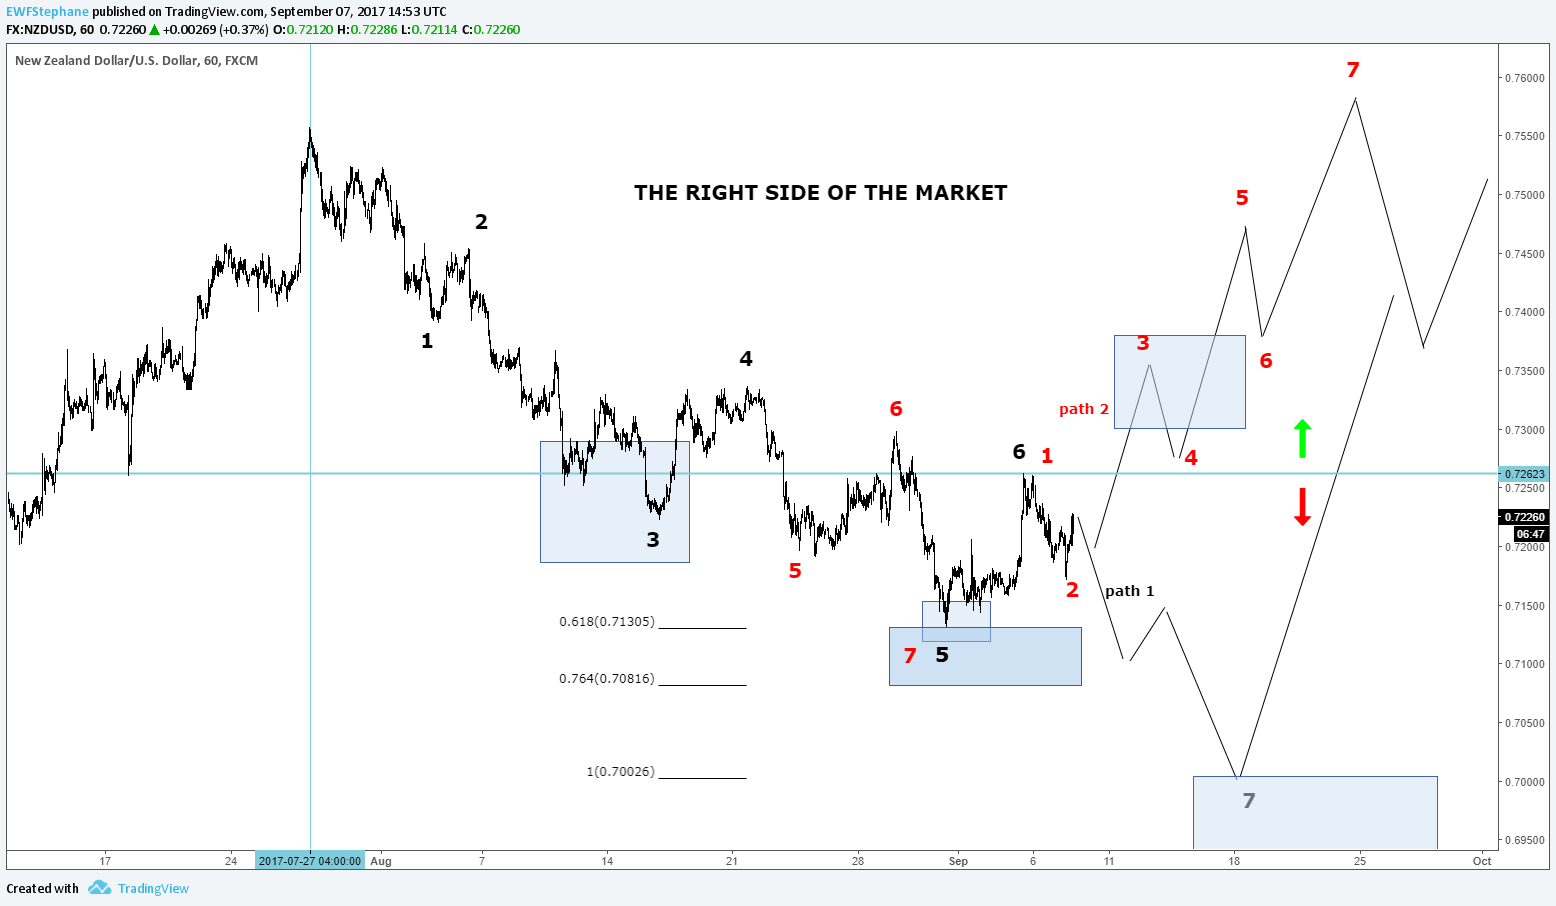
The right side of the market
So, Elliott Wave Forecast developed a system where we buy/sell extension in 3, 7, 11 swings in corrective cycle to the main trend. As we believe that the Forex market moves in cycles of 3 swings, we have established the Blue Box system that you see on all our charts and where the market is likely to react. We call this area the ‘no enemy zone’ where buyers and sellers are in agreement and a reaction is be seen.
Look at the 1H chart of the NZDUSD below since end of July 2017. You may feel compelled to sell the instrument. Many wavers following Elliott Wave Theory would have placed 10 times a 5 waves move in the first leg in black. Since early stage, we have been telling our members not to do so. We surely have told them to buy at black 3, we tell them to buy the black 7. Would have I lost all my capital? No, because I follow our system and do not just trade the charts.
EWF charts contain Elliott Wave labeling because it is now universal, but we found that was not the system that would allow traders to make trade setup, to be profitable, etc. We use another counting system that is compatible with Elliott Wave Theory and do not violate any of its rules. It allows us to clearly define bullish or bearish sequence and when to stay on the sideline.
Why is it not a sell?
Because the NZDUSD is bullish in daily. We look at the daily chart and do not need any indicator or other tools to see this. However, we do understand correction but to exploit NZD weakness, we would have focused on other instruments like EURNZD for example. So, I will position buy order at the black 7 area with a stop loss that makes senses with the chart, together with a proper risk management.
Now it’s the market to do its thing. We don’t do the market. But we won’t sell, we cannot buy at those level, so we wait. That is the life of a trader, looking for setup and wait for the market to come to us, without forcing.
That being said, if you have looked at all different charts delivered by the analysts from the moment I write this blog and July 2017, the count would have changed many times. Does that bother me? No, because I had nothing to trade in NZDUSD during that period.
When my order is triggered, am I going to be affected if the count changes again? No, because I would have put my stop loss where it belongs according to our system. My risk would be set to 1-2% of my account and if price reaches my target, I will feel lucky and thankful. Period.
In case the trade is not filled and price moves higher, I will not chase it because this is not our system anymore. I will look at the chart again, and repeat the process to find buying opportunities. More importantly, I will be on the right side of the market.
We will meet again if you wish to see what is happening next.
Conclusion
What matters to a trader is not the chart or the count by itself. What matters is all the components that are around the charts. This is what we do at Elliott Wave Forecast. We show you the path and have you stay on the right side of the market. And we do that for 78 different instruments with 5 daily updates and 4 live sessions. Every day. We also propose 2 Live Trading sessions where we explain setups in details.
FURTHER DISCLOSURES AND DISCLAIMER CONCERNING RISK, RESPONSIBILITY AND LIABILITY Trading in the Foreign Exchange market is a challenging opportunity where above average returns are available for educated and experienced investors who are willing to take above average risk. However, before deciding to participate in Foreign Exchange (FX) trading, you should carefully consider your investment objectives, level of xperience and risk appetite. Do not invest or trade capital you cannot afford to lose. EME PROCESSING AND CONSULTING, LLC, THEIR REPRESENTATIVES, AND ANYONE WORKING FOR OR WITHIN WWW.ELLIOTTWAVE- FORECAST.COM is not responsible for any loss from any form of distributed advice, signal, analysis, or content. Again, we fully DISCLOSE to the Subscriber base that the Service as a whole, the individual Parties, Representatives, or owners shall not be liable to any and all Subscribers for any losses or damages as a result of any action taken by the Subscriber from any trade idea or signal posted on the website(s) distributed through any form of social-media, email, the website, and/or any other electronic, written, verbal, or future form of communication . All analysis, trading signals, trading recommendations, all charts, communicated interpretations of the wave counts, and all content from any media form produced by www.Elliottwave-forecast.com and/or the Representatives are solely the opinions and best efforts of the respective author(s). In general Forex instruments are highly leveraged, and traders can lose some or all of their initial margin funds. All content provided by www.Elliottwave-forecast.com is expressed in good faith and is intended to help Subscribers succeed in the marketplace, but it is never guaranteed. There is no “holy grail” to trading or forecasting the market and we are wrong sometimes like everyone else. Please understand and accept the risk involved when making any trading and/or investment decision. UNDERSTAND that all the content we provide is protected through copyright of EME PROCESSING AND CONSULTING, LLC. It is illegal to disseminate in any form of communication any part or all of our proprietary information without specific authorization. UNDERSTAND that you also agree to not allow persons that are not PAID SUBSCRIBERS to view any of the content not released publicly. IF YOU ARE FOUND TO BE IN VIOLATION OF THESE RESTRICTIONS you or your firm (as the Subscriber) will be charged fully with no discount for one year subscription to our Premium Plus Plan at $1,799.88 for EACH person or firm who received any of our content illegally through the respected intermediary’s (Subscriber in violation of terms) channel(s) of communication.
Editors’ Picks

EUR/USD looks offered below 1.1900
EUR/USD keeps its bearish tone unchanged ahead of the opening bell in Asia, returning to the sub-1.1900 region following a firmer tone in the US Dollar. Indeed, the pair reverses two consecutive daily gains amid steady caution ahead of Wednesday’s key US Nonfarm Payrolls release.

GBP/USD slips back to daily lows near 1.3640
GBP/USD drops to daily lows near 1.3640 as sellers push harder and the Greenback extends its rebound in the latter part of Tuesday’s session. Looking ahead, the combination of key US releases, including NFP and CPI, alongside important UK data, should keep the pound firmly in focus over the coming days.

USD/JPY extends backslide as election fallout bolsters Yen
USD/JPY is trading in a choppy, range-bound structure on the daily chart, oscillating between the January high near 159.450 and the late-January swing low at 152.100. Price closed Monday at 154.410, dropping sharply by 1.47 yen (0.94%) after an initial gap higher following Prime Minister Takaichi's landslide election victory was met with verbal intervention from Finance Minister Katayama and Japan's top currency official Mimura, both signaling readiness to act on yen volatility.
Editors’ Picks

When are the China’s CPI, PPI and how could they affect AUD/USD?
The National Bureau of Statistics of China will publish its data for January at 01.30 GMT. The Consumer Price Index is expected to show a rise of 0.4% YoY in January, compared to 0.8% in December. The Producer Price Index is projected to show a decline of 1.5% in January versus a fall of 1.9% prior.
USD/JPY extends backslide as election fallout bolsters Yen
USD/JPY is trading in a choppy, range-bound structure on the daily chart, oscillating between the January high near 159.450 and the late-January swing low at 152.100. Price closed Monday at 154.410, dropping sharply by 1.47 yen (0.94%) after an initial gap higher following Prime Minister Takaichi's landslide election victory was met with verbal intervention from Finance Minister Katayama and Japan's top currency official Mimura, both signaling readiness to act on yen volatility.

Gold declines to near $5,050, focus shifts to US jobs data
Gold price falls to near $5,045 during the early Asian session on Wednesday. Traders assess whether prices have found a floor following a historic sell-off. The delayed US employment report for January, which was pushed back due to the recently ended four-day government shutdown, will take center stage later on Wednesday.

Ethereum: Whales buy the dip amid rising short bets
Following one of Ethereum's largest weekly drawdowns, whales are slowly returning to action alongside a drop in retail selling pressure. After slightly selling into the decline at the start of the month, whales or wallets with a balance of 10K-100K ETH began buying the dip last Wednesday as prices crashed further.

Dollar drops and stocks rally: The week of reckoning for US economic data
Following a sizeable move lower in US technology Stocks last week, we have witnessed a meaningful recovery unfold. The USD Index is in a concerning position; the monthly price continues to hold the south channel support.
RECOMMENDED LESSONS
Making money in forex is easy if you know how the bankers trade!
I’m often mystified in my educational forex articles why so many traders struggle to make consistent money out of forex trading. The answer has more to do with what they don’t know than what they do know. After working in investment banks for 20 years many of which were as a Chief trader its second knowledge how to extract cash out of the market.
5 Forex News Events You Need To Know
In the fast moving world of currency markets where huge moves can seemingly come from nowhere, it is extremely important for new traders to learn about the various economic indicators and forex news events and releases that shape the markets. Indeed, quickly getting a handle on which data to look out for, what it means, and how to trade it can see new traders quickly become far more profitable and sets up the road to long term success.
Top 10 Chart Patterns Every Trader Should Know
Chart patterns are one of the most effective trading tools for a trader. They are pure price-action, and form on the basis of underlying buying and selling pressure. Chart patterns have a proven track-record, and traders use them to identify continuation or reversal signals, to open positions and identify price targets.
7 Ways to Avoid Forex Scams
The forex industry is recently seeing more and more scams. Here are 7 ways to avoid losing your money in such scams: Forex scams are becoming frequent. Michael Greenberg reports on luxurious expenses, including a submarine bought from the money taken from forex traders. Here’s another report of a forex fraud. So, how can we avoid falling in such forex scams?
What Are the 10 Fatal Mistakes Traders Make
Trading is exciting. Trading is hard. Trading is extremely hard. Some say that it takes more than 10,000 hours to master. Others believe that trading is the way to quick riches. They might be both wrong. What is important to know that no matter how experienced you are, mistakes will be part of the trading process.
The challenge: Timing the market and trader psychology
Successful trading often comes down to timing – entering and exiting trades at the right moments. Yet timing the market is notoriously difficult, largely because human psychology can derail even the best plans. Two powerful emotions in particular – fear and greed – tend to drive trading decisions off course.