Support & Resistance: Trading The Retest
Understanding Support & Resistance
Learning to understand and effectively use support and resistance was a major turning point in my own trading. It is essential when trading that you find something that make sense to you, that you understand and believe in and that you are able to build a solid trading plan around. Support and resistance levels can at first seem quite difficult to engage as the levels may seem tricky to identify and this is why it is crucial that you firstly learn to properly identify support and resistance levels in the market and begin to understand how price reacts around them so that you are able to then move on to trading them.
If you aren’t already familiar with support and resistance levels then check out this brief video and for a more in-depth look check out this webinar recording.
The most basic way that we look to use support and resistance levels is to fade them, whereby we look to buy into support and sell into resistance. This type of strategy can work well initially with clearly defined levels as price moves into them for the first few times. However, as we build our Forex knowledge and start to learn more about how the market works we can start to take advantage of further dynamics at play around these important levels.
Understanding Order Flow
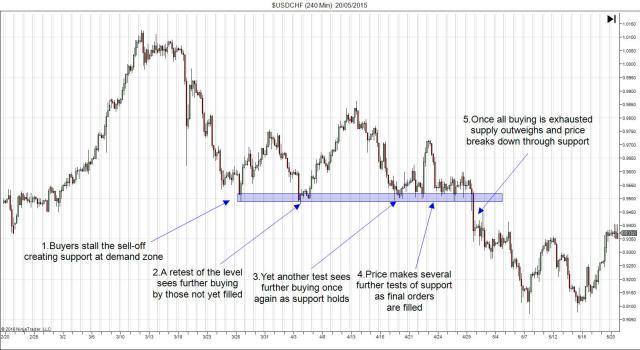
As we know, the reason that support and resistance levels exist is due to the underlying order flow in the market. A build up of buy orders creates support and a build up of sell orders creates resistance. Each subsequent time these levels are tested, the order at the level are eroded as more participants enter the market. Eventually, upon enough probing these orders giver way and the supply/demand balance shifts.
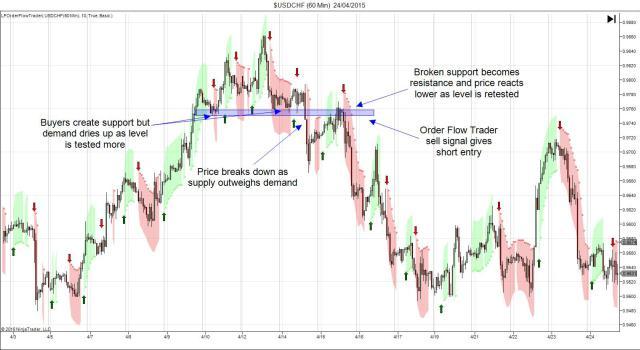
For example, as a surge in buying creates a support area, we see price bounce as buy orders are filled. If price then returns to that area we see further reactions higher as those buy orders not filled first time around are filled along with fresh buying. Subsequent returns to the level may similarly be met with further buying but eventually as all original buy orders are filled and fresh buying dries up to due to the lack of momentum we see a shift in the supply/demand scale and supply outweighs demand to take price lower.
Trading The Retest
The typical guidelines espoused for trading support and resistance suggest that the more times a specifics level or area is tested the stronger it becomes. Whilst it is true that levels displaying many tests are indeed strong, the idea that these levels become stronger with each touch is actually the opposite of what is happening due to the order flow dynamic we just discussed. An understanding of this dynamic paves the way for new trading opportunities in the market.
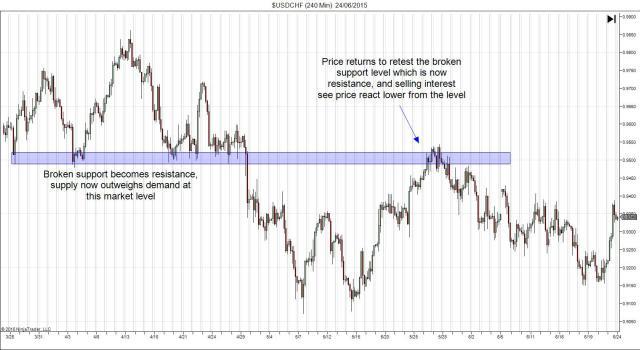
As broken support indicates the dominance of supply over demand in the market we need to adapt our view. The area that was once support, created by strong demand, now becomes resistance, created by supply. Where we previously might have looked to buy at that area, anticipating a reaction higher we can now look to sell, anticipating that as price returns to that level sell-orders previously unfilled will be filled along with potentially fresh selling interest.
Trading the retest of key levels in the market can be an extremely simple yet powerfully effective trading strategy. The beauty of the idea is that due to the underlying order flow creating the setup, you can really trade this on all time-frames as the same dynamic plays our over and over again on different scales. Even within the large example we are looking at I can clearly identify setups that would have been fantastic lower time-frame trading opportunities.
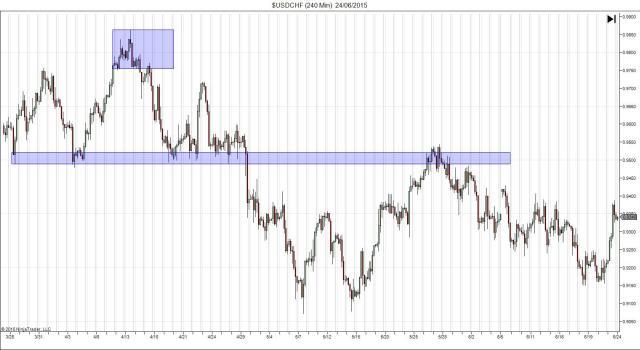
Lets zoom in further on the rectangular area highlighted in the chart above.
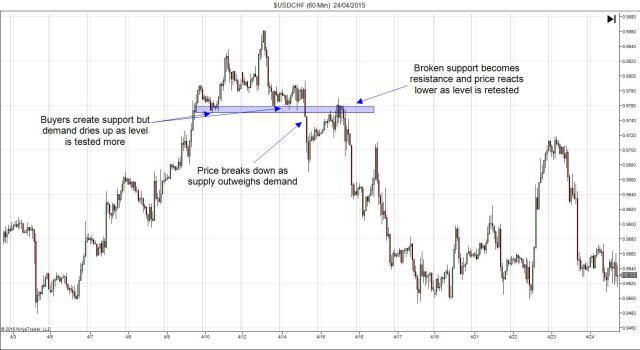
Can you see how exactly the same setup occurs on the lower time-frame? The very order flow dynamic that we were looking at in our larger 4hour chart setup is seen here working in precisely the same way on the 1hour charts.
Creating A Trading Plan
Once you have a raw trading idea in place such as we have here, you then need to think about really firming the idea up and shaping a solid trading plan that you can construct rules for, allowing you to consistently engage the market based on your plan.
Things to think about:
Will you simply trade a retest of the level or will you look for further confirmation such as identifying key price action signals? Alternatively, will you look to combine an indicator to act as a filter for your trades?
If you are looking to build indicators in to you system, Order Flow Trader can be a fantastic tool to use in these scenarios whereby you look to enter on an Order Flow Trader signal given as price reacts to the level retest.
Furthermore, you must consider your stop loss placement. Will you use structural levels such as recent key highs or lows, or will you use an ATR based stop considering the volatility of the instrument in your placement. If you use ATR based stops you should definitely check out our ATR Boundaries indicator which is an incredibly effective upgrade of the classic ATR indicator and can be really helpful in stop placement.
Finally you need to consider your targets. Will you run a simple risk:reward based system where you look to target x times your initial risk or will you consider market structure, targeting the next key level?
In considering your targets, one final point to note is that in terms of taking the very best setups and really looking to give yourself as good a shot as possible at placing a winning trade you should always be looking to trade with the trend and infact this simple setup can be a really effective way of gaining entry to trending markets. Simply establish the dominant trend on the higher time-frames and then drop down down onto the lower time-frames seeking to identify the retest of key broken support and resistance levels to give you entry in line with the dominant trend. This will give more weight to your trade and you may find that momentum affords you bigger winners, allowing you to trail stops rather than playing for a specific target.
Learning to understand and effectively use support and resistance was a major turning point in my own trading. It is essential when trading that you find something that make sense to you, that you understand and believe in and that you are able to build a solid trading plan around. Support and resistance levels can at first seem quite difficult to engage as the levels may seem tricky to identify and this is why it is crucial that you firstly learn to properly identify support and resistance levels in the market and begin to understand how price reacts around them so that you are able to then move on to trading them.
If you aren’t already familiar with support and resistance levels then check out this brief video and for a more in-depth look check out this webinar recording.
The most basic way that we look to use support and resistance levels is to fade them, whereby we look to buy into support and sell into resistance. This type of strategy can work well initially with clearly defined levels as price moves into them for the first few times. However, as we build our Forex knowledge and start to learn more about how the market works we can start to take advantage of further dynamics at play around these important levels.
Understanding Order Flow
As we know, the reason that support and resistance levels exist is due to the underlying order flow in the market. A build up of buy orders creates support and a build up of sell orders creates resistance. Each subsequent time these levels are tested, the order at the level are eroded as more participants enter the market. Eventually, upon enough probing these orders giver way and the supply/demand balance shifts.
For example, as a surge in buying creates a support area, we see price bounce as buy orders are filled. If price then returns to that area we see further reactions higher as those buy orders not filled first time around are filled along with fresh buying. Subsequent returns to the level may similarly be met with further buying but eventually as all original buy orders are filled and fresh buying dries up to due to the lack of momentum we see a shift in the supply/demand scale and supply outweighs demand to take price lower.
Trading The Retest
The typical guidelines espoused for trading support and resistance suggest that the more times a specifics level or area is tested the stronger it becomes. Whilst it is true that levels displaying many tests are indeed strong, the idea that these levels become stronger with each touch is actually the opposite of what is happening due to the order flow dynamic we just discussed. An understanding of this dynamic paves the way for new trading opportunities in the market.
As broken support indicates the dominance of supply over demand in the market we need to adapt our view. The area that was once support, created by strong demand, now becomes resistance, created by supply. Where we previously might have looked to buy at that area, anticipating a reaction higher we can now look to sell, anticipating that as price returns to that level sell-orders previously unfilled will be filled along with potentially fresh selling interest.
Trading the retest of key levels in the market can be an extremely simple yet powerfully effective trading strategy. The beauty of the idea is that due to the underlying order flow creating the setup, you can really trade this on all time-frames as the same dynamic plays our over and over again on different scales. Even within the large example we are looking at I can clearly identify setups that would have been fantastic lower time-frame trading opportunities.
Lets zoom in further on the rectangular area highlighted in the chart above.
Can you see how exactly the same setup occurs on the lower time-frame? The very order flow dynamic that we were looking at in our larger 4hour chart setup is seen here working in precisely the same way on the 1hour charts.
Creating A Trading Plan
Once you have a raw trading idea in place such as we have here, you then need to think about really firming the idea up and shaping a solid trading plan that you can construct rules for, allowing you to consistently engage the market based on your plan.
Things to think about:
Will you simply trade a retest of the level or will you look for further confirmation such as identifying key price action signals? Alternatively, will you look to combine an indicator to act as a filter for your trades?
If you are looking to build indicators in to you system, Order Flow Trader can be a fantastic tool to use in these scenarios whereby you look to enter on an Order Flow Trader signal given as price reacts to the level retest.
Furthermore, you must consider your stop loss placement. Will you use structural levels such as recent key highs or lows, or will you use an ATR based stop considering the volatility of the instrument in your placement. If you use ATR based stops you should definitely check out our ATR Boundaries indicator which is an incredibly effective upgrade of the classic ATR indicator and can be really helpful in stop placement.
Finally you need to consider your targets. Will you run a simple risk:reward based system where you look to target x times your initial risk or will you consider market structure, targeting the next key level?
In considering your targets, one final point to note is that in terms of taking the very best setups and really looking to give yourself as good a shot as possible at placing a winning trade you should always be looking to trade with the trend and infact this simple setup can be a really effective way of gaining entry to trending markets. Simply establish the dominant trend on the higher time-frames and then drop down down onto the lower time-frames seeking to identify the retest of key broken support and resistance levels to give you entry in line with the dominant trend. This will give more weight to your trade and you may find that momentum affords you bigger winners, allowing you to trail stops rather than playing for a specific target.
Author

Littlefish FX Analysts
Littlefish FX
Our expert team of analysts, traders and IT developers have developed innovative and cutting-edge Order Flow Systems giving Littlefish FX a bank-level view of the Foreign Exchange Market.
More from Littlefish FX Analysts


