Stock and Bond Correlation Explained

One asset category that is not very well understood is what we refer to as the credit markets. In the futures market, these encompass all debt instruments such as U.S. Treasury Bills, Notes, and Bonds, and are not limited to derivatives of debt issued by the U.S. treasury. The German debt market can also be traded in the U.S. through most futures brokers on the Eurex exchange. These derivative instruments come with funny names like Schatz, Boble, and Buxl and, finally, the Bund. The different names in all debt instruments are there simply to differentiate the short, medium and long term maturity dates.
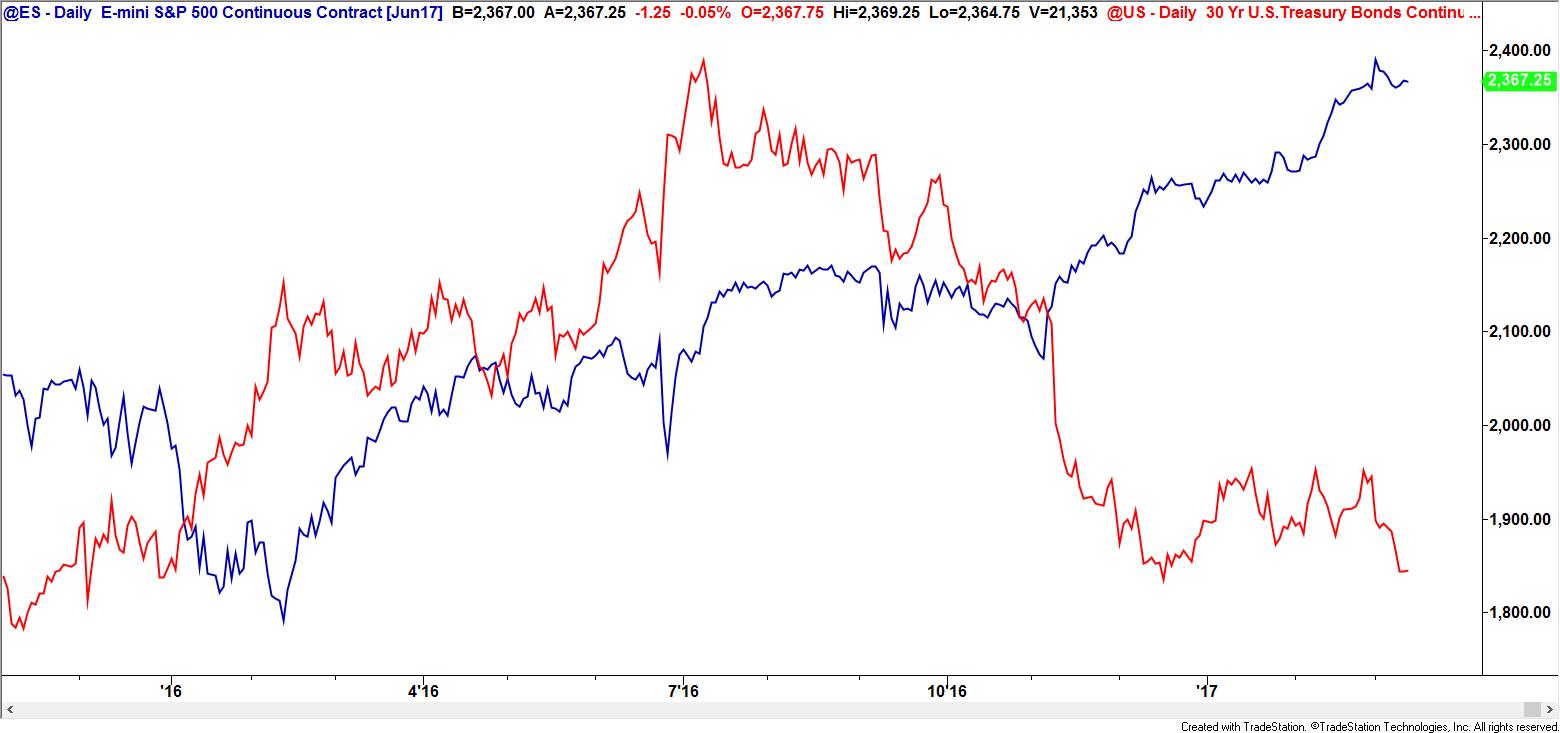
These particular European markets are nice to know about, but for those of us in the U.S., they’re not as important as say Greek, Spanish or Italian debt and, of course, the US debt market. Understanding how debt instruments work can gives us important clues not only to the future course of interest rates, but the tone of the U.S. economy, inflation and, by extension, the stock market. The first point about bonds is that their price movement is generally inversely correlated to that of the stock indices. In the chart below, we can clearly see this inverse relationship as the Red line (T-Bond futures) declines while the Blue line representing the S&P E-mini futures rally.
That’s to say that people move money into what they perceive as a safer investment in times of distress, which is what treasuries provide as they are guaranteed by the full faith and credit of the U.S. Treasury. Regardless of the condition of the U.S. Economy, the fact is these are still considered the safest paper on the globe.
When debt is issued by the Treasury, it has a fixed rate attached to it (otherwise known as coupon) and is issued in denominations of $1000. Let’s say the purchaser of the debt obligation buys a 10-year note at par ($1000) with a 6% coupon. Six months later, prices of treasuries move higher because demand increases. He’ll still receive the coupon, $60.00 a year, but the higher price of the bond will lower the yield as a new buyer of the same paper will spend more for the same coupon. In contrast, if the price of that same paper falls in value, the yield would go up as a new purchaser now will spend less to receive the same coupon.
In the futures market, we trade the notional value of the cash Treasury notes and bonds for which the symbols are (TY) for the 10-year note and (US) for the 30-year bond. U.S Treasury debt is broken into 32 parts; hence, futures prices are quoted in 32nds. That being the case, it would make sense that every tick would be 31.25 ($1000/32=31.25). In the TY (T-Notes), however, they’re broken into half again or 64ths, which makes every tick worth $15.625. I know it seems complicated, but it really isn’t once you get used to the contract.
Since bond prices tend to rally when stocks are declining, Bond traders have earned a reputation for being a glum bunch of guys and gals. Conversely, stock traders are usually over-optimistic, and that can also be problematic.
As I mentioned earlier, the bond market can be helpful as an odds enhancer in timing turning points in the stock index futures, as was the case recently and most likely will be again in the future.
The lesson here is that going forward, the stock market will find it hard to move lower if bonds continue their steep decline. The trick is to know when the odds will increase that bonds will stop falling. Are there times when both of these markets trade in tandem? Yes, but normally not for long; usually something gives.
Until next time, I hope everyone has a great week.
Author

Gabe Velázquez
Online Trading Academy
Gabe got his start in the markets as a broker trainee for Paine Webber, a mere 3 months before the market crash of 1987. He witnessed the gut wrenching fear of investors during that time period and the wild speculative euphoria of the late 90's.


