![]() Brandon Wendell, CMT
Brandon Wendell, CMT
Brandon Wendell
Technical indicators have long been misused by traders and investors alike. Many learn the traditional style of using the indicators and then try to massage the data to fit certain strategies of trading only to have them fail when the market conditions change. Others simply do not understand their use properly and misinterpret the data.
As a Chartered Market Technician and member for the Market Technician’s Association, I was required to gain a deep understanding of how most indicators and oscillators work. I was fortunate enough to learn some special tricks for using these indicators so that they work much better than originally intended, in any market!
One such modified indicator is the popular Relative Strength Index (RSI). I want to stress that my entries and exits for trades are triggered by price action and I use the core strategy taught at Online Trading Academy in my own trading. The indicators I use are simply an odds enhancer or a support tool for decisions made from price action.
Most traders are familiar with the Relative Strength Index or RSI. It is an oscillator that measures the strength of up or down movements in price relative to the stock’s previous price movements. The typical readings for this indicator are 70-30. A reading of 70% means that the stock is overbought and likely to drop soon. The RSI crossing below the 70% line is sometimes taken as a sell signal. Conversely, a reading below 30% shows the stock to be oversold and perhaps ready to rise. A buy signal is said to be generated when the RSI crosses above 30.
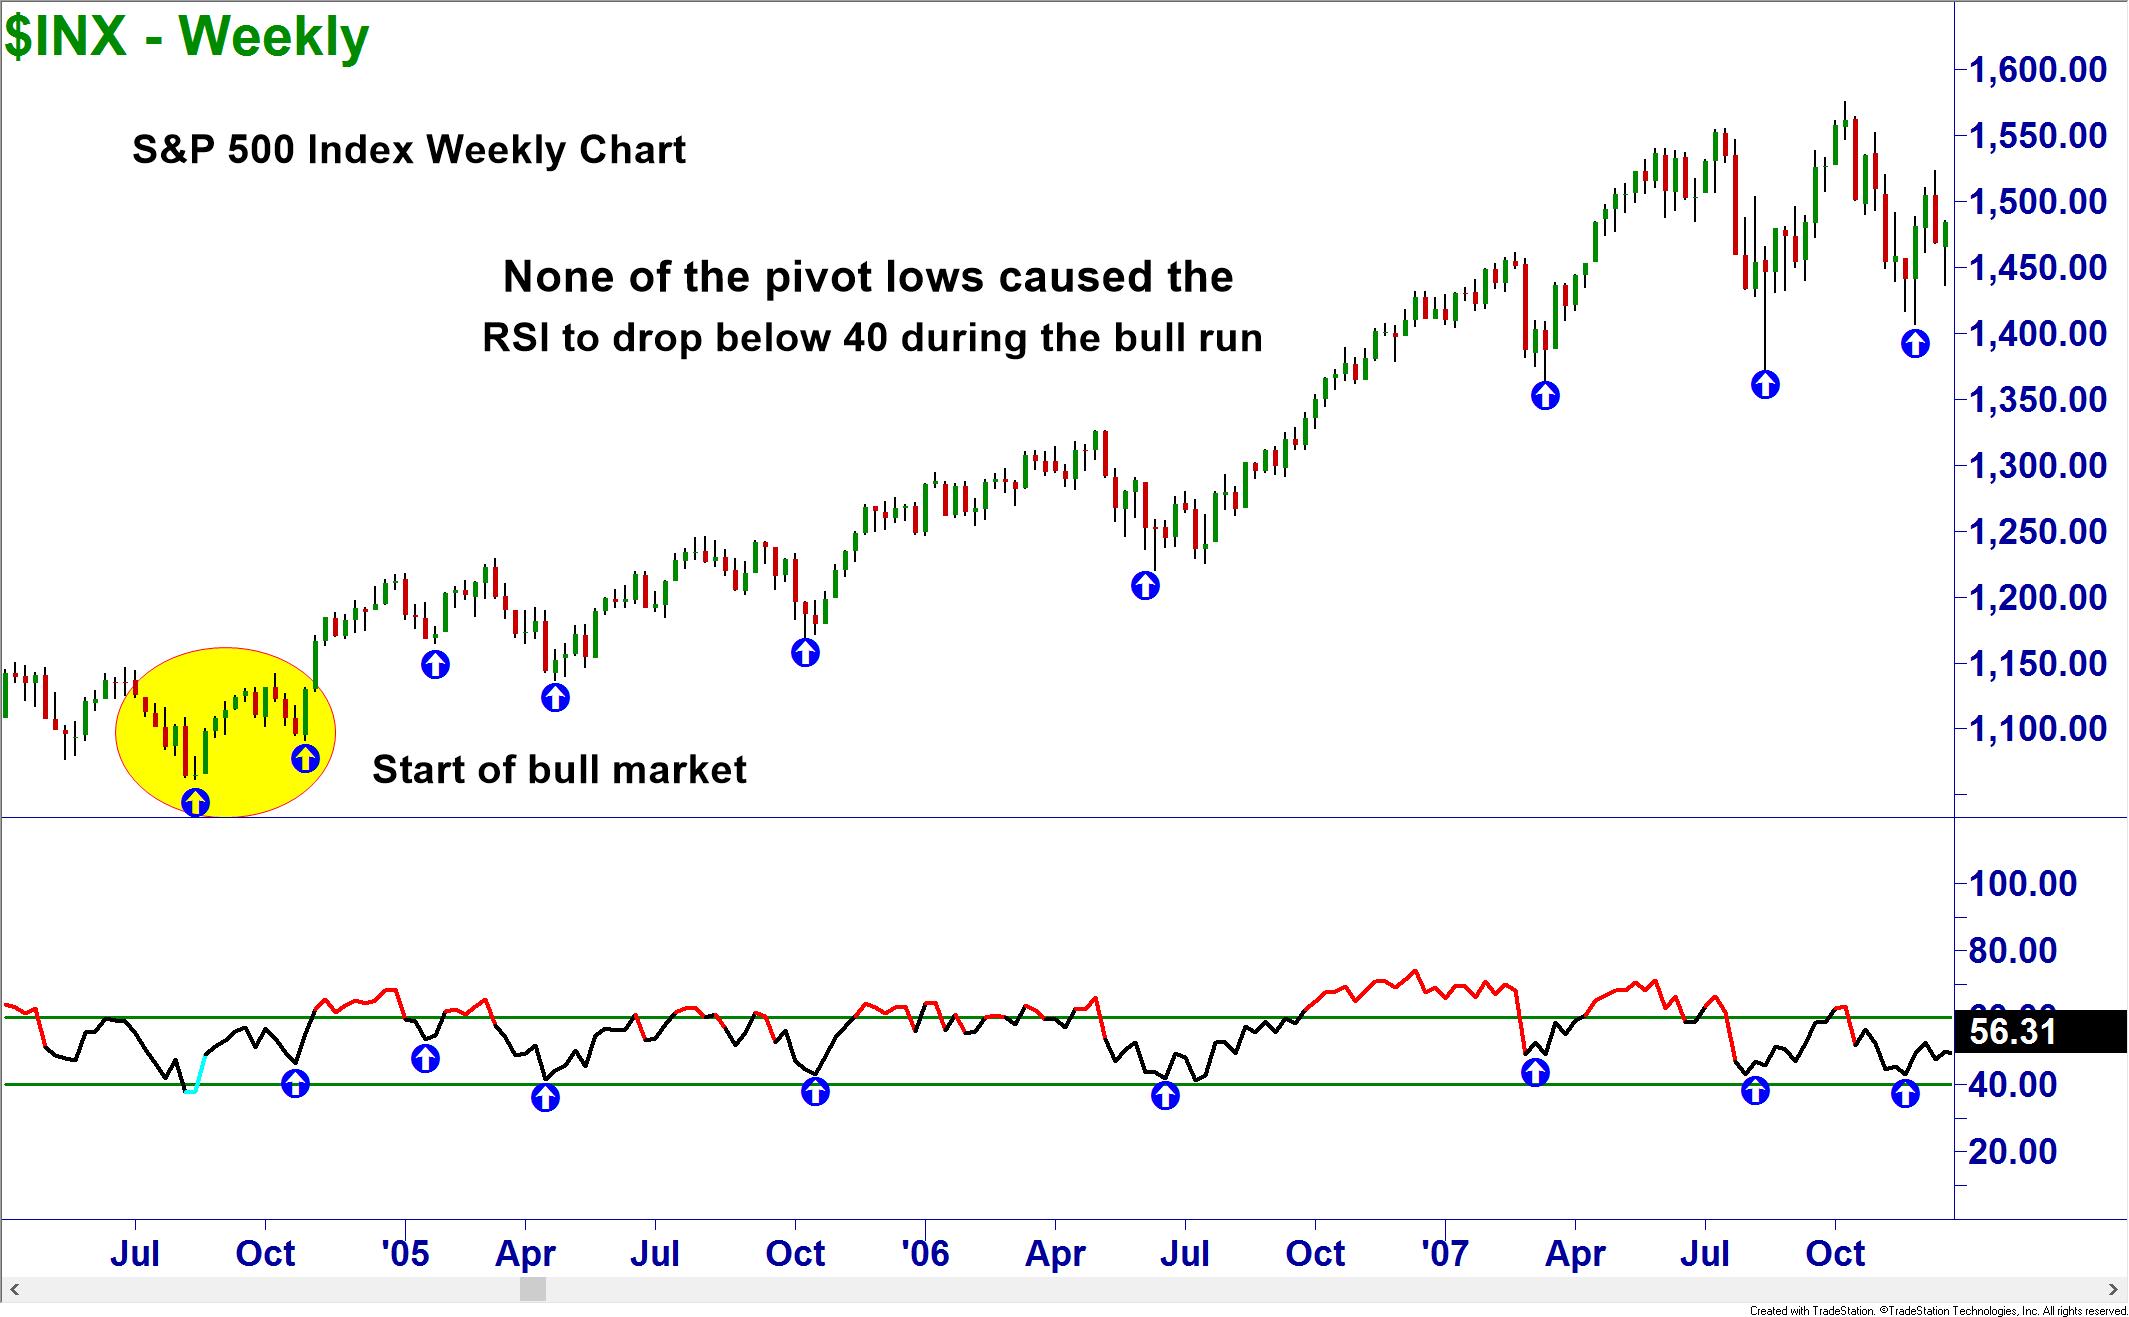
The problem with using the RSI in this manner is that in a strong uptrend the RSI will typically use 40 as a support level, meaning that the RSI will not drop below 40 while the trend is intact. Look at the chart of the 2004 to 2007 bull market in the S&P 500 Index weekly chart.
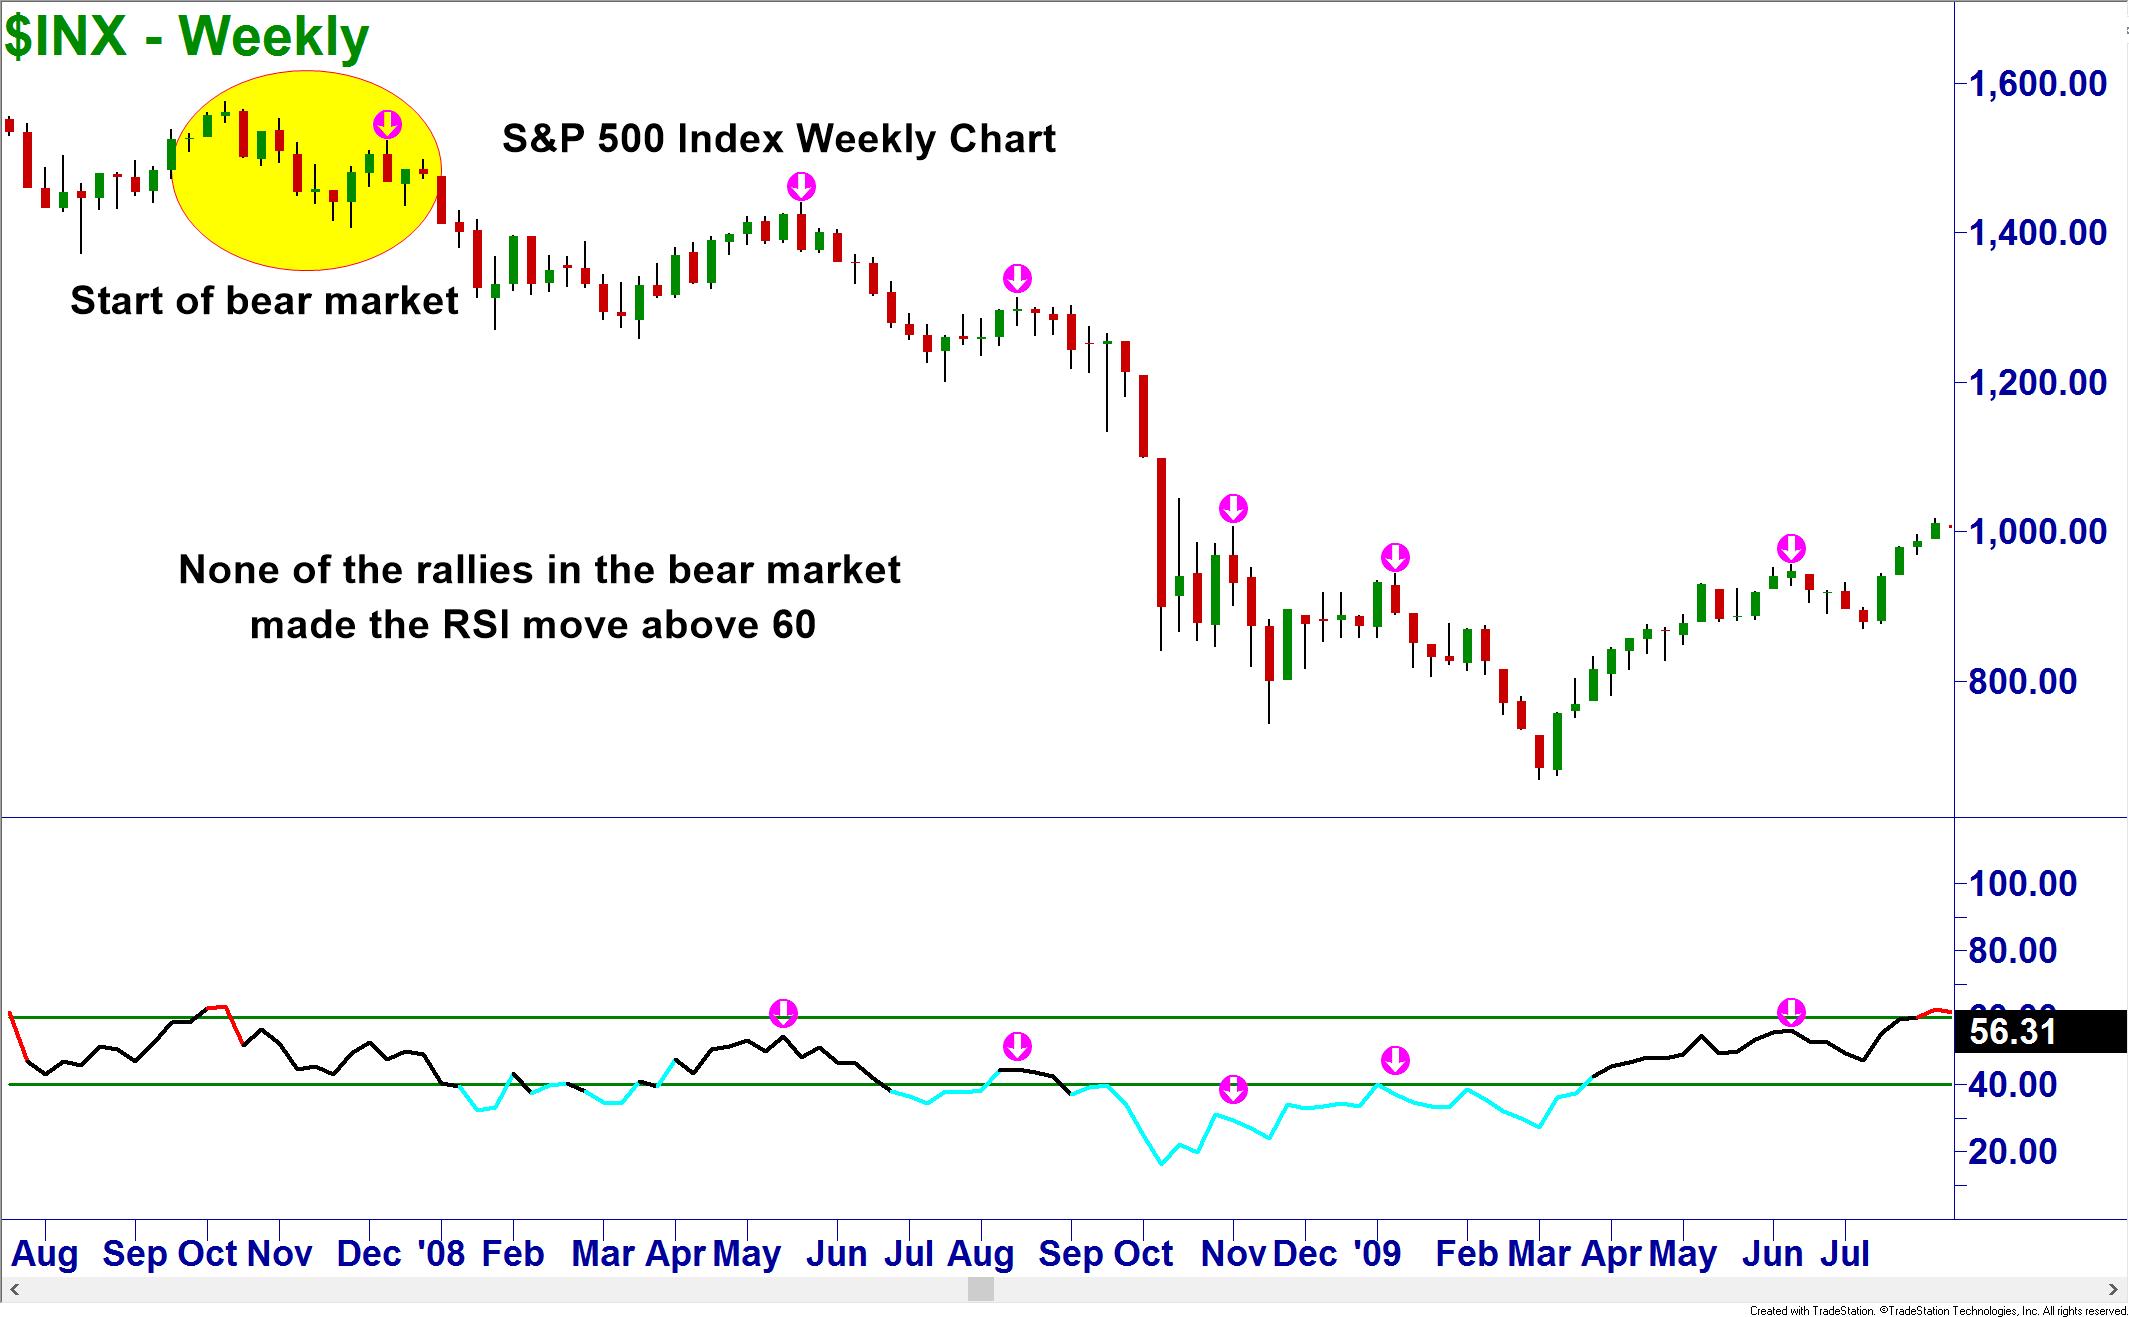
When price is in a strong downtrend, the RSI will use 60 as a resistance level. The RSI will not break above 60 until the trend is breaking. You can see this in the 2008 bear market. All of the rallies failed to move the RSI above 60.
When we are trading in the trend, we want to let our profits run as long as possible and do not want to enter into trades with a low probability of working. Since the RSI uses 60 and 40 as boundaries for trends, the traditional buy and sell signals will not work as you cannot get a buy signal below 30 in a strong bull trend nor will you see a sell signal from a cross below 70. Instead, a use for the RSI would be for determining the trend direction and strength of the trend.
In the Professional Trader Courses at Online Trading Academy, our students learn how to identify trends properly and also how to use multiple time frame analysis to increase their probability of making successful trades. The RSI can assist in this type of analysis but it cannot be used alone.
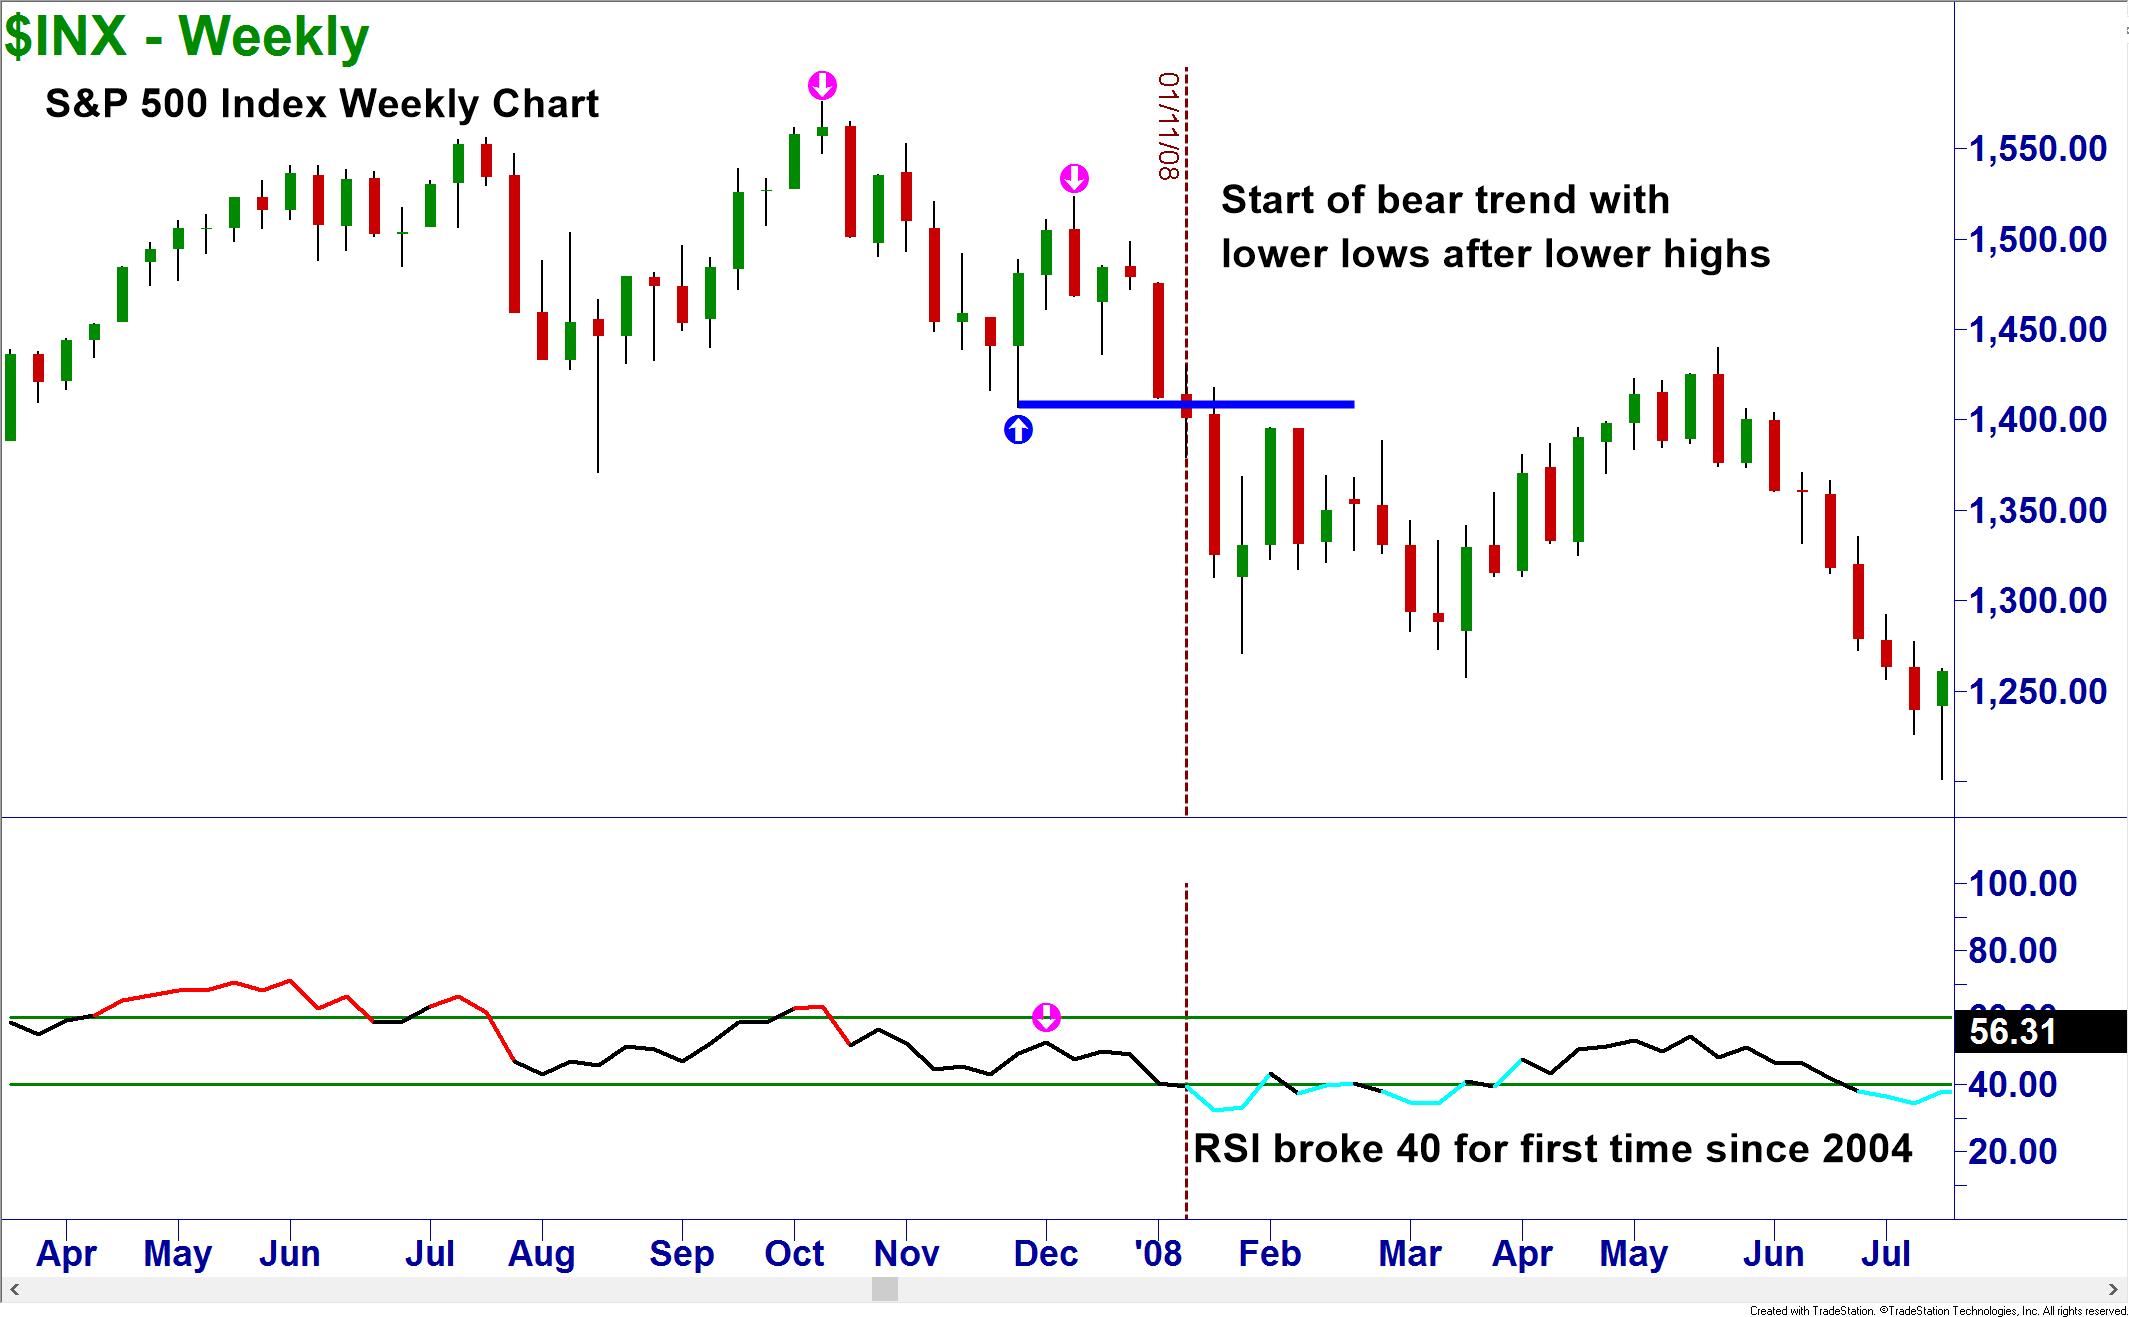
Going back to the weekly chart of the S&P 500, the trend change from bull to bear becomes confirmed once the RSI drops below 40. There were earlier signals that educated traders could have seen but those who waited for the confirmation from the RSI were still able to avoid the pain of the large price drop or even profit from it.
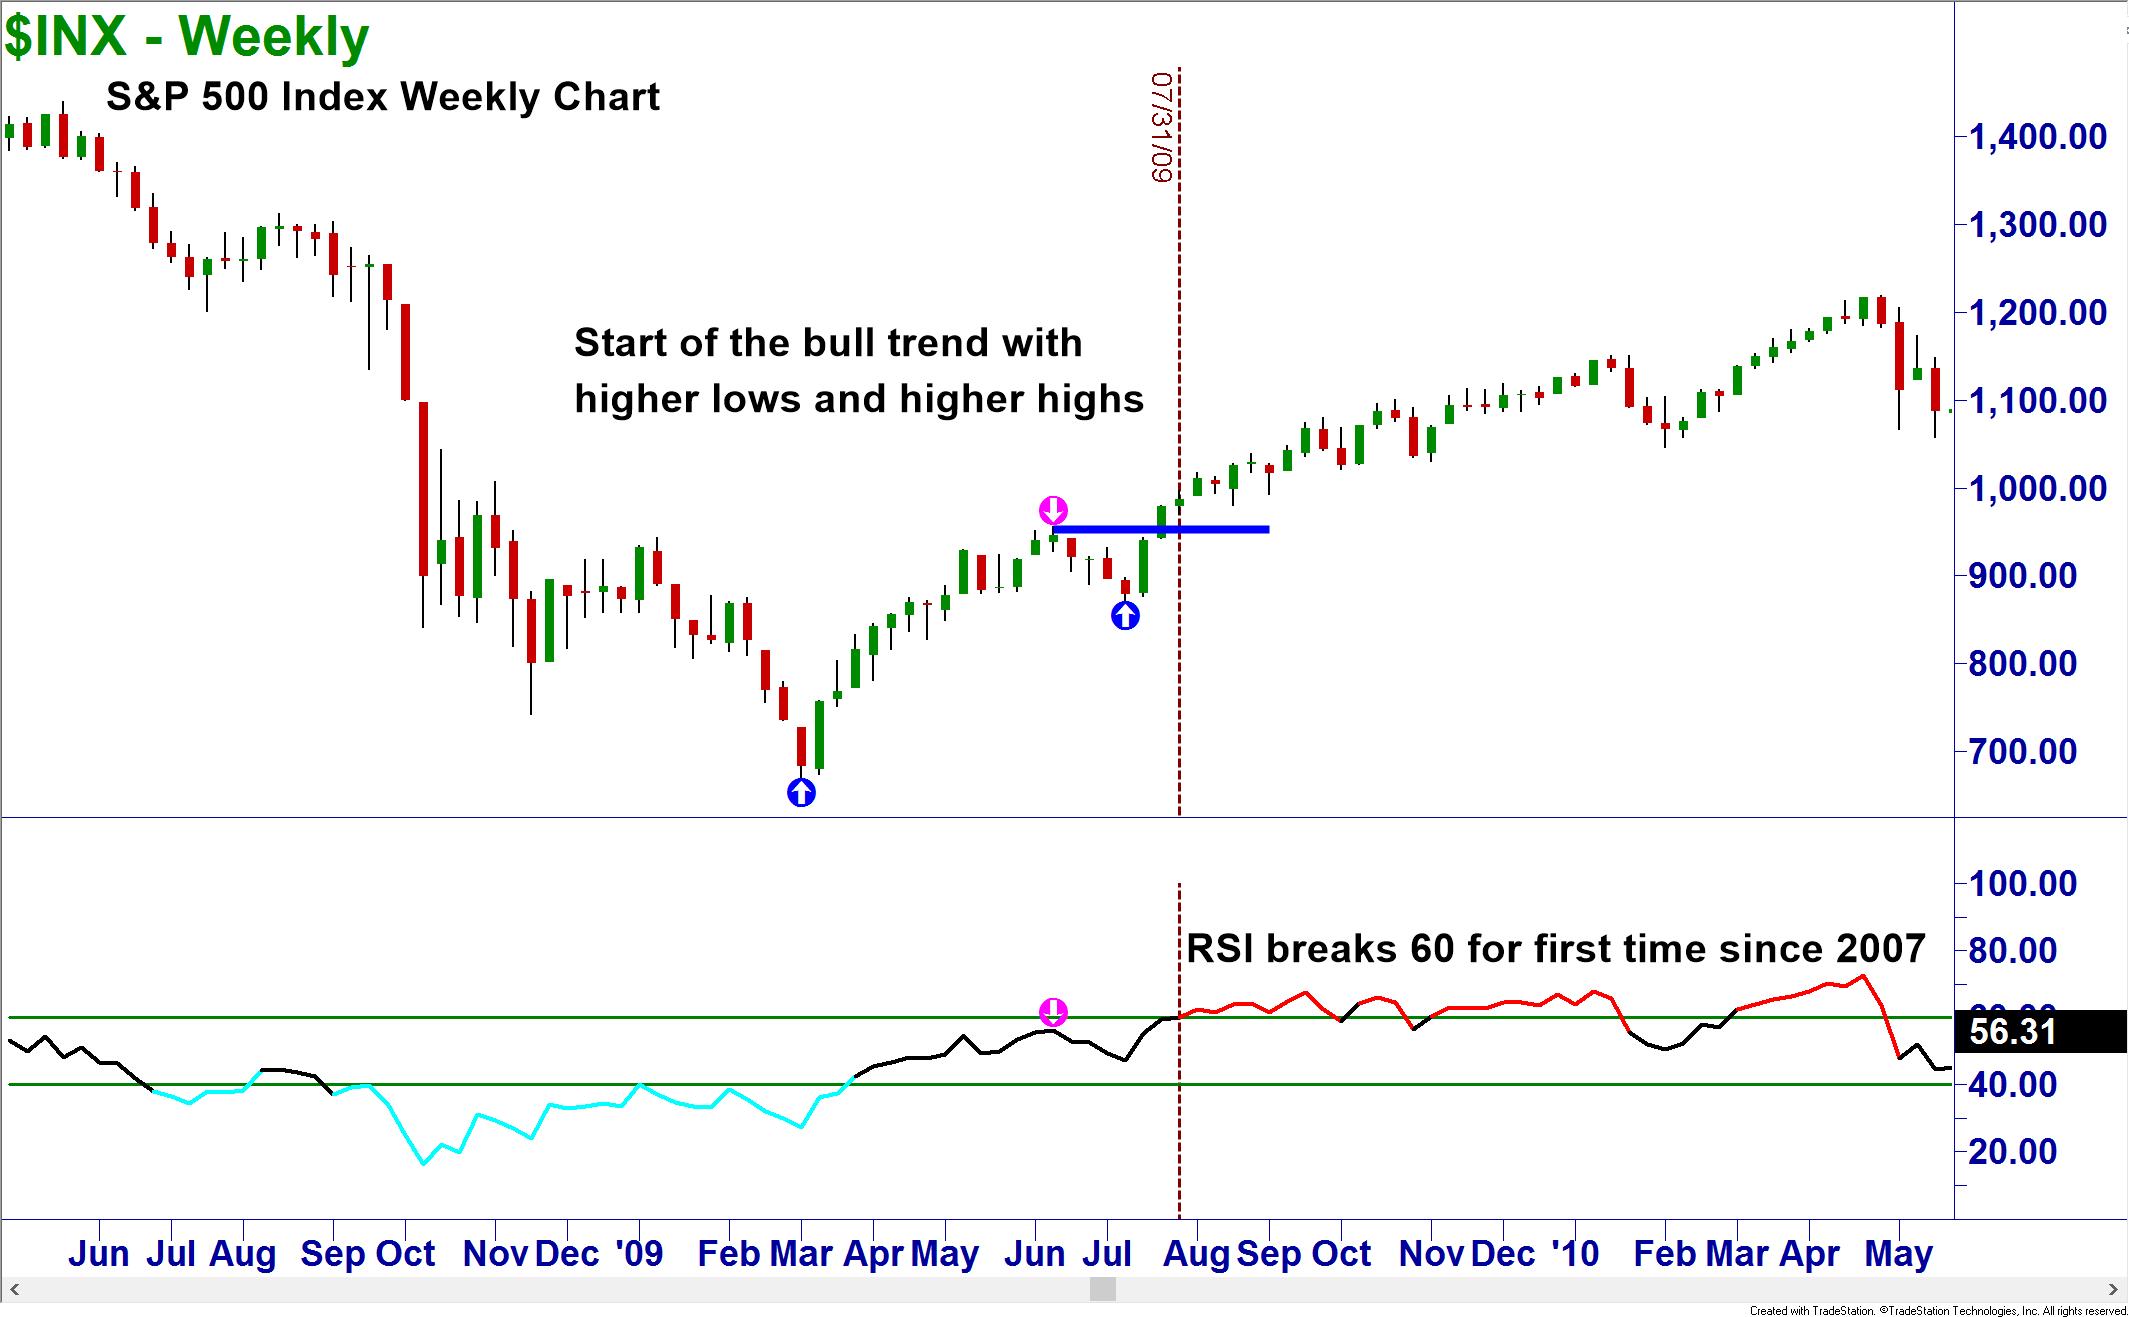
The end of the bear market and start of the bull was ushered in with higher lows and higher highs accompanied by a break above 60 on the RSI.
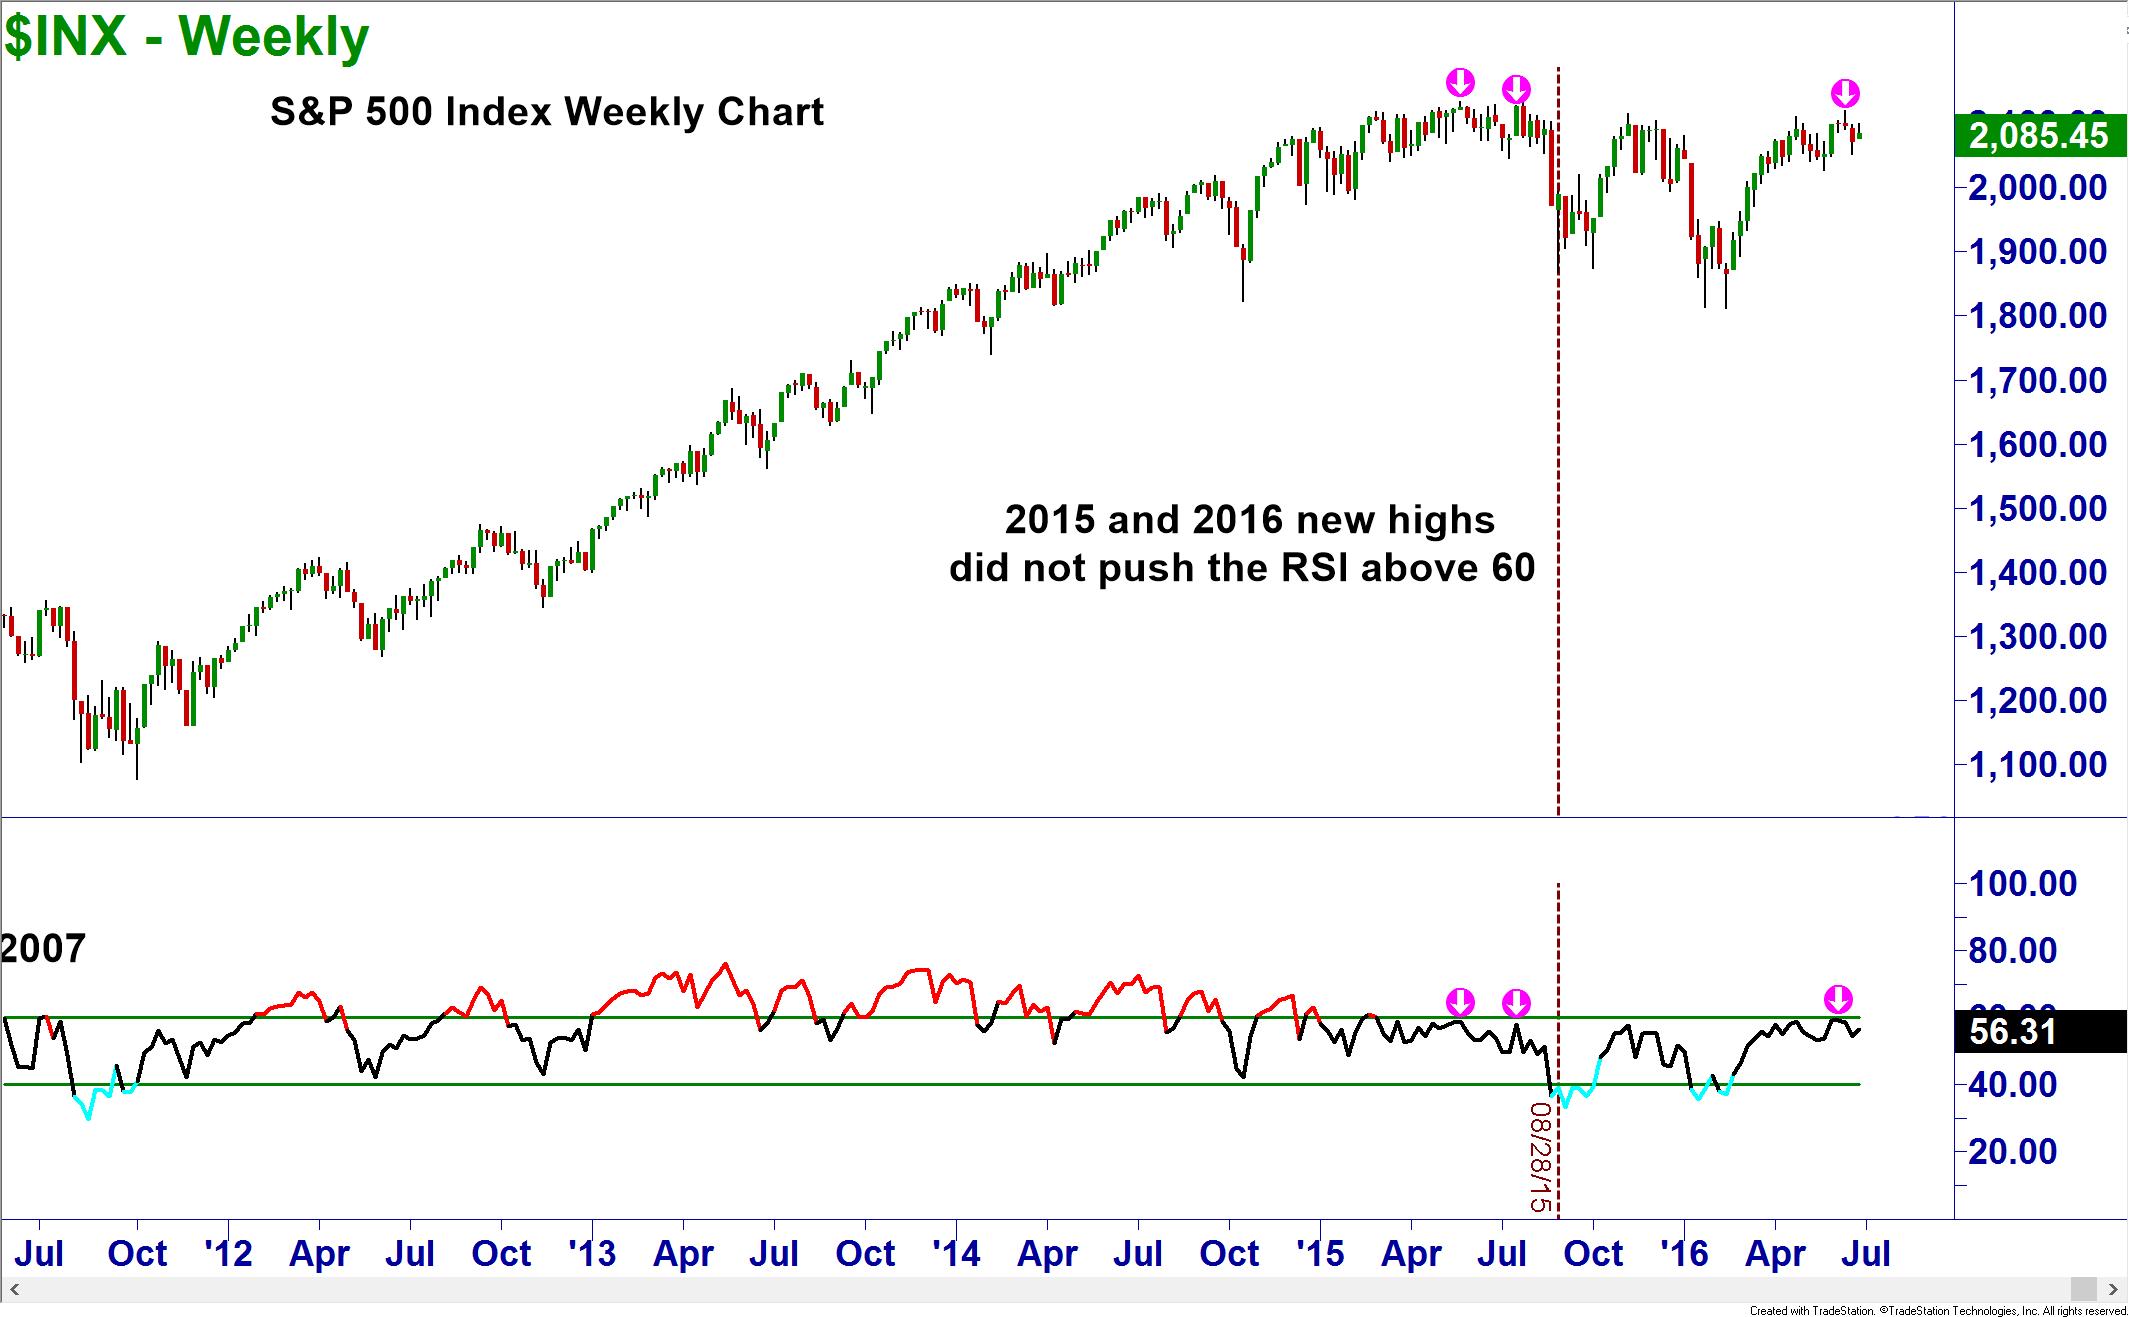
You are probably wondering what the current market looks like. The bull trend was killed off with lower highs and lower lows in 2015. The RSI also broke below 40 and has been unable to get above 60 even though the index itself has made all-time highs. This does not mean we are in a bear trend, but we are not in a bull one either. 2016 has seen the S&P trading in a sideways channel and time will tell which way it will break. The RSI will tell also.
This application of the RSI can be used for any timeframe and any security. I apply it to my intraday charts in futures, forex and stocks as easily as I do for the above weekly charts.
Remember to trade with the trend and use price action for your decisions to enter or exit trades. We can use some indicators to assist our trading but never as the decision maker themselves. In my next article, I will explore the use of this modified RSI as an odds enhancer and filter to decide whether to take or pass on a position.
Neither Freedom Management Partners nor any of its personnel are registered broker-dealers or investment advisers. I will mention that I consider certain securities or positions to be good candidates for the types of strategies we are discussing or illustrating. Because I consider the securities or positions appropriate to the discussion or for illustration purposes does not mean that I am telling you to trade the strategies or securities. Keep in mind that we are not providing you with recommendations or personalized advice about your trading activities. The information we are providing is not tailored to any individual. Any mention of a particular security is not a recommendation to buy, sell, or hold that or any other security or a suggestion that it is suitable for any specific person. Keep in mind that all trading involves a risk of loss, and this will always be the situation, regardless of whether we are discussing strategies that are intended to limit risk. Also, Freedom Management Partners’ personnel are not subject to trading restrictions. I and others at Freedom Management Partners could have a position in a security or initiate a position in a security at any time.
Editors’ Picks

EUR/USD climbs to two-week highs beyond 1.1900
EUR/USD is keeping its foot on the gas at the start of the week, reclaiming the 1.1900 barrier and above on Monday. The US Dollar remains on the back foot, with traders reluctant to step in ahead of Wednesday’s key January jobs report, allowing the pair to extend its upward grind for now.

GBP/USD hits three-day peaks, targets 1.3700
GBP/USD is clocking decent gains at the start of the week, advancing to three-day highs near 1.3670 and building on Friday’s solid performance. The better tone in the British Pound comes on the back of the intense sekk-off in the Greenback and despite re-emerging signs of a fresh government crisis in the UK.

USD/JPY recedes to multi-day lows near 155.50
USD/JPY is pulling back sharply at the start of the week, slipping back toward the 155.50 area as speculation mounts that authorities could step in to rein in further Yen weakness. That narrative gained traction after PM S. Takaichi secured a landslide victory in Sunday’s election, stoking expectations of a tougher line in defence of the domestic currency.
Editors’ Picks
EUR/USD climbs to two-week highs beyond 1.1900
EUR/USD is keeping its foot on the gas at the start of the week, reclaiming the 1.1900 barrier and above on Monday. The US Dollar remains on the back foot, with traders reluctant to step in ahead of Wednesday’s key January jobs report, allowing the pair to extend its upward grind for now.
USD/JPY recedes to multi-day lows near 155.50
USD/JPY is pulling back sharply at the start of the week, slipping back toward the 155.50 area as speculation mounts that authorities could step in to rein in further Yen weakness. That narrative gained traction after PM S. Takaichi secured a landslide victory in Sunday’s election, stoking expectations of a tougher line in defence of the domestic currency.

Gold treads water around $5,000
Gold is trading in an inconclusive fashion around the key $5,000 mark on Monday week. Support is coming from fresh signs of further buying from the PBoC, while expectations that the Fed could turn more dovish, alongside concerns over its independence, keep the demand for the precious metal running.

Crypto Today: Bitcoin steadies around $70,000, Ethereum and XRP remain under pressure
Bitcoin hovers around $70,000, up near 15% from last week's low of $60,000 despite low retail demand. Ethereum delicately holds $2,000 support as weak technicals weigh amid declining futures Open Interest. XRP seeks support above $1.40 after facing rejection at $1.54 during the previous week's sharp rebound.

Japanese PM Takaichi nabs unprecedented victory – US data eyed this week
I do not think I would be exaggerating to say that Japanese Prime Minister Sanae Takaichi’s snap general election gamble paid off over the weekend – and then some. This secured the Liberal Democratic Party (LDP) an unprecedented mandate just three months into her tenure.
RECOMMENDED LESSONS
Making money in forex is easy if you know how the bankers trade!
I’m often mystified in my educational forex articles why so many traders struggle to make consistent money out of forex trading. The answer has more to do with what they don’t know than what they do know. After working in investment banks for 20 years many of which were as a Chief trader its second knowledge how to extract cash out of the market.
5 Forex News Events You Need To Know
In the fast moving world of currency markets where huge moves can seemingly come from nowhere, it is extremely important for new traders to learn about the various economic indicators and forex news events and releases that shape the markets. Indeed, quickly getting a handle on which data to look out for, what it means, and how to trade it can see new traders quickly become far more profitable and sets up the road to long term success.
Top 10 Chart Patterns Every Trader Should Know
Chart patterns are one of the most effective trading tools for a trader. They are pure price-action, and form on the basis of underlying buying and selling pressure. Chart patterns have a proven track-record, and traders use them to identify continuation or reversal signals, to open positions and identify price targets.
7 Ways to Avoid Forex Scams
The forex industry is recently seeing more and more scams. Here are 7 ways to avoid losing your money in such scams: Forex scams are becoming frequent. Michael Greenberg reports on luxurious expenses, including a submarine bought from the money taken from forex traders. Here’s another report of a forex fraud. So, how can we avoid falling in such forex scams?
What Are the 10 Fatal Mistakes Traders Make
Trading is exciting. Trading is hard. Trading is extremely hard. Some say that it takes more than 10,000 hours to master. Others believe that trading is the way to quick riches. They might be both wrong. What is important to know that no matter how experienced you are, mistakes will be part of the trading process.
The challenge: Timing the market and trader psychology
Successful trading often comes down to timing – entering and exiting trades at the right moments. Yet timing the market is notoriously difficult, largely because human psychology can derail even the best plans. Two powerful emotions in particular – fear and greed – tend to drive trading decisions off course.