Reading into the Data: How Derivative Market Helps Reading into the Market Expectations

Expectations are the forces that drive financial markets. Investors build their positions and strategies based on expectations, projections and views. For anyone who wants to know what the general consensus of the market, finding would have been extremely difficult in the absence of financial instruments, such as derivatives.
Current asset price reflects the momentary equilibrium (i.e., the price where the supply meets the demand and vice versa). However, if we want to know the expectations with regards to the medium/long-term future, we need to turn to the derivatives market.
The derivatives market is used by different market participants to express views (or to hedge) future exposures (as discussed in our last article “Not What You Have Been Taught: Why Capital Market is Not a Zero Sum Game”). For that reason, if one wants to assess the general consensus regarding a certain asset, in most cases the answer will be found in the price.
The derivatives market can be divided into three main instrument types:
1. Futures/Forwards – the Futures/Forwards reflect the future price of assets, taking into account the cost of carry (interest rate differentials/dividends/storage costs for commodities)
2. Swaps – Mostly used for interest rate yield curve. Reflects the market expectations regarding the monetary policy (rate hike probability), inflation path and credit risk (the risk of companies’ default)
3. Options – Options’ prices reflect both the expected volatility of the underlying asset and the spot distribution density for the specific maturity (for example 3-month time)
In our view, Options are, by far, the most interesting instruments for analysis of the market expectations, as they are widely available for the liquid assets and provide a reliable gauge.
Let’s review the following example:
GBP/USD Spot = 1.33
3-month implied volatility = 10%
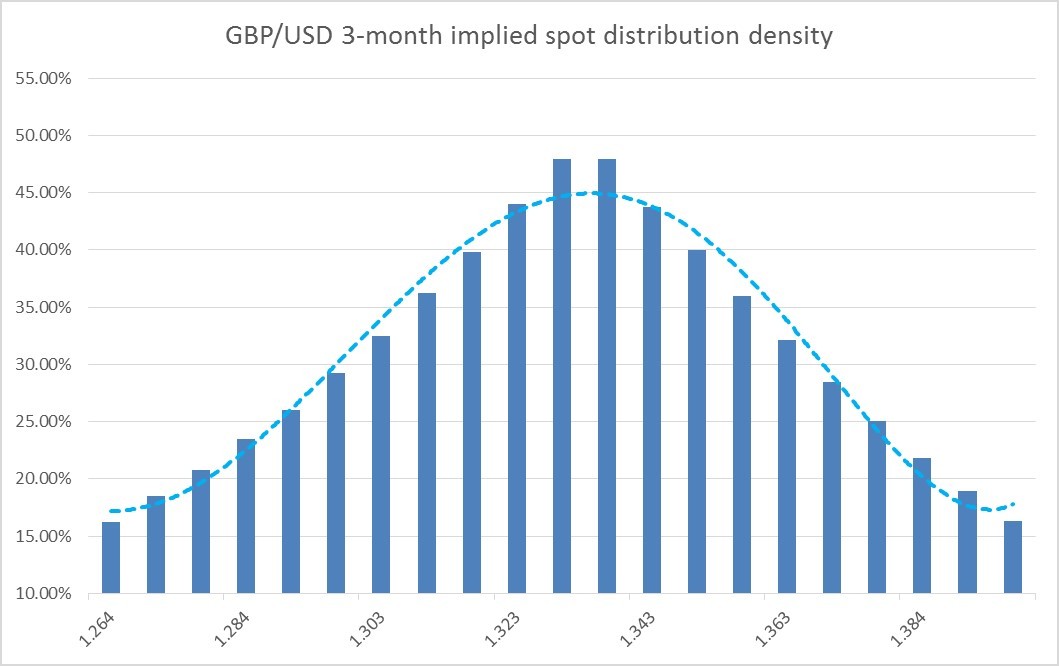
As we can see in the chart above, the market expectation, based on the option market pricing, is that the GBP/USD will stay within the 1.3030-1.3630 range for the next 3-months (that range equals to 1 standard deviation around the current forward price).
Once the market participants digest new development, that expectation can change and is subjected to the supply/demand of the different participants. Some investors might look to hedge themselves of the large move of the GBP/USD (or to speculate that it will move), and therefore will go and buy options to express that view. The demand for options will cause the options price to rise, and therefore imply a wider distribution density. If investors think that the upcoming period is going to exhibit low volatility (i.e. calmer price action), they will express their view by selling options, and therefore the implied distribution will become narrower.
As we can see, there is ongoing feedback between the market expectations and the derivatives prices. This is why the derivatives market is where analysts, investors and policy makers would be able to read into the market expectations. Even though policy makers (Central Bankers) will not relay their decision on the market expectations (meaning that they will not try to meet the market expectation), they use it to assess their communication with the market (and to assess how their forward guidance is perceived by investors).
How to capitalize the knowledge of the implied market expectations:
1. Once we establish our views (or expectations), we can analyze whether our views meet the market expectations
2. If our views deviate significantly from the market expectations, we can use derivatives (options, futures) to leverage our views and put a position which expresses our views for a relatively cheap price (as our views are perceived as views that have a low probability of ending “in-the-money”)
3. We should try and “leg in” into a position and not allocate our full investment all at once. As we usually place contrarian positions to what the market expects, it is possible that the divergence between our view and the market’s view can grow further before it reverts
Good Luck.
Author

EzTrader Market Analysis Team
EzTrader
EZTRADER is a Binary Option Platform that offers a wide range of binary options on different asset classes. EZTRADER is regulated by most European regulators (including the UK FCA, and Germany BaFin)


