![]() Russ Allen
Russ Allen
Online Trading Academy
Today we’ll look at a strategy used by many conservative investors – the cash-secured short put.
Example Cash Secured Put Trade
In the chart below you can see that following a sudden drop, IWM was near a price level from which it had previously rallied strongly. We thought IWM would be a good buy at around $145 to $146.
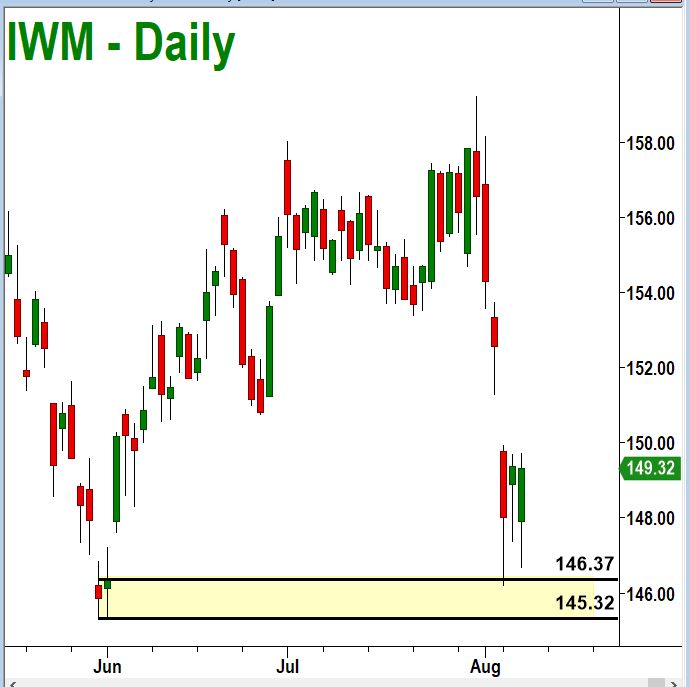
On that day, put options expiring in three weeks could be sold for $2.07 per share, which is $207 per option contract. The person to whom we sold the put would be paying us $207 in exchange for our taking on the obligation to buy the IWM shares from them for $146 per share if they ordered us to. We were happy to take on this obligation, because we wanted to buy the IWM shares for around $146 anyway. Why not let someone pay us to be willing to do something we wanted to do?
How did this trade stack up in terms of return on investment (ROI)?
Calculating Return on Investment for Cash Secured Puts
The ROI can be calculated in a very similar way to the method used for covered calls.
The Return part of the ROI is the $207 received for selling the put option. In any option trade like this one, where you initiate the trade by selling an option short, your maximum return is the money received for the sale. This money is deposited into your brokerage account immediately when you sell the option.
The Investment part of the ROI calculation is the amount of money you must have on deposit in order to make the trade. In this case, that was $146 per share, or $14,600 total. As we sent the order to sell the put, our broker would check to see if we had this much free cash in our account. If so, then the trade would be allowed to go through. The $14,600 that we might have to pay for the stock was then frozen in our account.
If IWM did not drop below $146 in the three weeks, before the option expiration, then the person who bought the put would have no reason to exercise it. Why sell us the stock for $146 when they could sell it in the open market for more than that? In that case, the option would be allowed to expire. When it did, the $14,600 that had been frozen in our account would be unfrozen and available for another trade. Our profit would be $207 on an investment of $14,600, or 1.42%. This was over a period of 22 days. Annualizing this return, we get 1.42% X 365 days per year / 22 days in the actual trade = 23.5% annualized. This 23.5% would be our Return if Not Assigned.
Note that this is not the only possible outcome. If IWM was below $146 when the options expired, then the put option would be exercised. In that event, our broker would take that $14,600 in cash from our account and put in 100 shares of IWM. Our cost per share would be $146 less the $2.07 we had earlier received (which we had all along). This would be $143.93 per share. This amount would be our cost, and therefore our break-even point. Our actual return in this case would depend on exactly at what price IWM was trading at the expiration date. If it was trading anywhere above our breakeven price of $143.93, then we would have a profit. Otherwise we would have a loss.
Even if we did end up sustaining a loss, it would be a smaller loss than we would have had if we had simply bought IWM when it reached our entry point of $146. Remember, our cost was less than this by the amount received for the put – we had acquired IWM at a discounted price.
Below is the model for the calculation of ROI on a cash-secured short put trade.
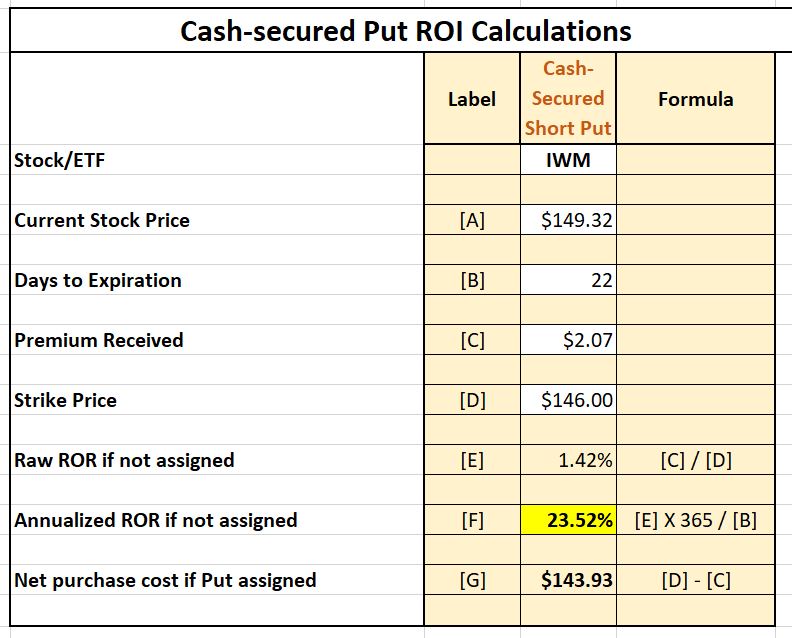
Using this model, you can easily evaluate any short put trade opportunity. For long-term investors, selling cash-secured short puts is an effective way to acquire stocks at a discount.
Read the original article here - Option Profit Calculations – Cash Secured Puts
This content is intended to provide educational information only. This information should not be construed as individual or customized legal, tax, financial or investment services. As each individual's situation is unique, a qualified professional should be consulted before making legal, tax, financial and investment decisions. The educational information provided in this article does not comprise any course or a part of any course that may be used as an educational credit for any certification purpose and will not prepare any User to be accredited for any licenses in any industry and will not prepare any User to get a job. Reproduced by permission from OTAcademy.com click here for Terms of Use: https://www.otacademy.com/about/terms
Editors’ Picks

EUR/USD struggles near 1.1850, with all eyes on US CPI data
EUR/USD holds losses while keeping its range near 1.1850 in European trading on Friday. A broadly cautious market environment paired with a steady US Dollar undermines the pair ahead of the critical US CPI data. Meanwhile, the Eurozone Q4 GDP second estimate has little to no impact on the Euro.

GBP/USD recovers above 1.3600, awaits US CPI for fresh impetus
GBP/USD recovers some ground above 1.3600 in the European session on Friday, though it lacks bullish conviction. The US Dollar remains supported amid a softer risk tone and ahead of the US consumer inflation figures due later in the NA session on Friday.

USD/JPY rebounds above 153.00 ahead of US inflation data
USD/JPY stages a comeback and regains 153.00 in the Asian session, snapping a four-day losing streak amid some repositioning ahead of the US CPI report. However, expectations that Japan's PM Sanae Takaichi could be more fiscally responsible, along with bets that the BoJ will stick to its policy normalization path and the risk-off mood, could support the safe-haven Japanese Yen, capping the pair's upside.
Editors’ Picks
EUR/USD struggles near 1.1850, with all eyes on US CPI data
EUR/USD holds losses while keeping its range near 1.1850 in European trading on Friday. A broadly cautious market environment paired with a steady US Dollar undermines the pair ahead of the critical US CPI data. Meanwhile, the Eurozone Q4 GDP second estimate has little to no impact on the Euro.
GBP/USD recovers above 1.3600, awaits US CPI for fresh impetus
GBP/USD recovers some ground above 1.3600 in the European session on Friday, though it lacks bullish conviction. The US Dollar remains supported amid a softer risk tone and ahead of the US consumer inflation figures due later in the NA session on Friday.

Gold remains below $5,000 as US inflation report looms
Gold retreats from the vicinity of the $5,000 psychological mark, though sticks to its modest intraday gains in the European session. Traders now look forward to the release of the US consumer inflation figures for more cues about the Fed policy path. The outlook will play a key role in influencing the near-term US Dollar price dynamics and provide some meaningful impetus to the non-yielding bullion.

US CPI data set to show modest inflation cooling as markets price in a more hawkish Fed
The US Bureau of Labor Statistics will publish January’s Consumer Price Index data on Friday, delayed by the brief and partial United States government shutdown. The report is expected to show that inflationary pressures eased modestly but also remained above the Federal Reserve’s 2% target.

A tale of two labour markets: Headline strength masks underlying weakness
Undoubtedly, yesterday’s delayed US January jobs report delivered a strong headline – one that surpassed most estimates. However, optimism quickly faded amid sobering benchmark revisions.
RECOMMENDED LESSONS
Making money in forex is easy if you know how the bankers trade!
I’m often mystified in my educational forex articles why so many traders struggle to make consistent money out of forex trading. The answer has more to do with what they don’t know than what they do know. After working in investment banks for 20 years many of which were as a Chief trader its second knowledge how to extract cash out of the market.
5 Forex News Events You Need To Know
In the fast moving world of currency markets where huge moves can seemingly come from nowhere, it is extremely important for new traders to learn about the various economic indicators and forex news events and releases that shape the markets. Indeed, quickly getting a handle on which data to look out for, what it means, and how to trade it can see new traders quickly become far more profitable and sets up the road to long term success.
Top 10 Chart Patterns Every Trader Should Know
Chart patterns are one of the most effective trading tools for a trader. They are pure price-action, and form on the basis of underlying buying and selling pressure. Chart patterns have a proven track-record, and traders use them to identify continuation or reversal signals, to open positions and identify price targets.
7 Ways to Avoid Forex Scams
The forex industry is recently seeing more and more scams. Here are 7 ways to avoid losing your money in such scams: Forex scams are becoming frequent. Michael Greenberg reports on luxurious expenses, including a submarine bought from the money taken from forex traders. Here’s another report of a forex fraud. So, how can we avoid falling in such forex scams?
What Are the 10 Fatal Mistakes Traders Make
Trading is exciting. Trading is hard. Trading is extremely hard. Some say that it takes more than 10,000 hours to master. Others believe that trading is the way to quick riches. They might be both wrong. What is important to know that no matter how experienced you are, mistakes will be part of the trading process.
The challenge: Timing the market and trader psychology
Successful trading often comes down to timing – entering and exiting trades at the right moments. Yet timing the market is notoriously difficult, largely because human psychology can derail even the best plans. Two powerful emotions in particular – fear and greed – tend to drive trading decisions off course.