Learning To Make The Trade
New traders often get confused when deciding what tools to use in order to analyze the markets and select trading opportunities. Looking at the selections available as well as the tools offered in today’s advanced trading software, it is easy for one to become overwhelmed. Fortunately, there is a simple and logistical way to sort through the market ebbs and flows and identify the highest probability, lowest risk trading opportunities.
When we are planning to trade, we need to start from the top. It does not matter if you are holding for 10 minutes, 10 days, or 10 weeks. The broad markets always have influence over the stocks making up their components. I have seen this hold true for markets in the U.S., India, London, Dubai, and Singapore. We need to establish the trend and potential turning points (supply & demand), of the broad market before we look to our individual stocks. Most stocks will move further and faster with the market’s trend than when they are fighting it. Of course, there are always exceptions. However, even when the stock is trending opposite of the market, they will often reach supply and/or demand at nearly the same time.
Once we know what the market is likely to do during the timeframe we are trading, it is important to look at the stock to find the current trend. We want to know the direction of the trend, the strength of the trend, and the possible turning points in that trend (again supply and demand). By looking at the price and volume, a trader gains most of the knowledge they need to trade without the added use of any indicators. You can ascertain the trend direction and strength by observing the color, size, and shape of the candles themselves with volume as a supporting indicator. Looking at the past price action, a trader can also see the most probable turning points or entry and exit targets from supply and demand.
For those of you who are not familiar or comfortable with reading price and volume, I suggest you visit your local Online Trading Academy center and take one of our courses that will give you this knowledge. For added information regarding strength of the trend and confirming weakness at turning points, you can use a momentum indicator such as ADX or MACD. Even multiple moving averages offer a clue to a trader looking to determine trend strength. Just remember that you need to rely on price itself to make your entries and exits. Relying on the indicators makes you late as they are all lagging in their movement and signals.
When looking at the possible turning points of price, we can also look at the condition of oscillators like Stochastics, RCI, CCI and others. You have to use them in the correct manner however. Trying to take all buy and sell signals given by them will not only make your crazy, it will also drain your account. They are to be used to confirm decisions made on price action. Stocks will remain overbought or oversold for a long time in a strong trend. What you need to look for are clues that there is a change in sentiment and price action at a previously identified supply or demand zone.
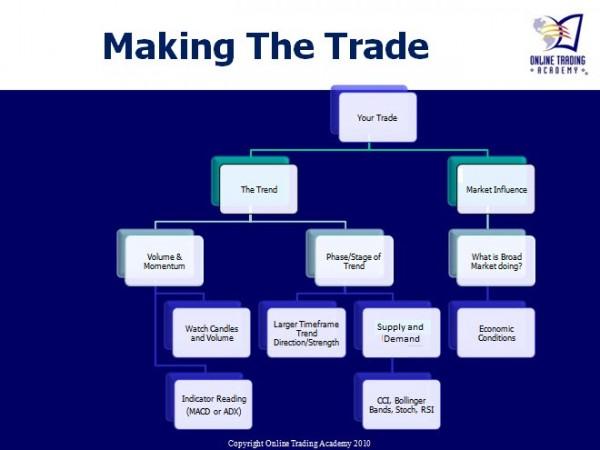
Overall, your trading decisions need to be centered on identifying trends and supply and demand zones of the broad market and your stock. The technical indicators are decision support tools and may not even be necessary once you become adept at reading price.
Author

Brandon Wendell, CMT
Brandon Wendell
Brandon started off in the industry as a retail stockbroker working the phones. With a thirst to learn more about market mechanics, he moved into back-office operations handling order flow as an Agency Desk Operator for a major brokerage.


