Those of you who trade the equity index ETF’s or even futures markets most likely know the frustration of having prices move within a penny of your supply or demand zone only to see them retreat without you being able to enter or exit your trade. So, what causes this failure of price touching the zones or worse, makes prices just barely break a zone and trigger your stop before moving in your favor? The leader can.

There are three major equity market indexes: the Dow, the NASDAQ and the S&P 500. Throughout the day and even in longer term multi-day moves, these indexes should move in unison. They usually rise and fall together. However, since they are not comprised of the same stocks one or more of the indexes may move faster in the trend direction than the others.

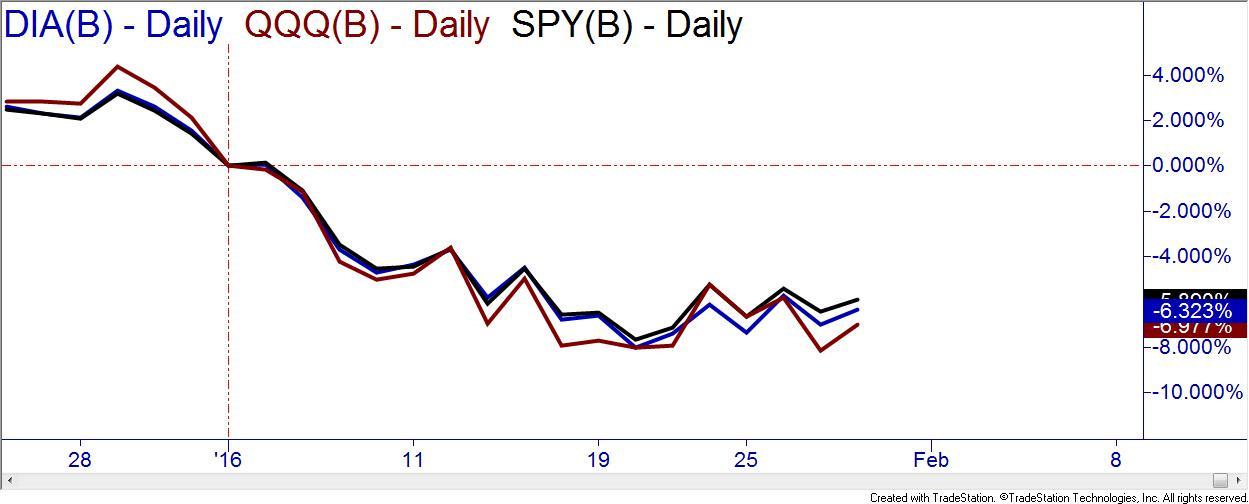
Take the current year drop in the indexes. Looking at the following chart, you can see that QQQ, (the NASDAQ 100 ETF), is down more than the SPY (S&P 500 index ETF) and the DIA (Dow index ETF). This means that QQQ is the leader of the downward price trend and is likely to signal trend changes when it hits demand. The DIA and SPY could stop shy of their demand zones or even pierce them before the QQQ signals reversal.

Stocks

This knowledge is also helpful for traders and investors who are working with individual stocks. Those of you who have attended Online Trading Academy’s Professional Trader Course know that we always have a chart of the S&P 500 or NASDAQ to view in addition to our stock chart in the class. On average, 50-60% of a stock’s movement will be directly related to the movement and trend of the broad market. 30-40% of the stock’s movement will be influenced by the sector of that stock. That leaves only 10% of influence from the company itself. Knowing which index is the leader and when it is possibly changing direction is an edge you need when making decisions on your stock.

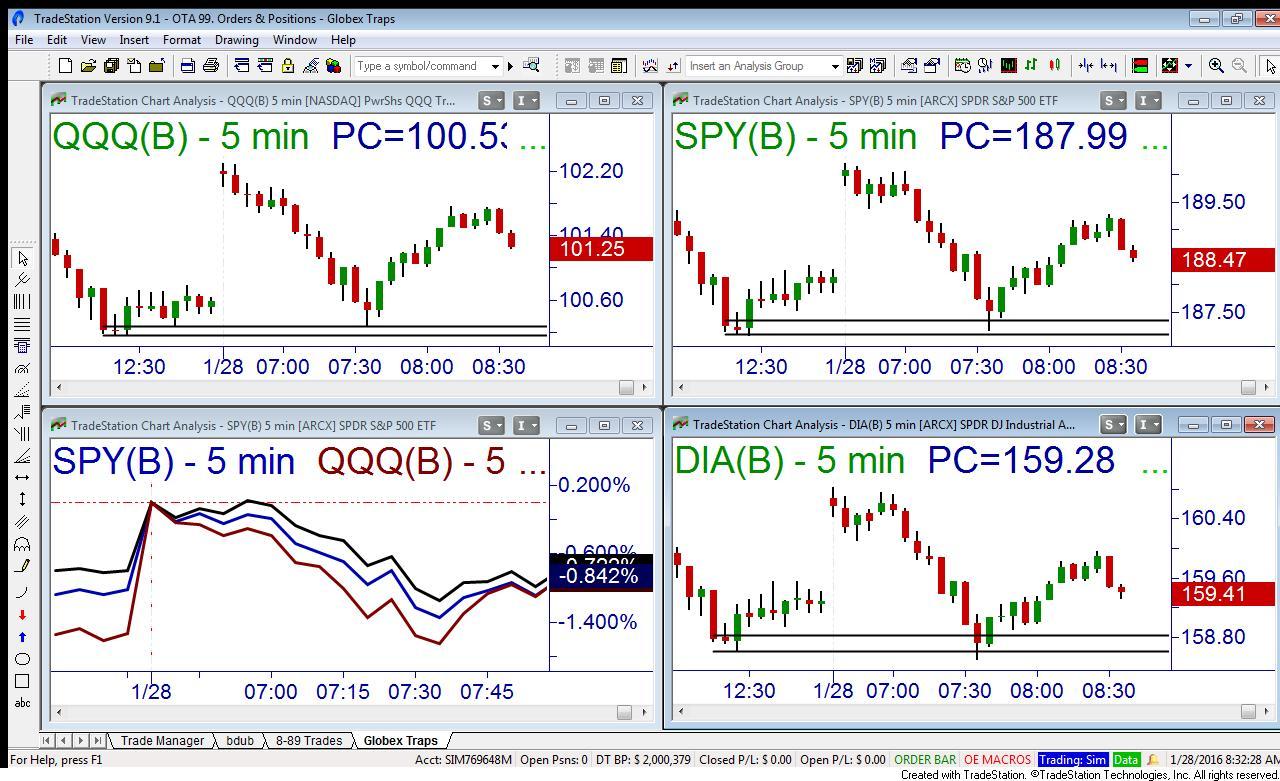
TradeStation’s software allows me to chart the four indexes in one chart. This is something I have used extensively in the XLT programs to identify market trend and potential confirmation at supply and demand levels. I use the “Percent Change” feature to compare all three indexes and easily identify the leader in the dominant trend. I like to use the ETF’s: SPY, QQQ, DIA and can even add IWM to represent all of the indexes. You could easily substitute the indexes themselves or even the futures contracts. Since the futures are listed on different exchanges, you will have to adjust your chart to local time instead of “Exchange” time for them to overlay. You can see the completed chart example below.

Stocks

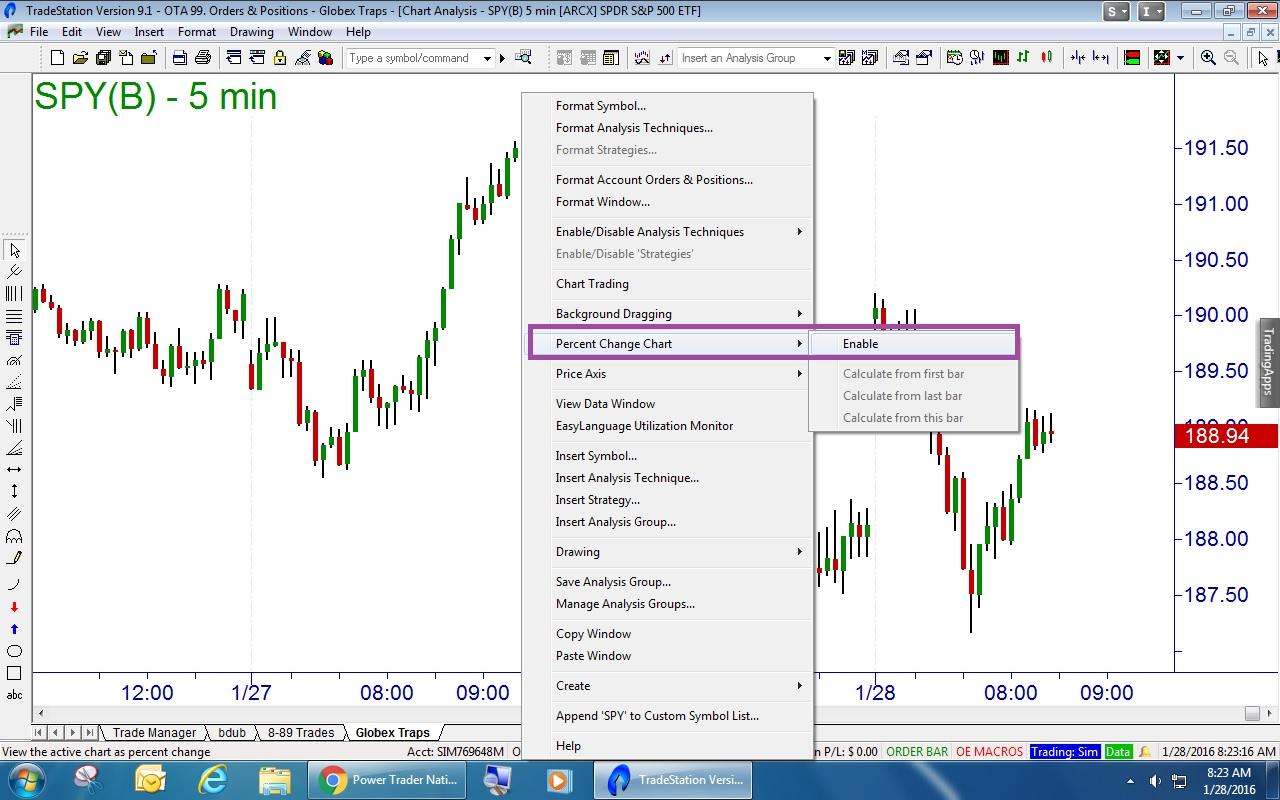
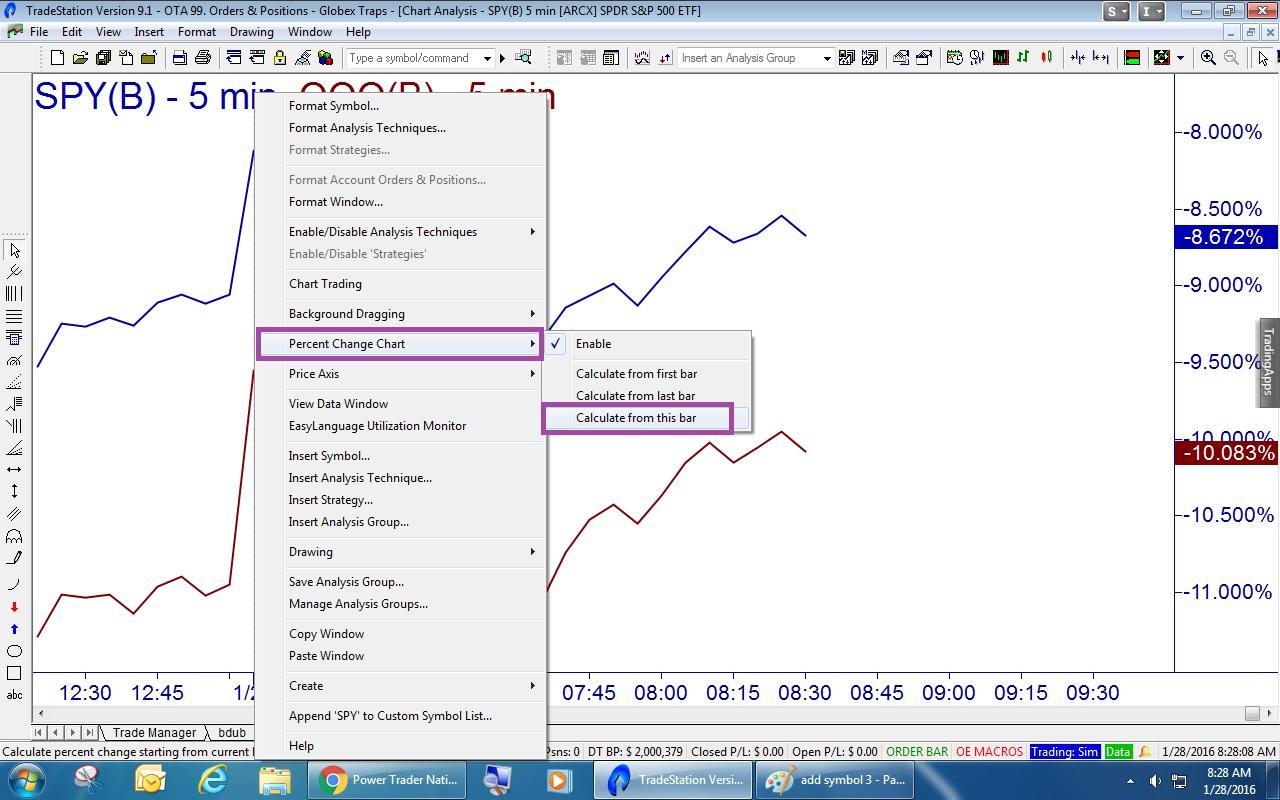
You will need to begin with a chart of one of the ETF’s. Right click on any open space on the chart and select “Percent Change Chart.” Then “Enable” the chart.

Stocks

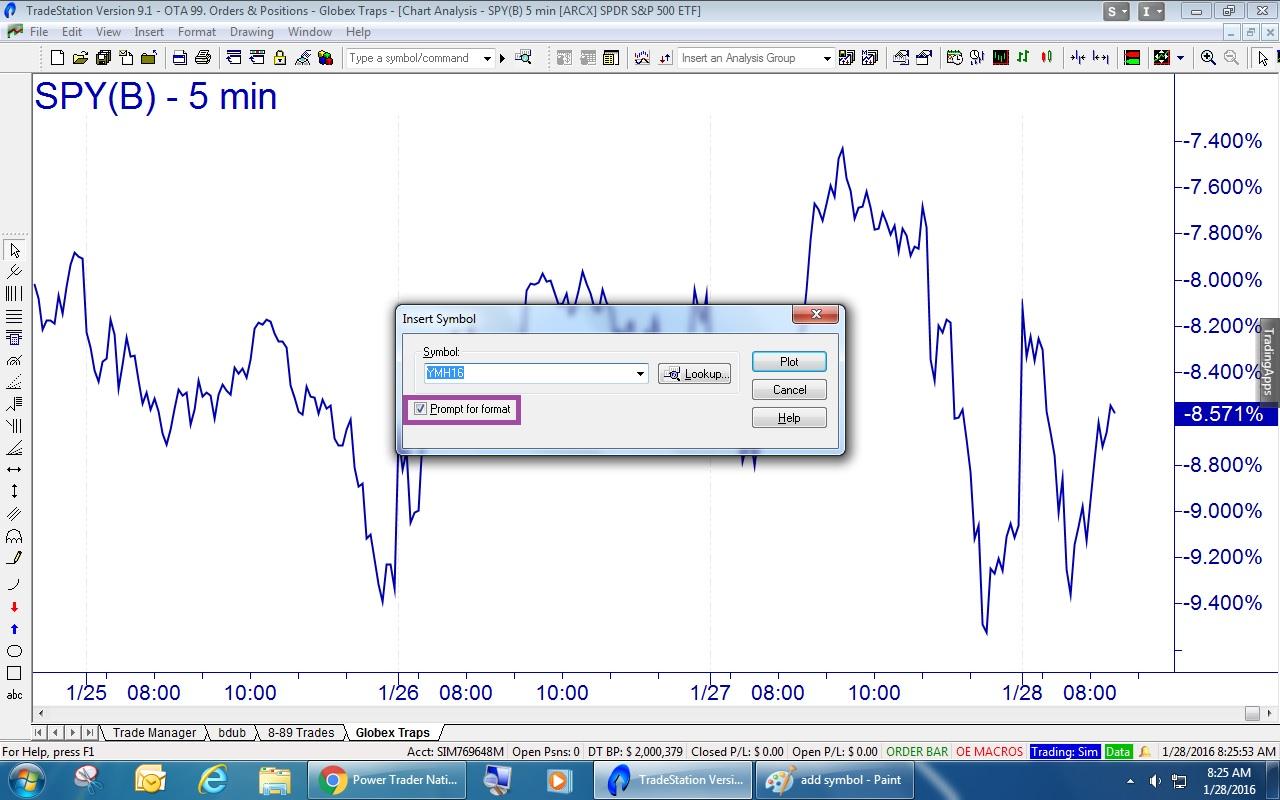
Then one by one you will need to add the additional securities. Right mouse click on your chart and select “Insert Symbol.”

Stocks

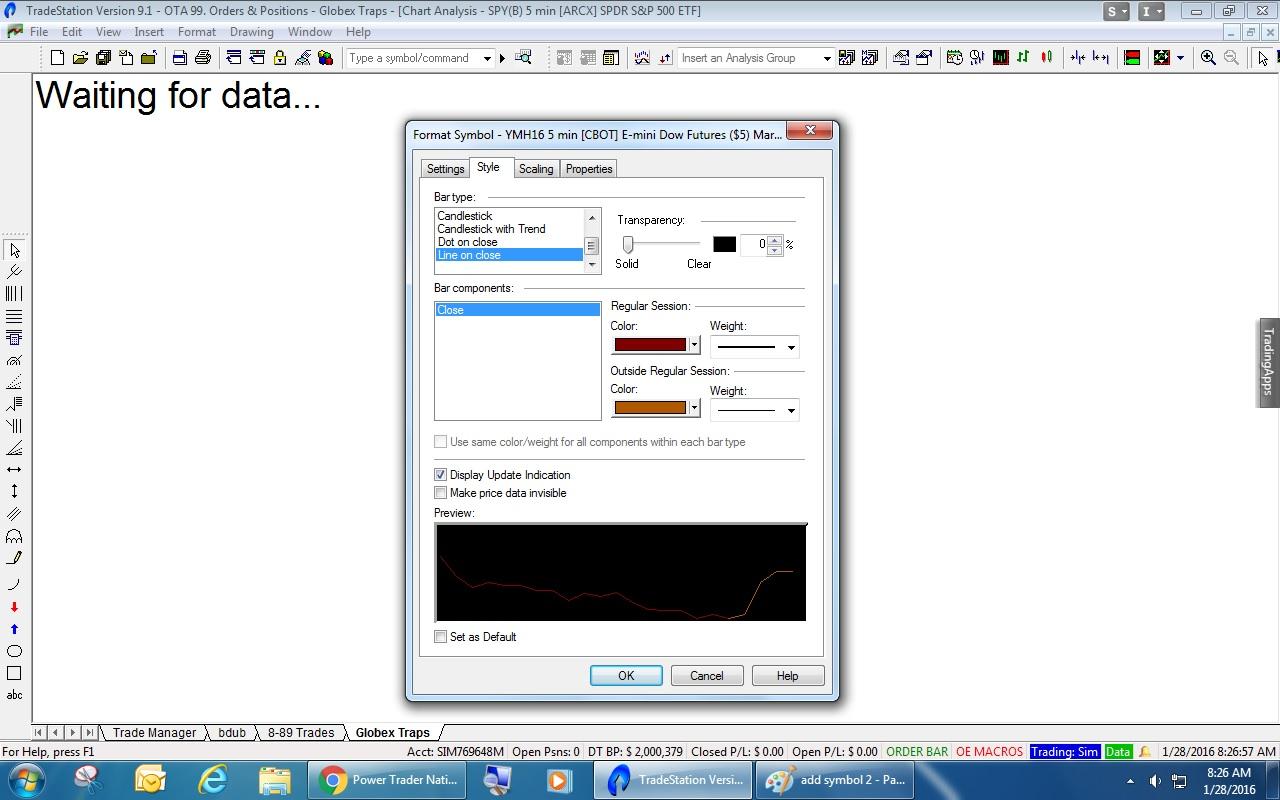
Type in the symbol you want to add but make sure that “Prompt for Format” is selected before pressing “Plot.”

Stocks

Now you can change the color and thickness of the new symbol’s chart.

Stocks

You will repeat the process for each symbol you wish to add to your charts. Once you have the symbols added, you need to start or “zero” the study at a certain point. In the case of daily charts, you can start from a major high or low that started the current trend. For intraday charts, you can use the opening candle of the day. You will need to right click your mouse on the time that you want your comparison to begin. You then select “Percentage Change” as you did before. This time you will select “Calculate from this bar” to start the study there.

Stocks

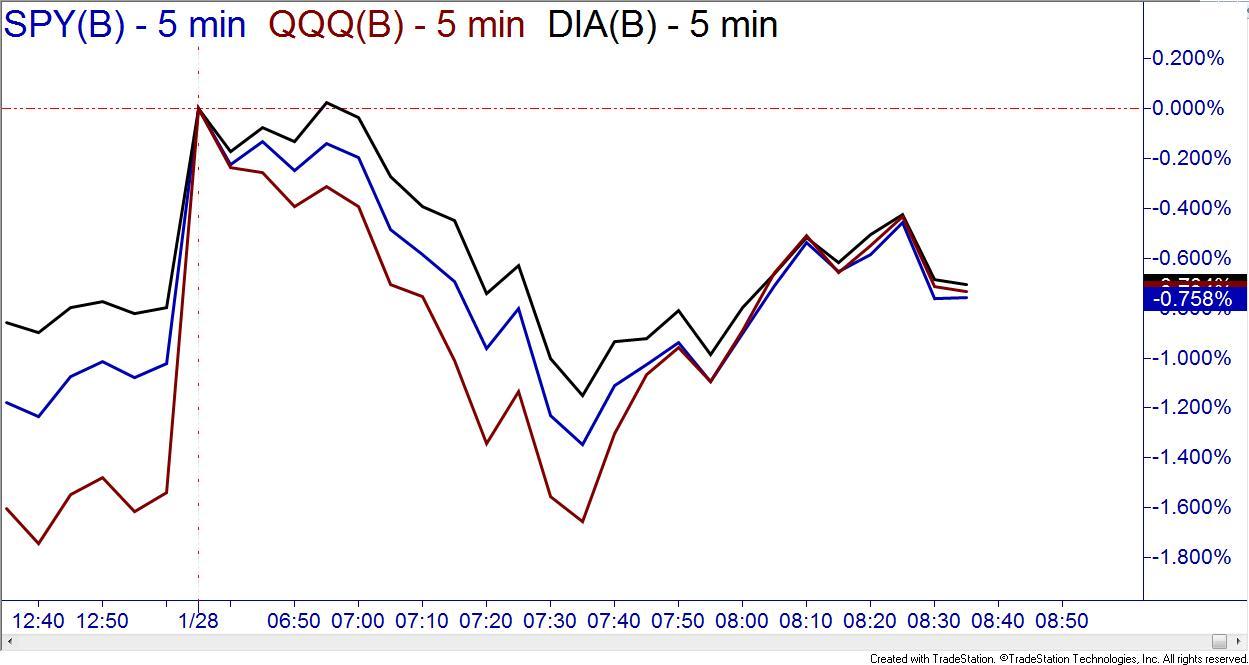
As you can see from the following example, QQQ was the leader to the downside. Prices reversed when QQQ hit its demand. SPY also happened to be at demand at that time but DIA had slightly broken its demand as it waited for QQQ to tell it when to reverse.

Stocks

This can be a handy odds enhancer while trading the markets and has helped many over the years. To learn more odds enhancers and the Core Strategy, come visit your local Online Trading Academy center today.

Learn to Trade Now


This content is intended to provide educational information only. This information should not be construed as individual or customized legal, tax, financial or investment services. As each individual's situation is unique, a qualified professional should be consulted before making legal, tax, financial and investment decisions. The educational information provided in this article does not comprise any course or a part of any course that may be used as an educational credit for any certification purpose and will not prepare any User to be accredited for any licenses in any industry and will not prepare any User to get a job. Reproduced by permission from OTAcademy.com click here for Terms of Use: https://www.otacademy.com/about/terms

Editors’ Picks

EUR/USD: US Dollar to remain pressured until uncertainty fog dissipates

EUR/USD: US Dollar to remain pressured until uncertainty fog dissipates

Unimpressive European Central Bank left monetary policy unchanged for the fifth consecutive meeting. The United States first-tier employment and inflation data is scheduled for the second week of February. EUR/USD battles to remain afloat above 1.1800, sellers moving to the sidelines.

GBP/USD softens to near 1.3600 as BoE hints further rate cuts

GBP/USD softens to near 1.3600 as BoE hints further rate cuts

The GBP/USD pair loses ground to near 1.3610 during the early Asian session on Monday. The Pound Sterling softens against the Greenback amid growing expectations of the Bank of England’s interest-rate cut. Traders will take more cues from the Fedspeak later on Monday.

USD/JPY drops back below 157.00 on Japan's verbal intervention

USD/JPY drops back below 157.00 on Japan's verbal intervention

USD/JPY has come under moderate selling pressure below 157.00 in the Asian session on Monday. The Japanese Yen lost ground to near 157.70 following Japan’s ruling Liberal Democratic Party's outright majority win in Sunday’s lower house election, opening the door to more fiscal stimulus by Prime Minister Sanae Takaichi. However, JPY buyers jumped back and dragged the pair southward on FX verbal intervention by Japan’s Finance Minister Katayama.


Editors’ Picks

USD/JPY drops back below 157.00 on Japan's verbal intervention

USD/JPY drops back below 157.00 on Japan's verbal intervention

USD/JPY has come under moderate selling pressure below 157.00 in the Asian session on Monday. The Japanese Yen lost ground to near 157.70 following Japan’s ruling Liberal Democratic Party's outright majority win in Sunday’s lower house election, opening the door to more fiscal stimulus by Prime Minister Sanae Takaichi. However, JPY buyers jumped back and dragged the pair southward on FX verbal intervention by Japan’s Finance Minister Katayama.

Gold eyes acceptance above $5,000, kicking off a big week

Gold eyes acceptance above $5,000, kicking off a big week

Gold is consolidating the latest uptick at around the $5,000 mark, with buyers gathering pace for a sustained uptrend as a critical week kicks off. All eyes remain on the delayed Nonfarm Payrolls and Consumer Price Index data from the United States due on Wednesday and Friday, respectively.

AUD/USD: Buyers eyes 0.7050 amid upbeat mood

AUD/USD: Buyers eyes 0.7050 amid upbeat mood

AUD/USD builds on Friday's goodish rebound from sub-0.6900 levels and kicks off the new week on a positive note, with bulls awaiting a sustained move and acceptance above mid-0.7000s before placing fresh bets. The widening RBA-Fed divergence, along with the upbeat market mood, acts as a tailwind for the risk-sensitive Aussie amid some follow-through US Dollar selling for the second straight day.

Top Crypto Gainers: Aster, Decred, and Kaspa rise as selling pressure wanes

Top Crypto Gainers: Aster, Decred, and Kaspa rise as selling pressure wanes

Altcoins such as Aster, Decred, and Kaspa are leading the broader cryptocurrency market recovery over the last 24 hours, as Bitcoin holds above $70,000 on Monday, up from the $60,000 dip on Thursday.

Weekly column: Saturn-Neptune and the end of the Dollar’s 15-year bull cycle

Weekly column: Saturn-Neptune and the end of the Dollar’s 15-year bull cycle

Tariffs are not only inflationary for a nation but also risk undermining the trust and credibility that go hand in hand with the responsibility of being the leading nation in the free world and controlling the world’s reserve currency.

RECOMMENDED LESSONS

5 Forex News Events You Need To Know

In the fast moving world of currency markets where huge moves can seemingly come from nowhere, it is extremely important for new traders to learn about the various economic indicators and forex news events and releases that shape the markets. Indeed, quickly getting a handle on which data to look out for, what it means, and how to trade it can see new traders quickly become far more profitable and sets up the road to long term success.

Top 10 Chart Patterns Every Trader Should Know

Chart patterns are one of the most effective trading tools for a trader. They are pure price-action, and form on the basis of underlying buying and selling pressure. Chart patterns have a proven track-record, and traders use them to identify continuation or reversal signals, to open positions and identify price targets.

7 Ways to Avoid Forex Scams

The forex industry is recently seeing more and more scams. Here are 7 ways to avoid losing your money in such scams: Forex scams are becoming frequent. Michael Greenberg reports on luxurious expenses, including a submarine bought from the money taken from forex traders. Here’s another report of a forex fraud. So, how can we avoid falling in such forex scams?

What Are the 10 Fatal Mistakes Traders Make

Trading is exciting. Trading is hard. Trading is extremely hard. Some say that it takes more than 10,000 hours to master. Others believe that trading is the way to quick riches. They might be both wrong. What is important to know that no matter how experienced you are, mistakes will be part of the trading process.

Strategy

Money Management

Psychology

Best Brokers of 2025