In a recent class, the students kept asking me to explain how to locate and trade chart patterns. While finding some of these patterns may be useful, the key focus for a trader to be successful has to be trend, supply and demand. If you are able to read those key things in your charts, you will likely be ahead of most other traders, or on the opposite side of them when the pattern and their trades fail.
An uptrend is defined by price making higher highs and higher lows. The higher lows are the most important part of that definition. A downtrend is price making lower lows and lower highs. In this case, the lower highs are most important. Chart patterns attempt to identify points where price is likely to reverse and change trend. These patterns usually fail unless they occur at a supply or demand level. A trader looking for patterns identified by a screening software or website may miss this critical point unless they take the time to inspect price action beyond the pattern itself.
Let's examine a head and shoulders pattern. This is a very popular pattern to signal trend reversal. Prices in an uptrend rally to a point and correct, forming a left shoulder. Price rallies again to a higher high continuing the uptrend before correcting once more. This has formed the head. Finally, prices try to rally again, but are not able to reach past the high of the head before starting to fall. Most traders looking for the Head and shoulder pattern would trade this pattern short as soon as prices break the neckline that connects the two lows between the shoulders.
Often, traders will not recognize the pattern until well after the neckline is broken. Some people cannot see patterns at all. This is the lament of the newer trader. The good news is that even if you do not recognize the patterns, if you simply remember the definition of trends, you can trade the patterns or even understand when the pattern is likely to fail.
In the case of the head and shoulders pattern, the right shoulder failing to reach higher than the head gives the chart a lower high. While that does not in itself break the uptrend, it is closer to the downtrend definition. Once the neckline has been broken, a lower low has been completed.
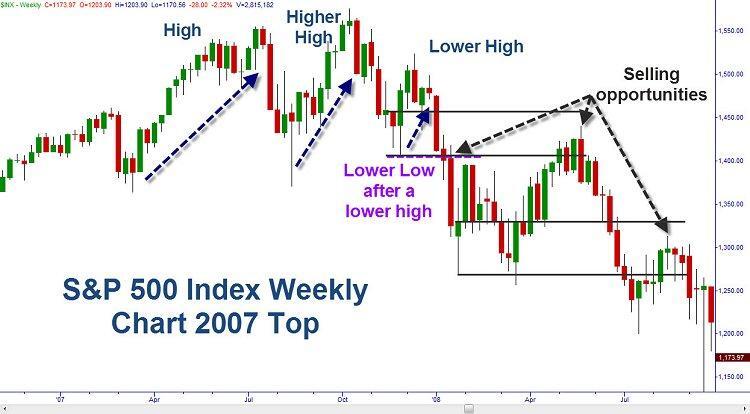
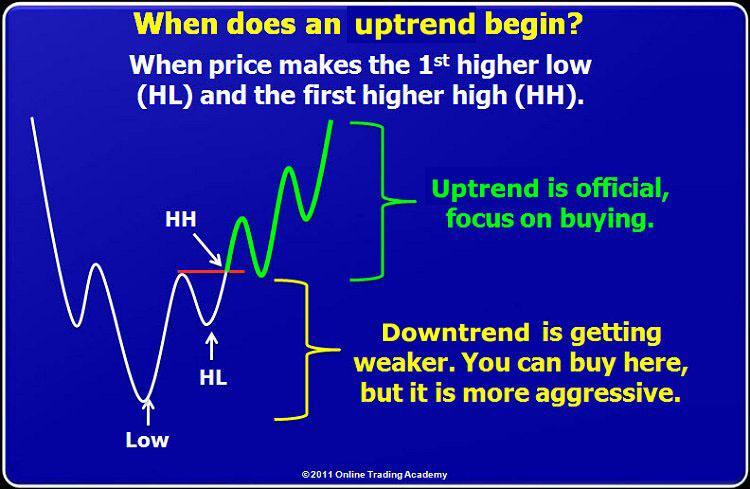
As long as prices make higher lows, you should look to buy pullbacks to demand levels. Once a lower high AND a lower low are made, then the trend is over and you should focus on shorting rallies to supply. The same is true for ending a downtrend. Once the price makes a higher high AFTER making a higher low, you are no longer supposed to be shorting. Be a bull again and buy the dips into demand.
It is important that you do not fight the trend. Identify it and trade with it at the proper entry levels, supply and/or demand. Doing this will put you on the path to trading success even if you can't see the patterns.
Neither Freedom Management Partners nor any of its personnel are registered broker-dealers or investment advisers. I will mention that I consider certain securities or positions to be good candidates for the types of strategies we are discussing or illustrating. Because I consider the securities or positions appropriate to the discussion or for illustration purposes does not mean that I am telling you to trade the strategies or securities. Keep in mind that we are not providing you with recommendations or personalized advice about your trading activities. The information we are providing is not tailored to any individual. Any mention of a particular security is not a recommendation to buy, sell, or hold that or any other security or a suggestion that it is suitable for any specific person. Keep in mind that all trading involves a risk of loss, and this will always be the situation, regardless of whether we are discussing strategies that are intended to limit risk. Also, Freedom Management Partners’ personnel are not subject to trading restrictions. I and others at Freedom Management Partners could have a position in a security or initiate a position in a security at any time.
Editors’ Picks
AUD/USD gets ready to punch through 0.7100
The intense sell-off in the Greenback underpins the solid performance of the Aussie Dollar on Monday, motivating AUD/USD to add to recent gains while challenging the key 0.7100 barrier, or fresh YTD highs, at the same time.
EUR/USD extends its optimism past 1.1900
EUR/USD retains a firm underlying bid, surpassing the 1.1900 mark as the NA session draws to a close on Monday. The pair’s persistent uptrend comes as the US Dollar remains on the defensive, with traders staying cautious ahead of upcoming US NFP prints and CPI data.
Gold picks up pace, retargets $5,100
Gold gathers fresh steam, challenging daily highs en route to the $5,100 mark per troy ounce in the latter part of Monday’s session. The precious metal finds support from fresh signs of continued buying by the PBoC, while expectations that the Fed could lean more dovish also collaborate with the uptick.
Litecoin eyes $50 as heavy losses weigh on investors
Following a strong downtrend across the crypto market over the past week, Litecoin holders are under immense pressure. The Bitcoin fork has trimmed about $1.81 billion from its market capitalization since the beginning of the year, sending it below the top 20 cryptos by market cap.
Japanese PM Takaichi nabs unprecedented victory – US data eyed this week
I do not think I would be exaggerating to say that Japanese Prime Minister Sanae Takaichi’s snap general election gamble paid off over the weekend – and then some. This secured the Liberal Democratic Party (LDP) an unprecedented mandate just three months into her tenure.
RECOMMENDED LESSONS
Making money in forex is easy if you know how the bankers trade!
I’m often mystified in my educational forex articles why so many traders struggle to make consistent money out of forex trading. The answer has more to do with what they don’t know than what they do know. After working in investment banks for 20 years many of which were as a Chief trader its second knowledge how to extract cash out of the market.
5 Forex News Events You Need To Know
In the fast moving world of currency markets where huge moves can seemingly come from nowhere, it is extremely important for new traders to learn about the various economic indicators and forex news events and releases that shape the markets. Indeed, quickly getting a handle on which data to look out for, what it means, and how to trade it can see new traders quickly become far more profitable and sets up the road to long term success.
Top 10 Chart Patterns Every Trader Should Know
Chart patterns are one of the most effective trading tools for a trader. They are pure price-action, and form on the basis of underlying buying and selling pressure. Chart patterns have a proven track-record, and traders use them to identify continuation or reversal signals, to open positions and identify price targets.
7 Ways to Avoid Forex Scams
The forex industry is recently seeing more and more scams. Here are 7 ways to avoid losing your money in such scams: Forex scams are becoming frequent. Michael Greenberg reports on luxurious expenses, including a submarine bought from the money taken from forex traders. Here’s another report of a forex fraud. So, how can we avoid falling in such forex scams?
What Are the 10 Fatal Mistakes Traders Make
Trading is exciting. Trading is hard. Trading is extremely hard. Some say that it takes more than 10,000 hours to master. Others believe that trading is the way to quick riches. They might be both wrong. What is important to know that no matter how experienced you are, mistakes will be part of the trading process.
The challenge: Timing the market and trader psychology
Successful trading often comes down to timing – entering and exiting trades at the right moments. Yet timing the market is notoriously difficult, largely because human psychology can derail even the best plans. Two powerful emotions in particular – fear and greed – tend to drive trading decisions off course.
-637973573681781790.jpg)

