![]() Ming Jong Tey
Ming Jong Tey
Independent Analyst
There are a number of ways to judge the price action momentum. In the previous post, I show you using trend channel as an alternative to up wave or upward thrust to gauge the buying or selling momentum.
In this video, I also adopt the same example SP 500 futures (ES) to show you using the popular pattern — rising wedge and RSI indicator to achieve the same objective.
Yet, what I would like to emphasize is to understand the rationale behind the pattern and the indicator, which we can always go back to the first principle to find out, i.e. why a rising wedge is bearish in nature or what bearish divergence in RSI actually means?
Once you understand the rationale or the first principle about the price action momentum, you can start trading without memorizing every single pattern or indicator if you prefer.
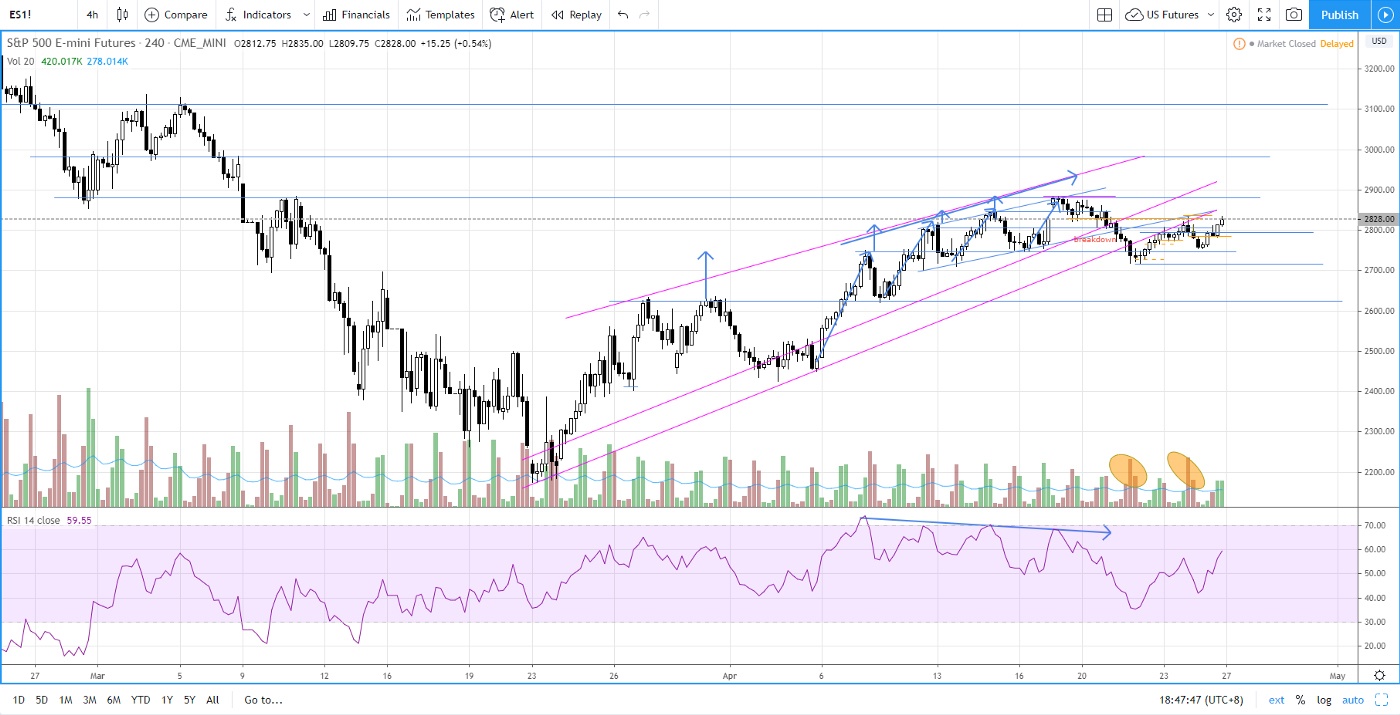
Rising wedge and RSI indicator show losing momentum
Note: All information on this page is subject to change. The use of this website constitutes acceptance of our user agreement. Please read our privacy policy and legal disclaimer. Opinions expressed at FXstreet.com are those of the individual authors and do not necessarily represent the opinion of FXstreet.com or its management. Risk Disclosure: Trading foreign exchange on margin carries a high level of risk, and may not be suitable for all investors. The high degree of leverage can work against you as well as for you. Before deciding to invest in foreign exchange you should carefully consider your investment objectives, level of experience, and risk appetite. The possibility exists that you could sustain a loss of some or all of your initial investment and therefore you should not invest money that you cannot afford to lose. You should be aware of all the risks associated with foreign exchange trading, and seek advice from an independent financial advisor if you have any doubts.
Editors’ Picks

EUR/USD hovers around 1.1850 ahead of FOMC Minutes
EUR/USD stays on the back foot around 1.1850 in the European session on Wednesday, pressured by renewed US Dollar demand. Traders now look forward to the Minutes of the Fed's January monetary policy meeting for fresh signals on future rate cuts.

GBP/USD defends 1.3550 after UK inflation data
GBP/USD is holding above 1.3550 in Wednesday's European morning, little changed following the UK Consumer Price Index (CPI) data release. The UK inflation eased as expected in January, reaffirming bets for a March BoE interest rate cut, especially after Tuesday's weak employment report.

USD/JPY is looking for direction around 153.00 with key US data in focus
USD/JPY reversal from 153.70 has been contained above 152.70 on Tuesday. Major currencies are trading within narrow ranges amid thin trading volumes. Investors await the release of the US GDP and PCE Inflation figures to make decisions.
Editors’ Picks
GBP/USD defends 1.3550 after UK inflation data
GBP/USD is holding above 1.3550 in Wednesday's European morning, little changed following the UK Consumer Price Index (CPI) data release. The UK inflation eased as expected in January, reaffirming bets for a March BoE interest rate cut, especially after Tuesday's weak employment report.
EUR/USD hovers around 1.1850 ahead of FOMC Minutes
EUR/USD stays on the back foot around 1.1850 in the European session on Wednesday, pressured by renewed US Dollar demand. Traders now look forward to the Minutes of the Fed's January monetary policy meeting for fresh signals on future rate cuts.

Gold: Is the $5,000 level back in sight?
Gold snaps a two-day downtrend, as recovery gathers traction toward $5,000 on Wednesday. The US Dollar recovers from the overnight sell-off as rebalancing trades resume ahead of Fed Minutes. The 38.2% Fib support holds on the daily chart for now. What does that mean for Gold?

Pi Network rally defies market pressure ahead of its first anniversary
Pi Network is trading above $0.1900 at press time on Wednesday, extending the weekly gains by nearly 8% so far. The steady recovery is supported by a short-term pause in mainnet migration, which reduces pressure on the PI token supply for Centralized Exchanges. The technical outlook focuses on the $0.1919 resistance as bullish momentum increases.

UK jobs market weakens, bolstering rate cut hopes
In the UK, the latest jobs report made for difficult reading. Nonetheless, this represents yet another reminder for the Bank of England that they need to act swiftly given the collapse in inflation expected over the coming months.
RECOMMENDED LESSONS
Making money in forex is easy if you know how the bankers trade!
I’m often mystified in my educational forex articles why so many traders struggle to make consistent money out of forex trading. The answer has more to do with what they don’t know than what they do know. After working in investment banks for 20 years many of which were as a Chief trader its second knowledge how to extract cash out of the market.
5 Forex News Events You Need To Know
In the fast moving world of currency markets where huge moves can seemingly come from nowhere, it is extremely important for new traders to learn about the various economic indicators and forex news events and releases that shape the markets. Indeed, quickly getting a handle on which data to look out for, what it means, and how to trade it can see new traders quickly become far more profitable and sets up the road to long term success.
Top 10 Chart Patterns Every Trader Should Know
Chart patterns are one of the most effective trading tools for a trader. They are pure price-action, and form on the basis of underlying buying and selling pressure. Chart patterns have a proven track-record, and traders use them to identify continuation or reversal signals, to open positions and identify price targets.
7 Ways to Avoid Forex Scams
The forex industry is recently seeing more and more scams. Here are 7 ways to avoid losing your money in such scams: Forex scams are becoming frequent. Michael Greenberg reports on luxurious expenses, including a submarine bought from the money taken from forex traders. Here’s another report of a forex fraud. So, how can we avoid falling in such forex scams?
What Are the 10 Fatal Mistakes Traders Make
Trading is exciting. Trading is hard. Trading is extremely hard. Some say that it takes more than 10,000 hours to master. Others believe that trading is the way to quick riches. They might be both wrong. What is important to know that no matter how experienced you are, mistakes will be part of the trading process.
The challenge: Timing the market and trader psychology
Successful trading often comes down to timing – entering and exiting trades at the right moments. Yet timing the market is notoriously difficult, largely because human psychology can derail even the best plans. Two powerful emotions in particular – fear and greed – tend to drive trading decisions off course.