The trend is our friend. 

But... what is the trend? How to track the trend? There will be dozens of methods. 

Today I'll make a brief introduction of my Algo Trader System, which could well define and track the trend on 60 min and 240 min chart.

It was created and backtested in Esignal. 

I just translated it into MT4 for several days.

The logic of Algo Trader includes price action, pivot and my own trend following method.

It could work on 9 pairs (H1 and H4 timeframe):

EURUSD, DXY, GBPUSD, USDJPY, AUDUSD, NZDUSD, USDCAD, Spot Gold, WTI Oil

The basic logic are the same, but the calculation method and filters are different for every pair and every timeframe.

Chart 1: Algo Trader System (Click on the image to enlarge)

Algo Trader System

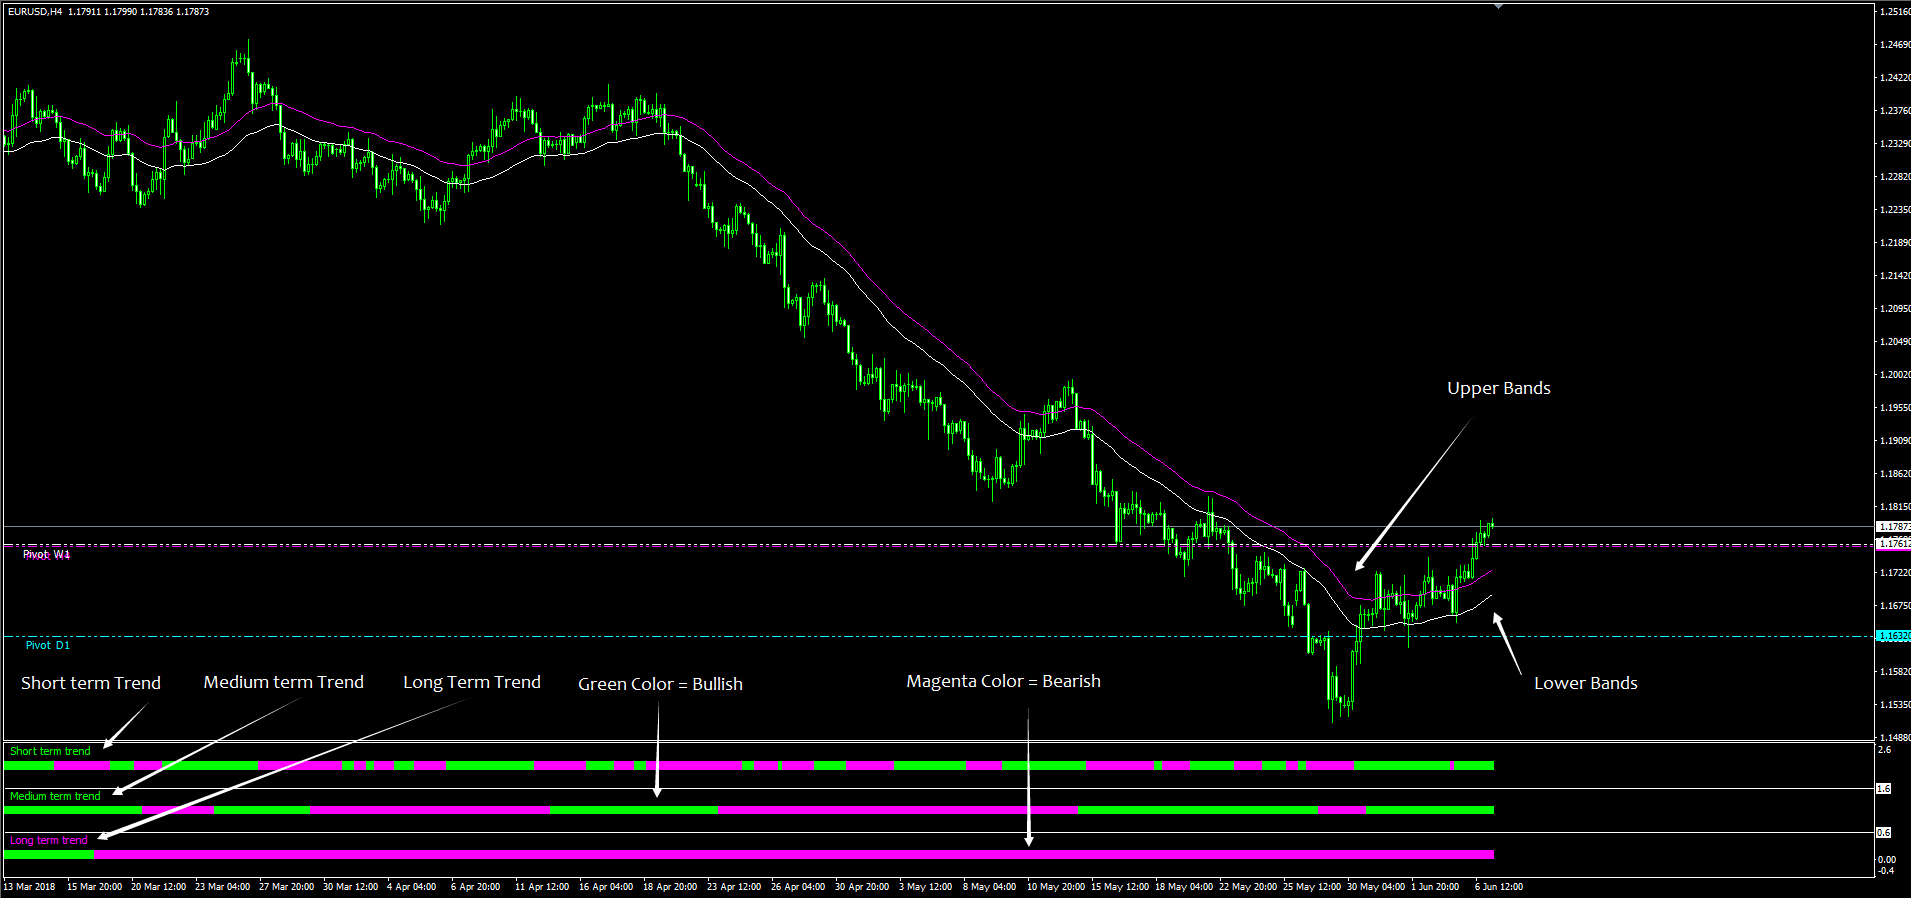
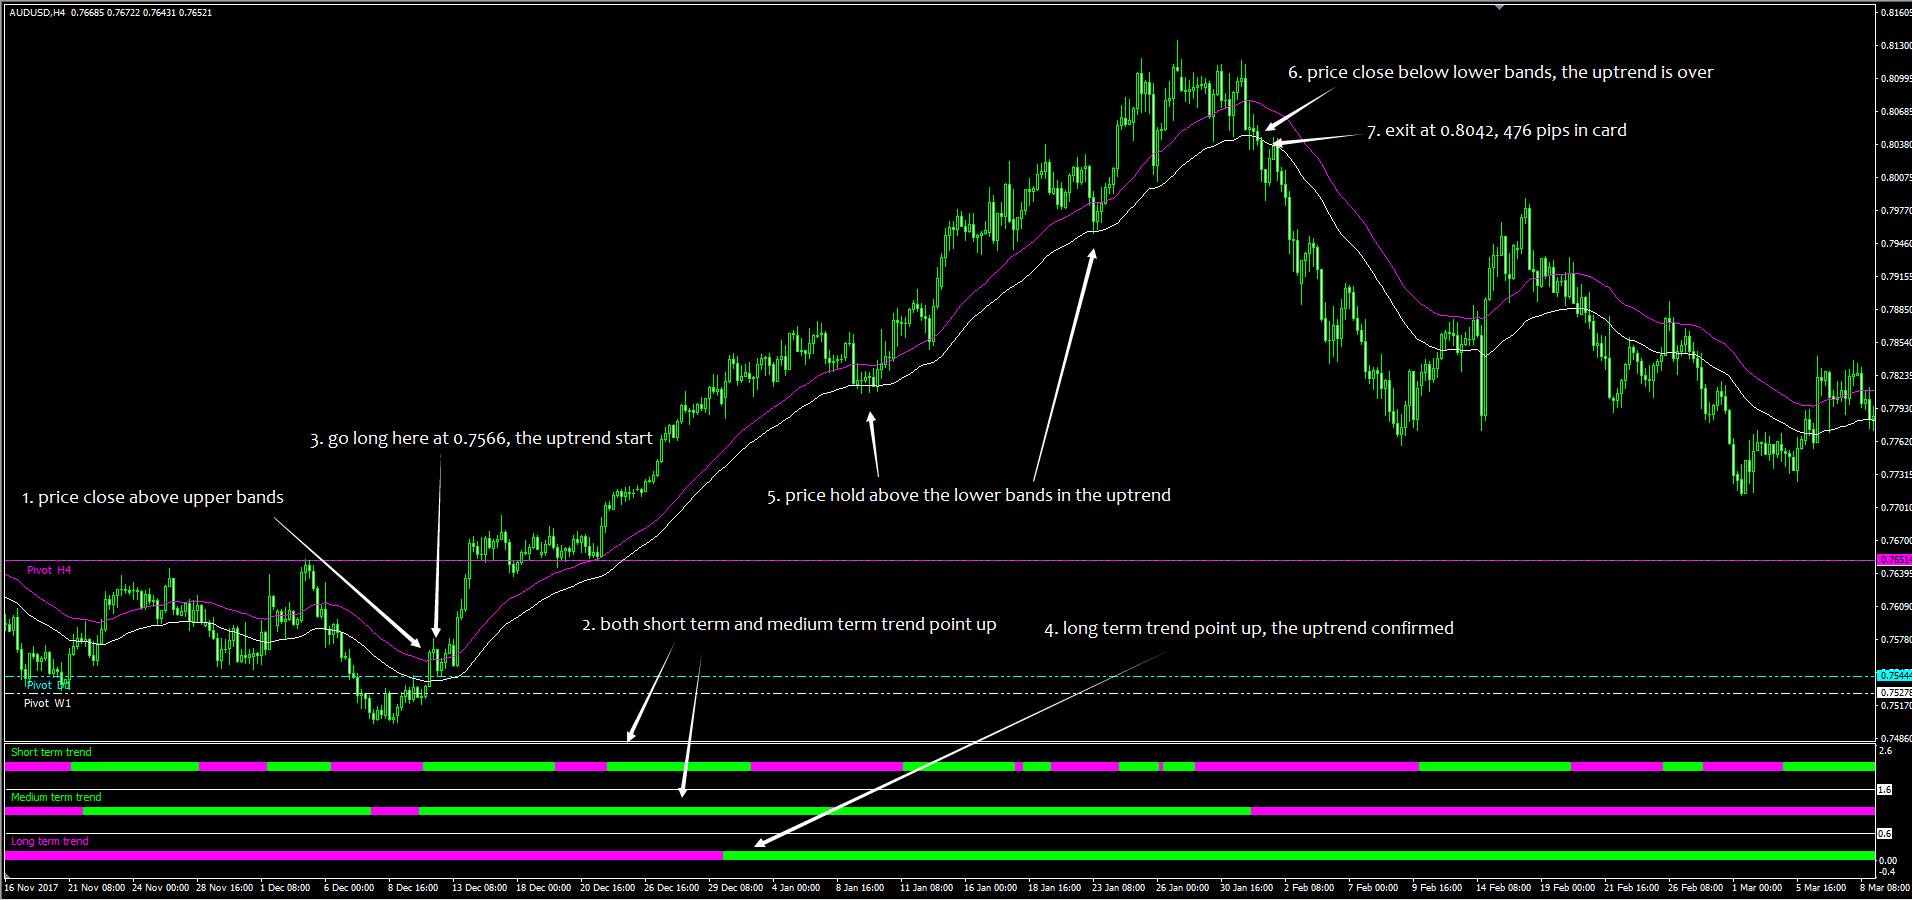
1. When short term trend, medium term trend and/or long term trend all turn green, and the price also closed above the upper bands, this should be a perfect buy opportunity, exit on price close below lower bands.

(The stop loss level could also be 5 pips below recent swing low)

Chart 2: Perfect buy trade setup (Click on the image to enlarge)

Perfect buy trade setup

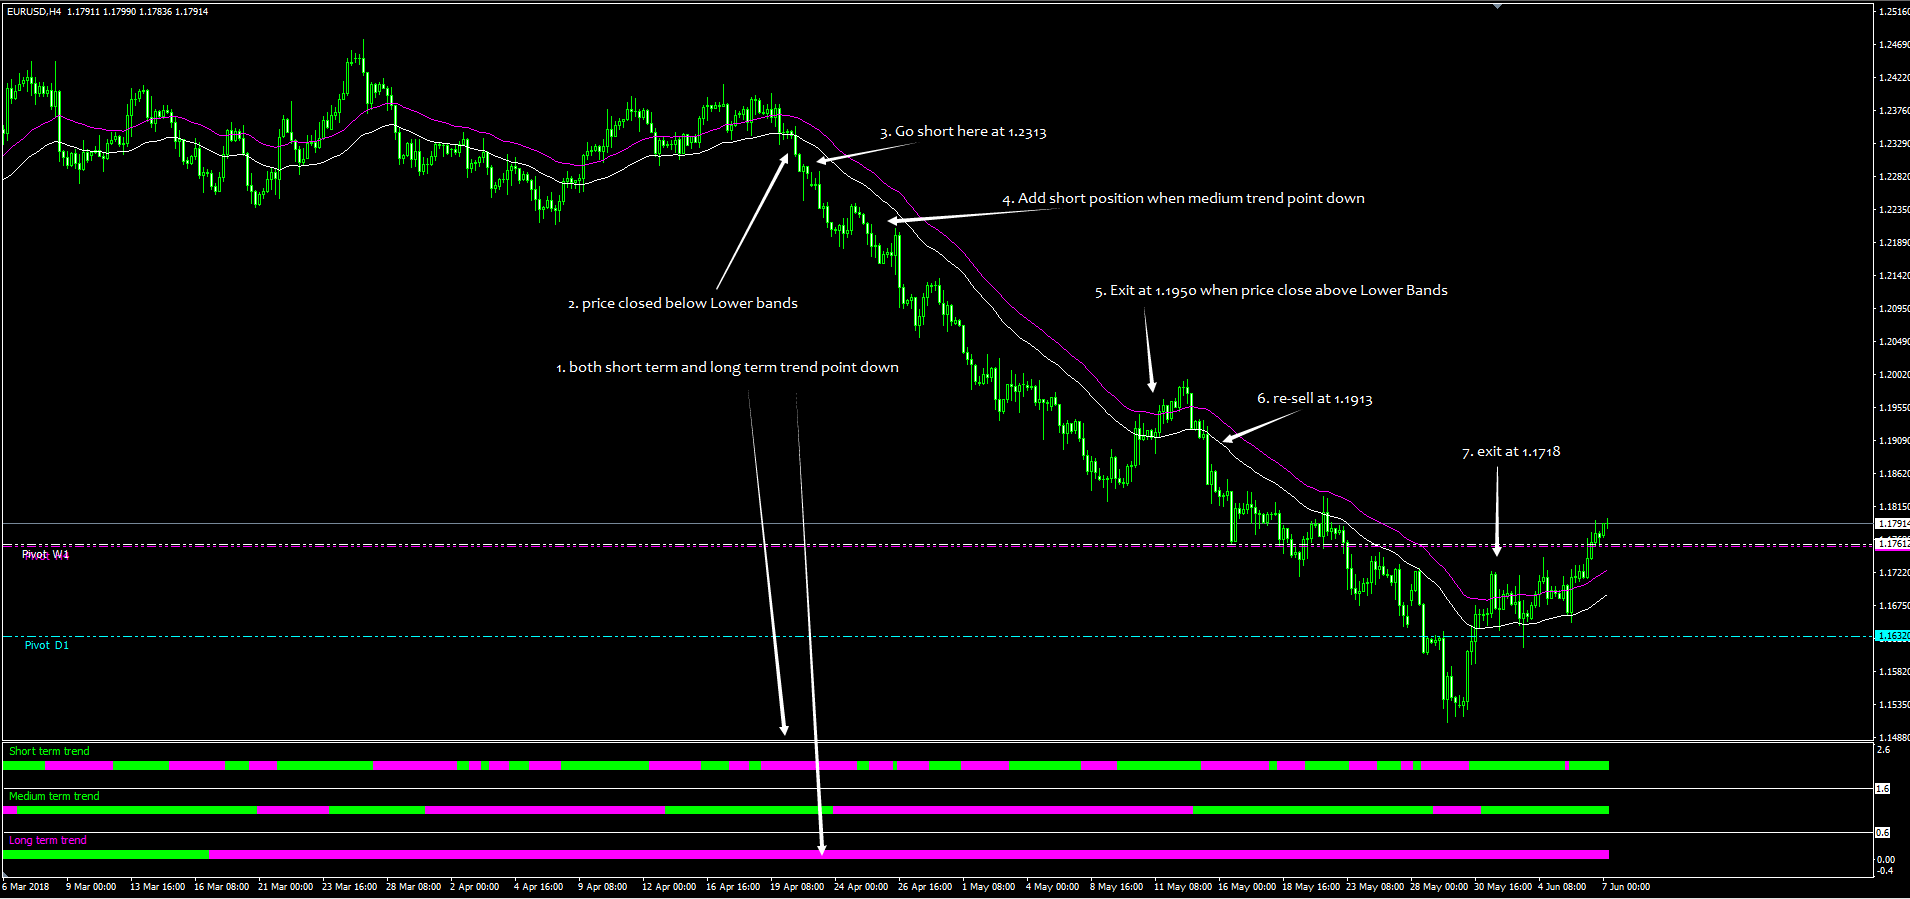
2. When short term trend, medium term trend and/or long term trend all turn magenta, and the price also closed below the lower bands, this should be a perfect sell opportunity, exit when price close above upper bands.

(The stop loss level could also be 5 pips above recent swing high)

Chart 3: Perfect sell trade setup (Click on the image to enlarge)
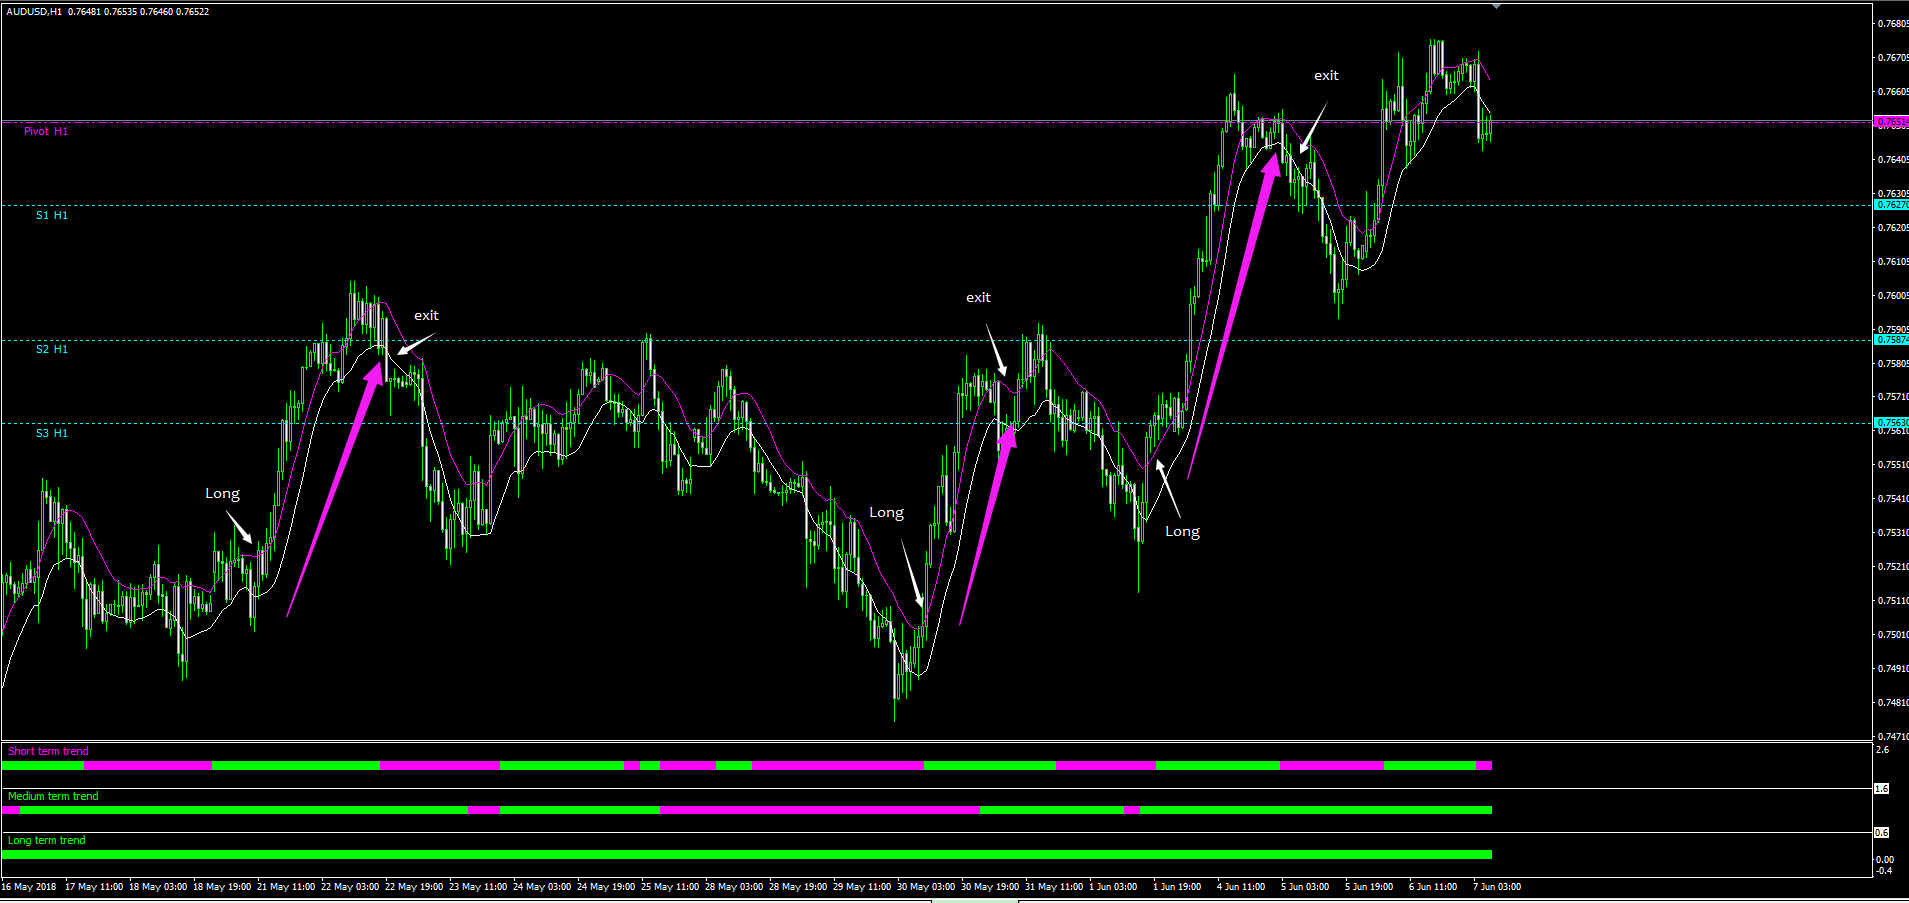
Perfect sell trade setup

3. Timeframe:

H4--Medium term trade

H1--Intraday short term trade

Chart 4: Intraday short term trade setup (Click on the image to enlarge)

Intraday short term trade setup

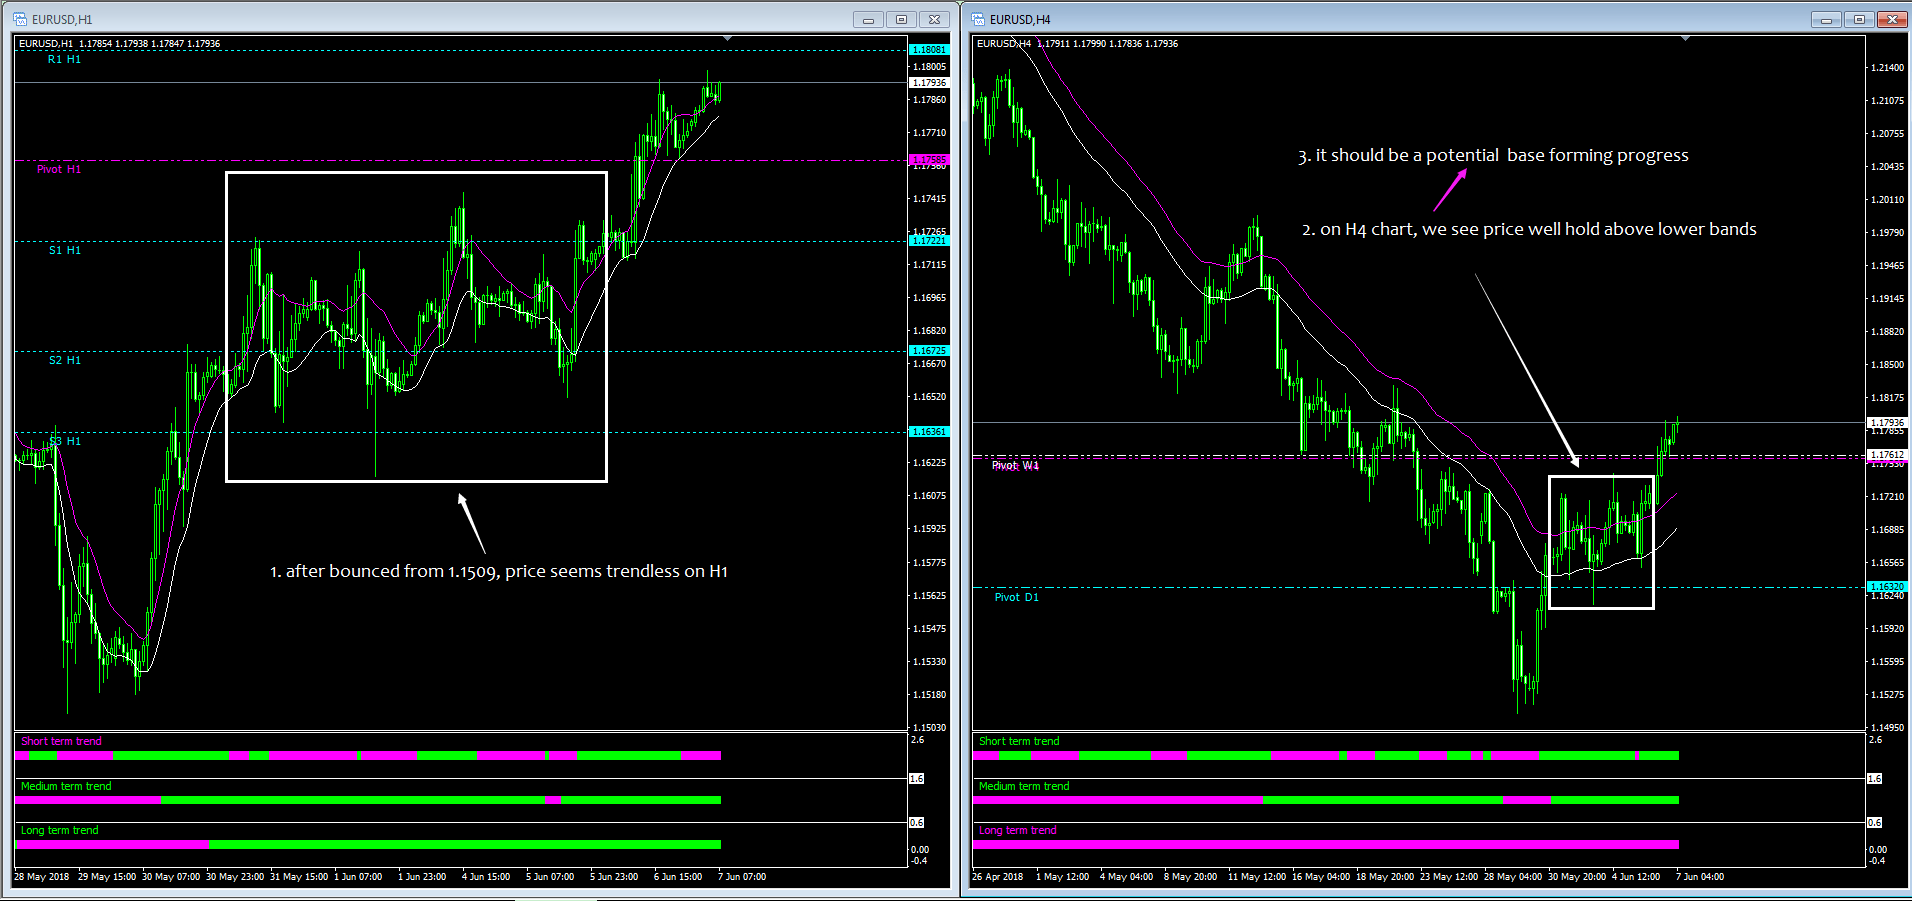
4. Combined H1 and H4 timeframe, we could well read the market.

Chart 5: Recent EURUSD Moving (Click on the image to enlarge)

Recent EURUSD Moving

5. Combined with Elliottwave theory to maximize profit and avoid potential immature entries

For a long time, I traded on manually Elliottwave analysis and look for top and bottom signs at potential turning points.

After Algo Trader system was created, I find the whole work becomes very easy.

To my experience, try to trade wave 3 and wave 5 should be more profitable.

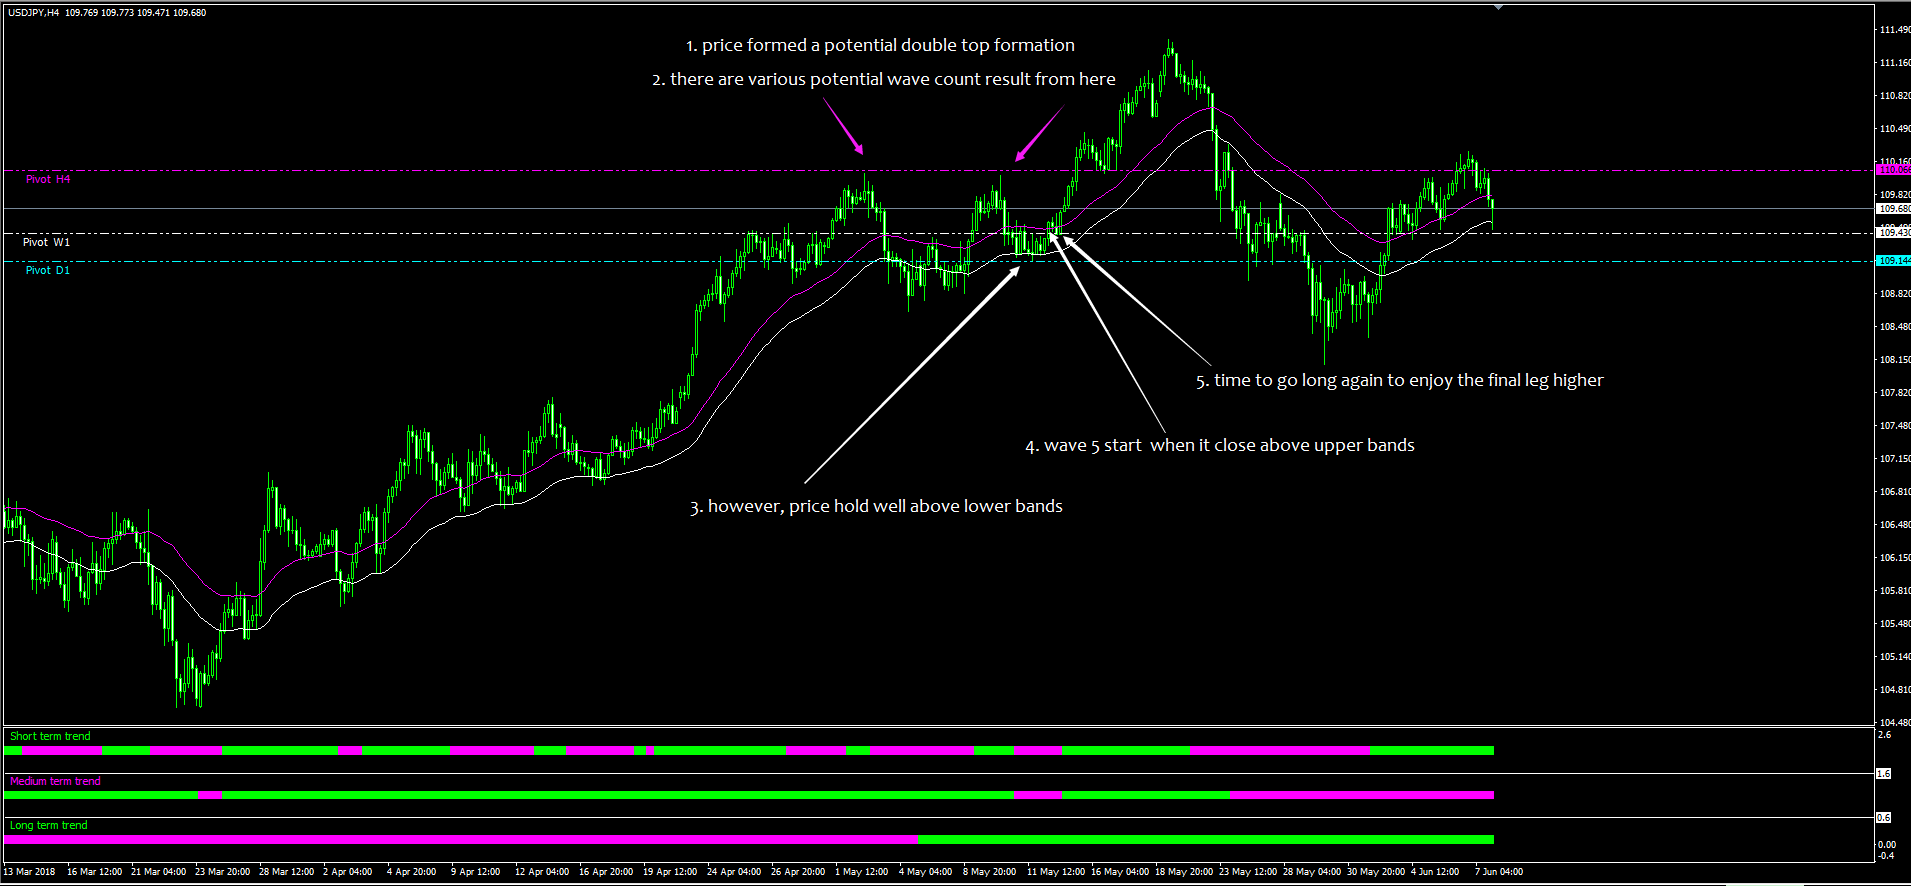
Now let's see recently USDJPY uptrend from 104.63 to 111.39.

After all the candles are flagged on the chart, we find it is a textbook 5 wave rally.

However, it is extremely hard to identify it during the trend developing.

Combined with Algo Trader system, we could pick most of the movement in wave 3 and wave 5.

Also could avoid the sell trade of a potential double top formation in wave 5.

Chart 6: track the movement of wave 3 (Click on the image to enlarge)

track the movement of wave 3

Chart 7: identify wave 5 (Click on the image to enlarge)

identify wave 5


We provide Daily FX Report, Trade Copy, Email Alert and MT4 EA Rental. Free trial and 30 Days Money Back policy will be valid forever! All the services could be Free


Editors’ Picks

EUR/USD treads water around 1.1900

EUR/USD treads water around 1.1900

EUR/USD edges a tad lower around the 1.1900 area, coming under mild pressure despite the US Dollar keeps the offered stance on turnaround Tuesday. On the US data front, December Retail Sales fell short of expectations, while the ADP four week average printed at 6.5K.

GBP/USD looks weak near 1.3670

GBP/USD looks weak near 1.3670

GBP/USD trades on the back foot around the 1.3670 region on Tuesday. Cable’s modest retracement also comes in tandem with the decent decline in the Greenback. Moving forward, the US NFP and CPI data in combination with key UK releases should kee the quid under scrutiny in the next few days.


USD/JPY drops toward 155.00 as focus shifts to US data

USD/JPY drops toward 155.00 as focus shifts to US data

USD/JPY meets fresh supply and inches closer toward 155.00 in the Asian session on Tuesday. The Japanese Yen holds the upper hand over the US Dollar after Japanese Prime Minister Sanae Takaichi led the ruling Liberal Democratic Party to a historic landslide win and on intervention talks. Traders brace for key US economic data that could offer more clues on the Federal Reserve's monetary policy.


Editors’ Picks

EUR/USD treads water around 1.1900

EUR/USD treads water around 1.1900

EUR/USD edges a tad lower around the 1.1900 area, coming under mild pressure despite the US Dollar keeps the offered stance on turnaround Tuesday. On the US data front, December Retail Sales fell short of expectations, while the ADP four week average printed at 6.5K.

GBP/USD looks weak near 1.3670

GBP/USD looks weak near 1.3670

GBP/USD trades on the back foot around the 1.3670 region on Tuesday. Cable’s modest retracement also comes in tandem with the decent decline in the Greenback. Moving forward, the US NFP and CPI data in combination with key UK releases should kee the quid under scrutiny in the next few days.


Gold the battle of wills continues with bulls not ready to give up

Gold the battle of wills continues with bulls not ready to give up

Gold comes under marked selling pressure on Tuesday, giving back part of its recent two day advance and threatening to challenge the key $5,000 mark per troy ounce. The yellow metal’s correction follows a better tone in the risk complex, a lower Greenback and shrinking US Treasuty yields.

AI Crypto Update: BankrCoin, Pippin surge as sector market cap steadies above $12B

AI Crypto Update: BankrCoin, Pippin surge as sector market cap steadies above $12B

The Artificial Intelligence (AI) segment is largely on the back foot with major coins such as Bittensor (TAO) and Internet Computer (ICP) extending losses amid a sticky risk-off sentiment.

Dollar drops and stocks rally: The week of reckoning for US economic data

Dollar drops and stocks rally: The week of reckoning for US economic data

Following a sizeable move lower in US technology Stocks last week, we have witnessed a meaningful recovery unfold. The USD Index is in a concerning position; the monthly price continues to hold the south channel support.

RECOMMENDED LESSONS

5 Forex News Events You Need To Know

In the fast moving world of currency markets where huge moves can seemingly come from nowhere, it is extremely important for new traders to learn about the various economic indicators and forex news events and releases that shape the markets. Indeed, quickly getting a handle on which data to look out for, what it means, and how to trade it can see new traders quickly become far more profitable and sets up the road to long term success.

Top 10 Chart Patterns Every Trader Should Know

Chart patterns are one of the most effective trading tools for a trader. They are pure price-action, and form on the basis of underlying buying and selling pressure. Chart patterns have a proven track-record, and traders use them to identify continuation or reversal signals, to open positions and identify price targets.

7 Ways to Avoid Forex Scams

The forex industry is recently seeing more and more scams. Here are 7 ways to avoid losing your money in such scams: Forex scams are becoming frequent. Michael Greenberg reports on luxurious expenses, including a submarine bought from the money taken from forex traders. Here’s another report of a forex fraud. So, how can we avoid falling in such forex scams?

What Are the 10 Fatal Mistakes Traders Make

Trading is exciting. Trading is hard. Trading is extremely hard. Some say that it takes more than 10,000 hours to master. Others believe that trading is the way to quick riches. They might be both wrong. What is important to know that no matter how experienced you are, mistakes will be part of the trading process.

Strategy

Money Management

Psychology

Best Brokers of 2025