The Directional Movement Index is a great technical tool that helps you see the direction of the market and whether the market is making gains or losses. That’s easy, you say – what’s the point of that? Well, the Directional Movement Index (DMI) lets you see the rate of change. This makes it very useful for showing a few things:

  • When the pace of gains is slowing,

  • When the rate of gains has peaked and is starting to reverse.

In summary, the DMI can help you spot a trend reversal early. Here is how it works.

The DMI calculation

The DMI is calculated this way. It is a lengthy explanation, so follow this link for the calculation. However, the bottom line is that the DMI gives a visualised measure meant for the rate of gains. When the +DM is rising and crosses the -DM then gains are outpacing losses. When the -DM is rising and crosses the +DM then falls are outpacing gains. Take a look here for an example in silver.

Chart

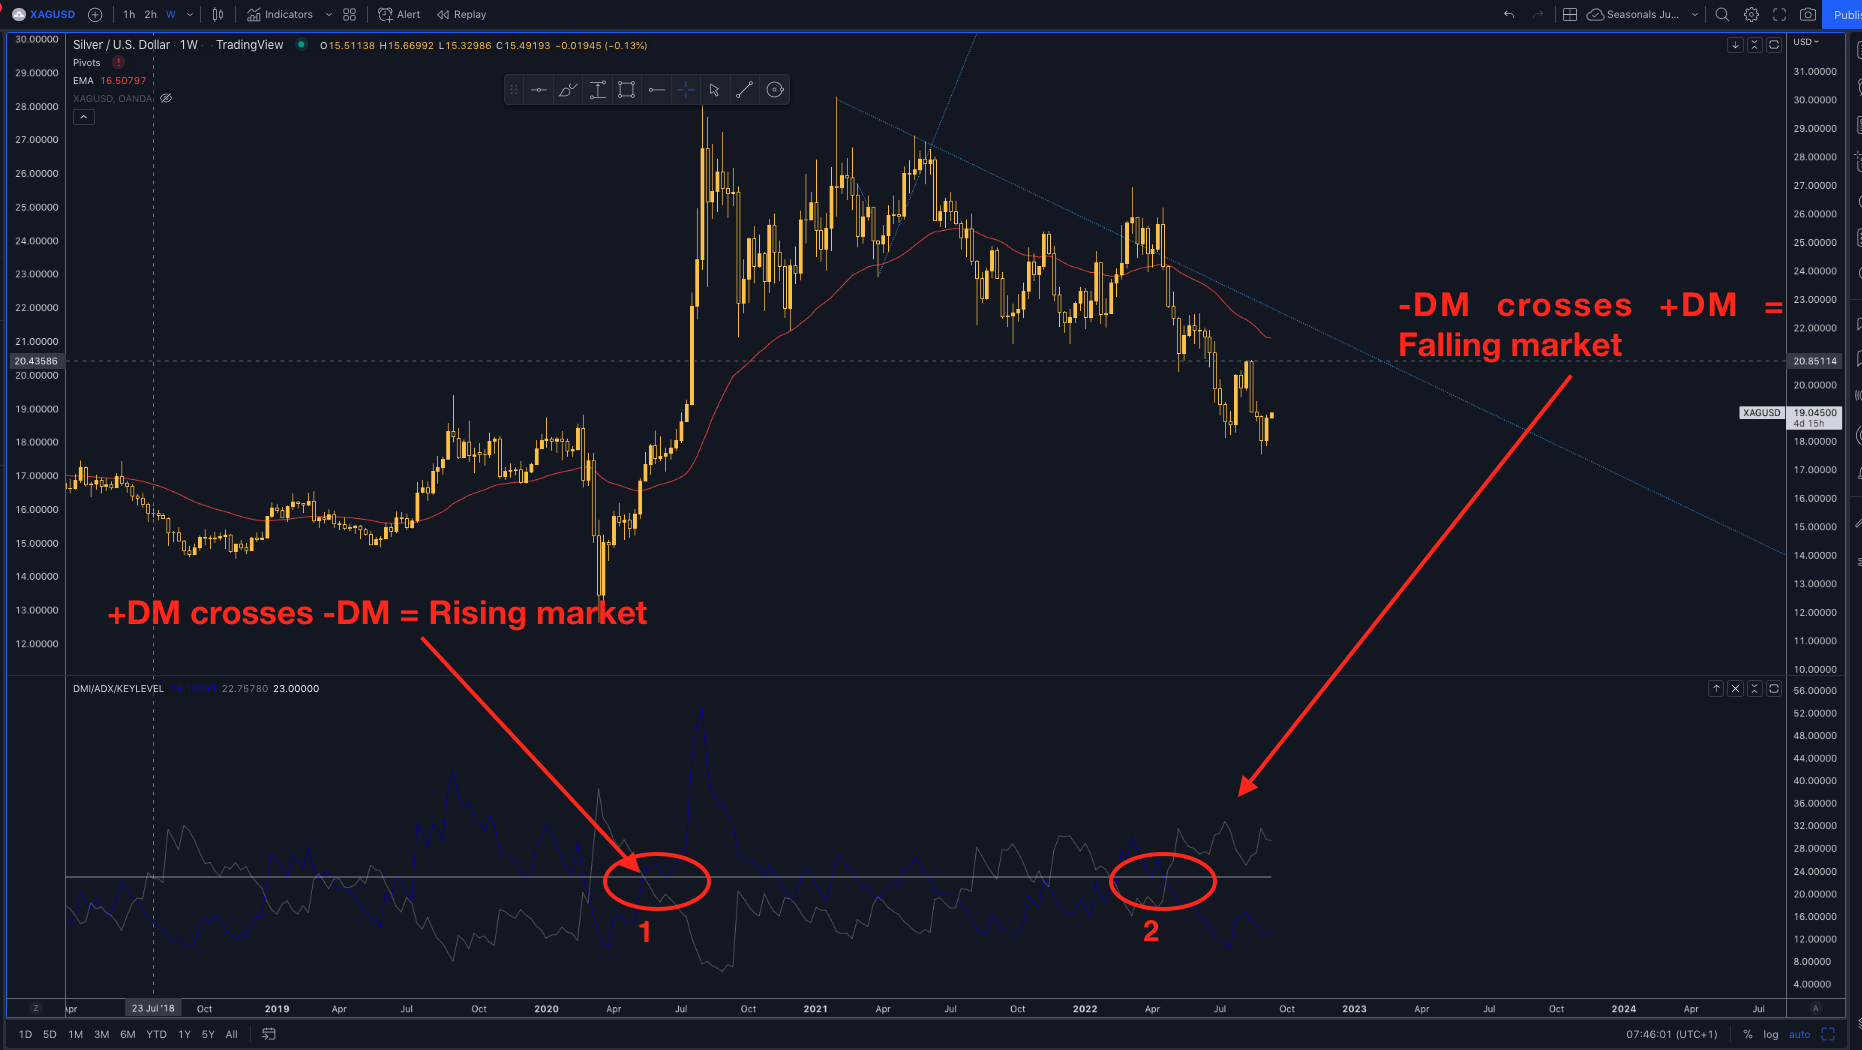
Looking above at the first cross marked 1 you can see that the pace of gains clearly outpaces that pace of falls over the last 14 day period (see calculation methodology in link above). This would provide a decent entry in a trending market. Similarly, looking at the cross marked 2 you can see that the pace of falls is outpacing gains and that would have provided a good entry on the sell side.

The real world application

Now it is easy to use any indicator and ‘cherry pick’ dream entries. So traders must be aware when it is appropriate to use a tool and when it is not. The DMI is best used for trending markets. So, if there is a market that you think is fundamentally due for a nice trend then consider using the DMI as one of your tools. It can help with entry confirmation and give you another way of seeing the technical picture which has proved very helpful to some very successful traders.


Learn more about HYCM


Our products and commentary provides general advice that do not take into account your personal objectives, financial situation or needs. The content of this website must not be construed as personal advice.

Editors’ Picks

EUR/USD could test 1.1750 amid strengthening bullish bias

EUR/USD could test 1.1750 amid strengthening bullish bias

EUR/USD remains flat after two days of small losses, trading around 1.1740 during the Asian hours on Thursday. On the daily chart, technical analysis indicates a strengthening of a bullish bias, as the pair continues to trade within an ascending channel pattern.

GBP/USD consolidates above mid-1.3300s as traders await BoE and US CPI report

GBP/USD consolidates above mid-1.3300s as traders await BoE and US CPI report

The GBP/USD pair struggles to capitalize on the overnight bounce from the 1.3310 area, or a one-week low, and oscillates in a narrow band during the Asian session on Thursday. Spot prices currently trade around the 1.3370 region, down less than 0.10% for the day, as traders opt to wait on the sidelines ahead of the key central bank event risk and US consumer inflation data.

Japanese Yen languishes near weekly low against USD; focus remains on BoJ policy update

Japanese Yen languishes near weekly low against USD; focus remains on BoJ policy update

The Japanese Yen trades with a negative bias against the recovering US Dollar for the second straight day, pushing the USD/JPY pair closer to the 156.00 mark or the weekly top. In the absence of any fundamental catalyst, the downtick could be attributed to some repositioning trade ahead of the crucial Bank of Japan policy update on Friday.


Editors’ Picks

EUR/USD could test 1.1750 amid strengthening bullish bias

EUR/USD could test 1.1750 amid strengthening bullish bias

EUR/USD remains flat after two days of small losses, trading around 1.1740 during the Asian hours on Thursday. On the daily chart, technical analysis indicates a strengthening of a bullish bias, as the pair continues to trade within an ascending channel pattern.

GBP/USD consolidates above mid-1.3300s as traders await BoE and US CPI report

GBP/USD consolidates above mid-1.3300s as traders await BoE and US CPI report

The GBP/USD pair struggles to capitalize on the overnight bounce from the 1.3310 area, or a one-week low, and oscillates in a narrow band during the Asian session on Thursday. Spot prices currently trade around the 1.3370 region, down less than 0.10% for the day, as traders opt to wait on the sidelines ahead of the key central bank event risk and US consumer inflation data.

Gold awaits weekly trading range breakout ahead of US CPI report

Gold awaits weekly trading range breakout ahead of US CPI report

Gold struggles to capitalize on the previous day's move higher back closer to the $4,350 level and trades with a mild negative bias during the Asian session on Thursday. The downtick could be attributed to some profit-taking amid a US Dollar uptick, though it is likely to remain cushioned on the back of a supportive fundamental backdrop. 

Dogecoin breaks key support amid declining investor confidence

Dogecoin breaks key support amid declining investor confidence

Dogecoin trades in the red on Thursday, following a 4% decline on the previous day. The DOGE supply in profit declines as large wallet investors trim their portfolios. Derivatives data shows a surge in bearish positions amid declining retail interest.

Monetary policy: Three central banks, three decisions, the same caution

Monetary policy: Three central banks, three decisions, the same caution

While the Fed eased its monetary policy on 10 December for the third consecutive FOMC meeting, without making any guarantees about future action, the BoE, the ECB and the BoJ are holding their respective meetings this week. 

RECOMMENDED LESSONS

5 Forex News Events You Need To Know

In the fast moving world of currency markets where huge moves can seemingly come from nowhere, it is extremely important for new traders to learn about the various economic indicators and forex news events and releases that shape the markets. Indeed, quickly getting a handle on which data to look out for, what it means, and how to trade it can see new traders quickly become far more profitable and sets up the road to long term success.

Top 10 Chart Patterns Every Trader Should Know

Chart patterns are one of the most effective trading tools for a trader. They are pure price-action, and form on the basis of underlying buying and selling pressure. Chart patterns have a proven track-record, and traders use them to identify continuation or reversal signals, to open positions and identify price targets.

7 Ways to Avoid Forex Scams

The forex industry is recently seeing more and more scams. Here are 7 ways to avoid losing your money in such scams: Forex scams are becoming frequent. Michael Greenberg reports on luxurious expenses, including a submarine bought from the money taken from forex traders. Here’s another report of a forex fraud. So, how can we avoid falling in such forex scams?

What Are the 10 Fatal Mistakes Traders Make

Trading is exciting. Trading is hard. Trading is extremely hard. Some say that it takes more than 10,000 hours to master. Others believe that trading is the way to quick riches. They might be both wrong. What is important to know that no matter how experienced you are, mistakes will be part of the trading process.

Strategy

Money Management

Psychology

Best Brokers of 2025