How to use Intermarket Relationships to successfully trade FX – Practical examples from Weekly Trades

If you have been trading for a while you will know by now that market conditions do not always remain the same.
There are times that strong trends exist, very specific themes dominate the news-flow and your trend trading strategy is doing great.
There are other times, where trends do not exist, prices are just rotating up and down without a clear direction and during these times, your mean-reversion strategies are performing much better.
Of course, there are also times, as it is happening now, where markets globally are choppy, volatile, markets tend to be nervous, emotional and volatile and anything seems possible to happen. The markets could easily crush lower, but we wouldn’t be surprised if we had another rally higher!
How can we gain an edge as traders in such an environment?
Is there an approach that could lead to higher probability trades with generous reward to risk outcomes?
Macro Fundamental and intermarket relationships could help you understand better the current economic regime and identify trading patterns with the edge in your favor.
We would not just be too theoretical about this, we will present you insights and trading ideas, we shared with our members, at our FTA FX Desk.
This week that started on the 12th of November, was a tough one, as political themes and newswere dominating the markets, causing uncertainty and confusion to investors.
From the previous week, we had a negative bias towards European equities and specifically the Eurostoxx50, because of Fundamental reasons, political turmoil and we could see in the market profile chart that technically, the price was repeatedly rejected at the Value Area Low of the larger composite profile at 3240, where we have the red horizontal line.
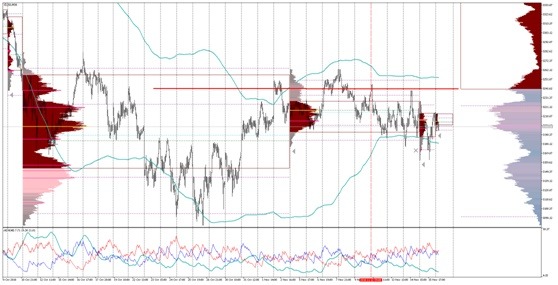
Based on this observation and intermarket relationships, we were looking to sell EURJPY into resistance at the appropriate levels.

The price in EURJPY indeed moved higher and around the 130 level we were sellers, as our PowerFibs algorithm was indicating a significant resistance and we had a strong High Volume Node in that area.
This is just an example of how intermarket relationships between equity indices and currency pairs can be used in your favor.
Another example is the correlation between the CAD and Crude Oil.
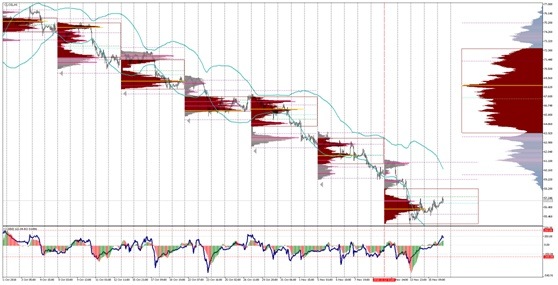
You can see from the chart above that Crude Oil had suffered a strong move lower, but just above the $55 level, we had technically an alert that we were reaching an important support level. We paid closer attention to the structure around this area and we noticed the formation of a High-Volume Node, with a b-shape, right into that area, a sign that perhaps an accumulation process is in place. The sellers were less aggressive and the buyers more interested to do business again in that area.
We didn’t buy Crude.
We were looking to sell the USDCAD.

We noticed in the USDCAD that while Oil seemed to bottom out, USDCAD was topping out!
Please notice the formation of a balance, a ranging area right at the highs of the range.
Because of the potential pause in Oil’s downtrend and other Fundamental reasons, we were looking to sell the USDCAD, if it was going to break the range below 1.3210. If Oil is going to finally enjoy a rebound higher, we will be looking to sell any correction higher up to 1.32. We wouldn’t like to see another break and acceptance above the 1.32 area.
Our other call based on intermarket relationship was between the S&P500 and the USDJPY.
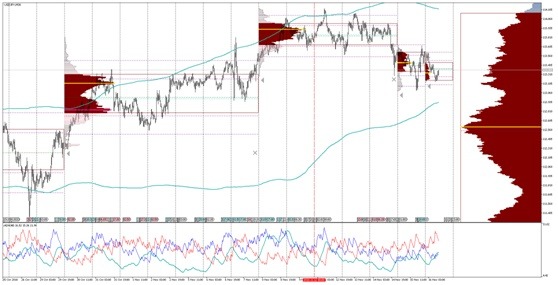
The USDJPY had moved higher but around the 114 level we had the Value Area High of the larger composite profile. That is an important resistance. Price was consolidating for a while and finally we got the break lower. Our bias was only to sell around that area. But why? How could we have a stronger conviction for this trade?
The conviction was because of the relationship between the JPY and equity markets.
Based on the structure of the equity markets, we were sellers in the equities and specifically the S&P500 around the 2816 level, where we have the 1st standard deviation of the VWAP. Price moved back inside the Value Area which was quite negative for us.
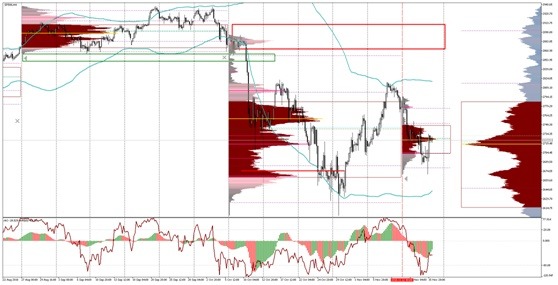
This is why we had a negative outlook not just for equities, but also when the USDJPY reached the 114 level, we had a stronger conviction to be sellers in that area.
Intermarket relationships, understanding better the structure of prices and of course risk management can help you gain a much better trading edge and identify high-probability setups, even at times where market conditions are a bit volatile and not optimal.
Author

Fotis Papatheofanous, MBA
Fotis Trading Academy
Fotis, as you would expect from his name is the key trainer at the Fotis Trading Academy. Fotis is a highly reputed, driven and successful Global Macro Trader and Portfolio Manager.















