Hi there!

Stan here, and today we will talk about the very specific topic - trading against the “weak money”. There’s been much said about “smart money”, “big market participants” and other “strong forces” of the market, which we’d like to be in sync with. However, such a situation is not always visible, and we have to monitor for short-term imbalances in the price action. Even if you want to follow the “smart money”, you’d still need to manage your risk, capturing short-term opportunities - at least to identify a good moment for entry. That’s what we are going to talk about in this article.


How does the “weak” move occur?


By “weak” moves, I assume ones which don’t have any support from the market: neither from big market participants nor from the “crowd”. Those moves may be visible and look like something meaningful, yet they are generated by mechanical trading engines. In case no other traders are ready to support the game, the “weak” move has very decent odds of being faded very soon. Smart traders know that and use the mentioned moves for building short-term counter-trend intraday trades with very limited risk.


The mechanical buying/selling


If you see price reacting exactly on a previous day’s high (low) or a high (low) of the recent trading session, odds are so that you are dealing with the” mechanical reaction”. In other words, a quick trading algorithm could have been involved in the action, but unlikely there was a trace of a big time frame player.


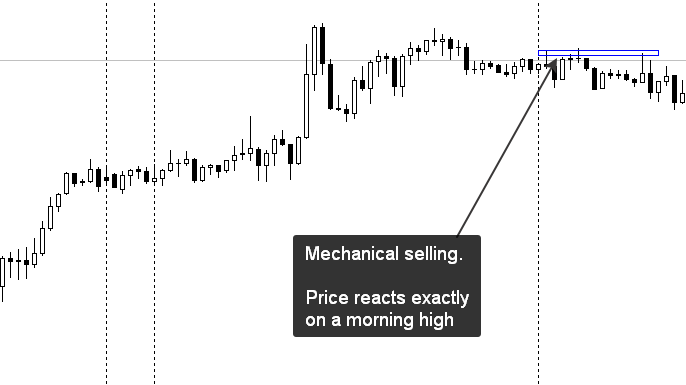
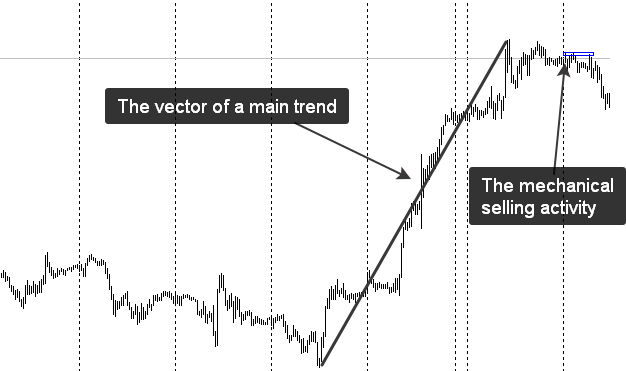
Your guess may be even more reliable if the “mechanical move” started during the inactive time of a trading session (for instance, one or two hours before the European session opening). Usually, big money doesn’t pay attention to such points as intraday highs and lows. There is a greater probability that we observe the activity of smaller forces. More often than not, it gives us the opportunity to confront that move, building a position in the opposite direction. You have greater odds of success if the previous intermediate-term trend is still active and it contradicts the “mechanical” move like shown below:


Trade location and risk calculation


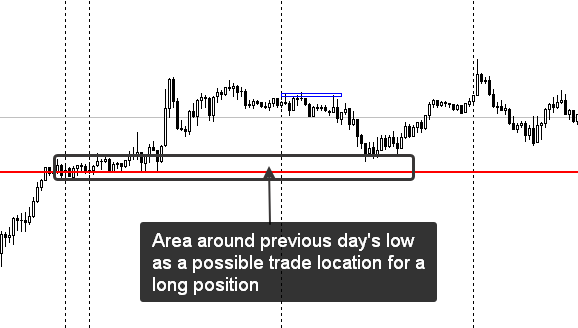
Trading is not just about entry points, but we still have to know how to identify them correctly. When is the “weak” move going to be exhausted? To answer this question, we should remember that markets are auctions: price moves until it the market perceives it as unfairly high (or low) - traders start to close their positions after that soon. In the case with a “weak money auction”, the potential of the move to continue diminishes as the price reaches the next reference - usually, an intraday high/low or a previous day’s high/low. It doesn’t mean that price would immediately reverse after reaching the mentioned point, but there you can build a counter-trend trade with a very limited risk (like it is shown below):


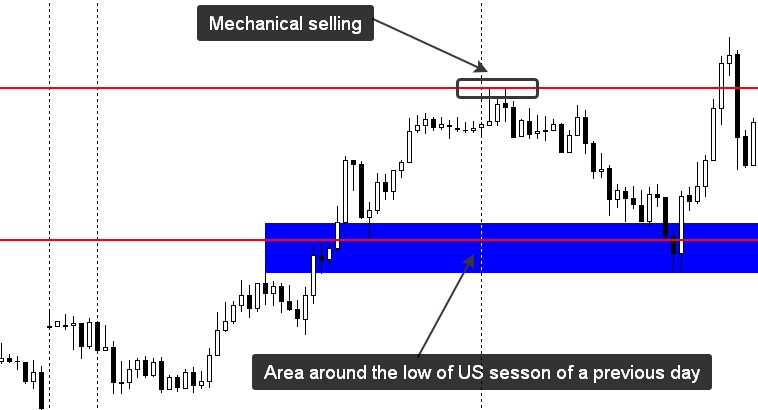
In the second example, I’ve taken the low from US session of a previous day. This is done so because the low of a previous day was quite far from the recent price action, and it would take more than a short-term mechanical impulse to get there. How wide should the area for a trade location be? Normally, I take the value of ATR(21) and add it to both sides of the reference point like it is shown below:


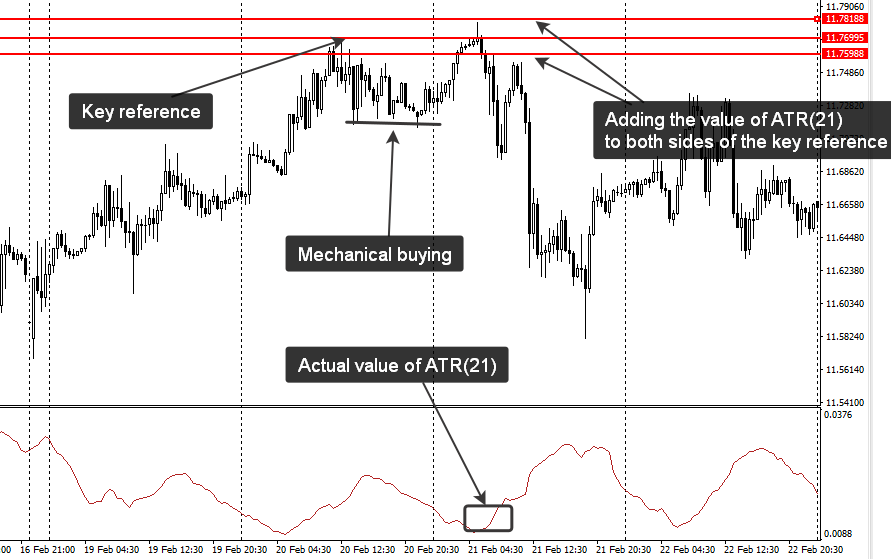
Stop-loss, in this case, may be placed beyond the area, which you build with the help of ATR(21). The lot size depends on your money management rules and should be calculated before you enter a position.


When the “weak money” wins


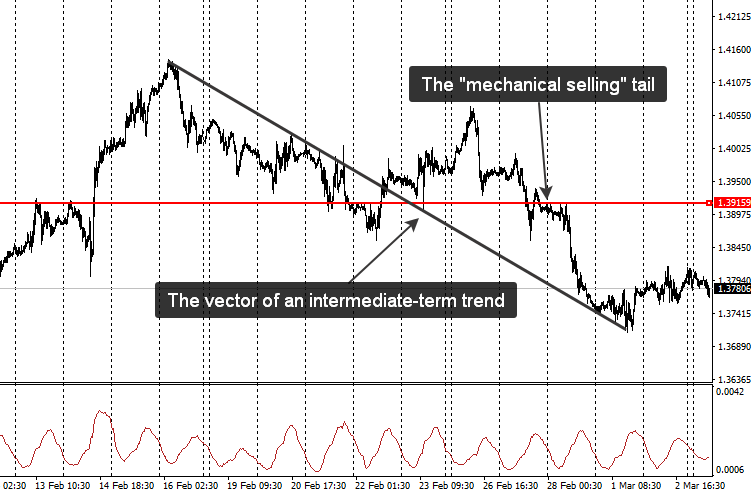
Sometimes it is not wise to oppose the mechanical selling or buying. You may already guess, that I’m talking about going against some intermediate-term trend. If you had one on the chart, it’s not recommended to go against the mechanical activity - such a trade might look as an easy one, but in fact, it’s not. Just take a look at the example below. Price was declining very quickly and in spite of a mechanical “selling tail”, there was a notable continuation after that. “Weak money” were acting under the protection of a strong trend (big money), that’s why it was unwise to oppose them back then.


So, be careful and manage your risk! In case you have any questions on the material published here, feel free to send me a request from my blog (accessible by the link in my account).


Good luck!


Trading the financial markets is associated with increased level of risk. Past performance is not indicative of future results. All materials are provided for educational purposes only and by no means may serve as a trading or investment advice.

Editors’ Picks

EUR/USD ticks lower following the release of FOMC Minutes

EUR/USD ticks lower following the release of FOMC Minutes

The US Dollar found some near-term demand following the release of the FOMC meeting minutes, with the EUR/USD pair currently piercing the 1.1750 threshold. The document showed officials are still willing to trim interest rates. Meanwhile, thinned holiday trading keeps major pairs confined to familiar levels.

GBP/USD remains sub- 1.3500, remains in the red

GBP/USD remains sub- 1.3500, remains in the red

The GBP/USD lost traction early in the American session, maintaining the sour tone and trading around 1.3460 following the release of the FOMC meeting minutes. Trading conditions remain thin ahead of the New Year holiday, limiting the pair's volatility.

USD/JPY declines as BoJ tightening supports Yen, Fed Minutes awaited

USD/JPY declines as BoJ tightening supports Yen, Fed Minutes awaited

USD/JPY trades slightly lower on Tuesday, hovering around 155.80 at the time of writing, down 0.15% on the day. The pair’s decline reflects a modest strengthening of the Japanese Yen (JPY) following the release of the Bank of Japan (BoJ) Summary of Opinions from its December policy meeting.


Editors’ Picks

EUR/USD ticks lower following the release of FOMC Minutes

EUR/USD ticks lower following the release of FOMC Minutes

The US Dollar found some near-term demand following the release of the FOMC meeting minutes, with the EUR/USD pair currently piercing the 1.1750 threshold. The document showed officials are still willing to trim interest rates. Meanwhile, thinned holiday trading keeps major pairs confined to familiar levels.

GBP/USD remains sub- 1.3500, remains in the red

GBP/USD remains sub- 1.3500, remains in the red

The GBP/USD lost traction early in the American session, maintaining the sour tone and trading around 1.3460 following the release of the FOMC meeting minutes. Trading conditions remain thin ahead of the New Year holiday, limiting the pair's volatility.

Gold stable above $4,350 as the year comes to an end

Gold stable above $4,350 as the year comes to an end

Gold price got to recover some modest ground on Tuesday, holding on to intraday gains and changing hands at $4,360 a troy ounce in the American afternoon. The bright metal showed no reaction to the release of the FOMC December meeting minutes.

Ethereum: ETH holds above $2,900 despite rising selling activity

Ethereum: ETH holds above $2,900 despite rising selling activity

Ethereum (ETH) held the $2,900 level despite seeing increased selling pressure over the past week. The Exchange Netflow metric showed deposits outweighed withdrawals by about 400K ETH. The high value suggests rising selling activity amid the holiday season.

Bitcoin Price Annual Forecast: BTC holds long-term bullish structure heading into 2026

Bitcoin Price Annual Forecast: BTC holds long-term bullish structure heading into 2026

Bitcoin (BTC) is wrapping up 2025 as one of its most eventful years, defined by unprecedented institutional participation, major regulatory developments, and extreme price volatility.

RECOMMENDED LESSONS

5 Forex News Events You Need To Know

In the fast moving world of currency markets where huge moves can seemingly come from nowhere, it is extremely important for new traders to learn about the various economic indicators and forex news events and releases that shape the markets. Indeed, quickly getting a handle on which data to look out for, what it means, and how to trade it can see new traders quickly become far more profitable and sets up the road to long term success.

Top 10 Chart Patterns Every Trader Should Know

Chart patterns are one of the most effective trading tools for a trader. They are pure price-action, and form on the basis of underlying buying and selling pressure. Chart patterns have a proven track-record, and traders use them to identify continuation or reversal signals, to open positions and identify price targets.

7 Ways to Avoid Forex Scams

The forex industry is recently seeing more and more scams. Here are 7 ways to avoid losing your money in such scams: Forex scams are becoming frequent. Michael Greenberg reports on luxurious expenses, including a submarine bought from the money taken from forex traders. Here’s another report of a forex fraud. So, how can we avoid falling in such forex scams?

What Are the 10 Fatal Mistakes Traders Make

Trading is exciting. Trading is hard. Trading is extremely hard. Some say that it takes more than 10,000 hours to master. Others believe that trading is the way to quick riches. They might be both wrong. What is important to know that no matter how experienced you are, mistakes will be part of the trading process.

Strategy

Money Management

Psychology

Best Brokers of 2025