The optimization of a trading system has been the consensus of programmers for a long time. A lot of software provide optimization function. However, we could not only focus on the higher profit after optimization. More scientific and systematic method is needed. This article gives a brief introduction.

Sample and setting

1. Tendency Forex System: Coded with JavaScript, no repaint, no Grid, no Martingale. Works on 240 minute timeframe for USDJPY, EURUSD and USD Index.

2. Historical Data Feed: eSignal charting system

3. Period: From Jan. 2010 to Oct. 2020

4. Initial Virtual Balance: $100k

5. Contract Size: Fixed 1 standard lot per trade

6. SPSS 24.0

7.GraphPad Prism 8.0

Methods and results

1. Backtesting with default setting

Figure1. Backtesting of USDJPY Periodical Analysis

Annual trading summary

Chart

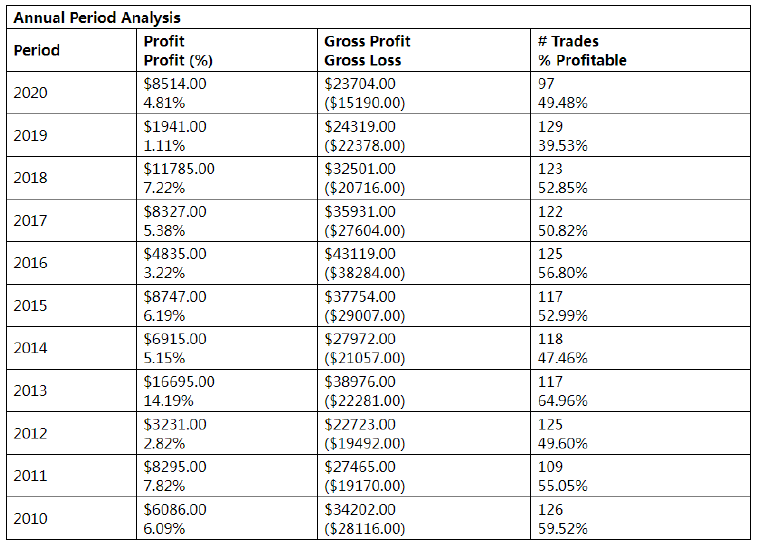
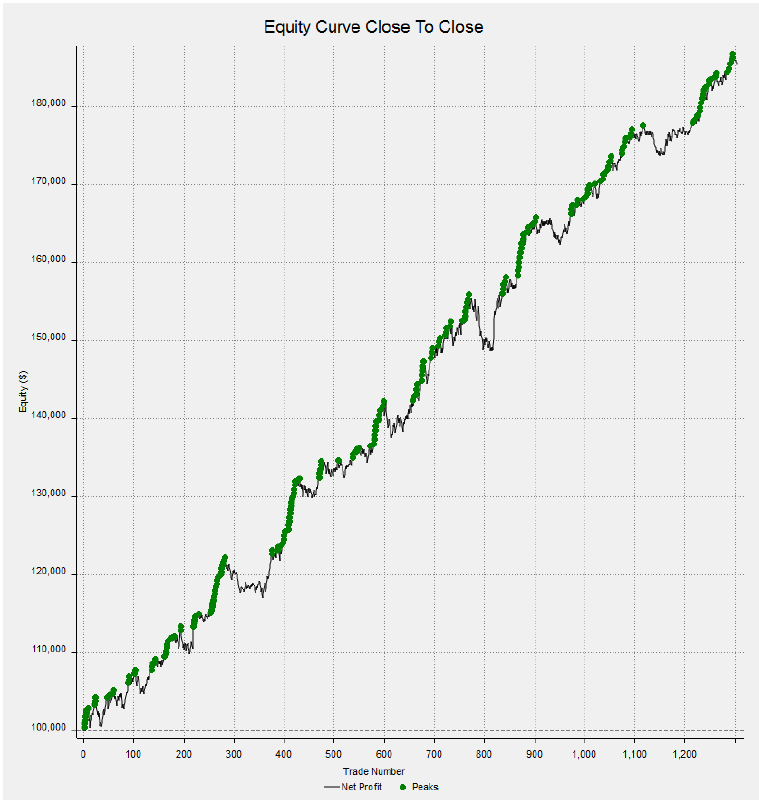
Figure 2. Backtesting of USDJPY Equity curve Close to Close

Chart

2. Optimization optimization

We compared the optimization results of Tendency Forex System, SPSS 24.0 was used for statistical analysis. Studies’ parameters were displayed as Mean SD (Standard Deviation) for continuous variables. The comparison between the two groups was performed by t test. The comparison between multiple groups was performed by variance analysis and Dunnett's t test. A P value <0.05 was considered statistically significant for all analysis. The statistical charts were drawn by GraphPa d Prism 8.0.

2.1 Optimization was done year by year

Tendency Forex System was optimized with the historical data from 2010 to 2015 and got the "optimized setting for 2016", then calculated the total net profit in 2016 with the "optimized setting 2016";

Tendency Forex System was optimized with the historical data from 2010 to 2016 and got the "optimized setting for 2017", then calculated the total net profit in 2017 with the "optimized setting 2017";

And so on.

2.2 Optimization results

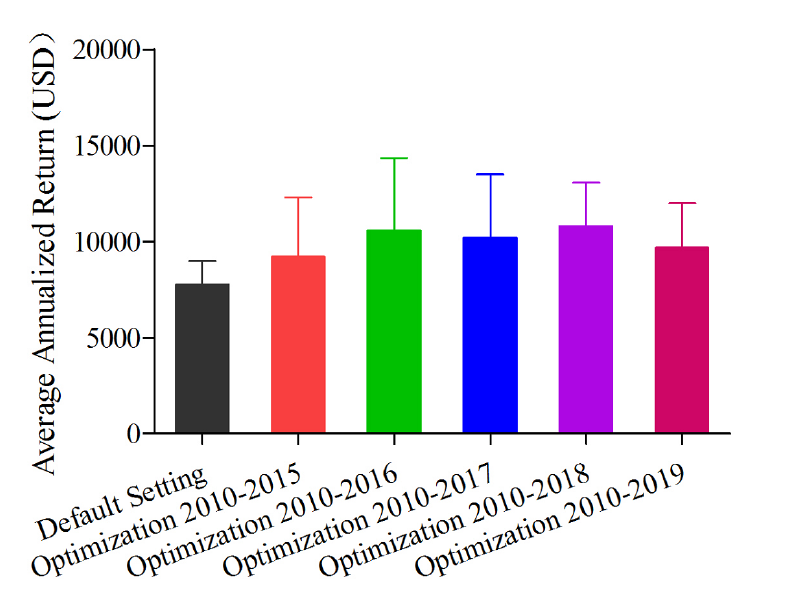
2.2.1 After optimization, the overall return was increased by at least 10% compared to the results of the default setting. It shows the optimization method is very effective. The details can be seen in Table 1 omitted

However, in the variance analysis on the Average Annualized Return, there was no statistically significant among multiple groups. F=0.218, P=0.953>0.05 The details can be seen in Table 2 omitted

Figure 3 variance analysis of the average annualized return

Chart

In theory, pairwise comparisons are only necessary if there is s statistical difference in variance analysis. However, for rigorous purpose, a Dunnett's t test was done with one group Default setting as a control group and compared all the other groups to it. All the Significance was higher than 0.05, further confirmed there was no statistically significant among multiple groups. The details can be seen in Table 3 omitted

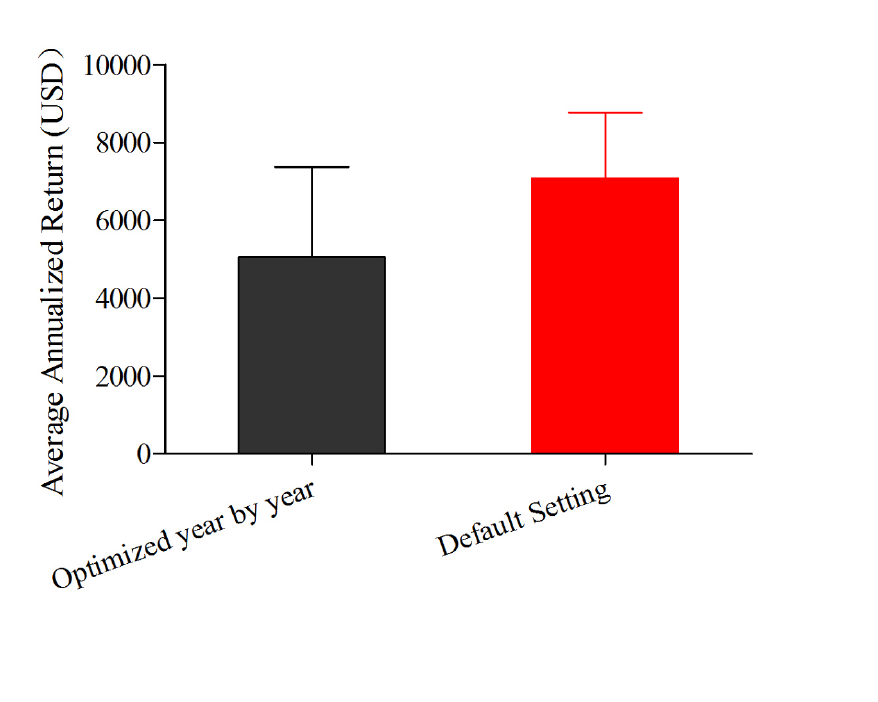
2.2.2 The annualized net profit of 2016, 2017, 2018, 2019, and 2020 was calculated with the optimized settings. Compared with the default setting, although the annualized return in 2016 was significantly higher, the overall profit was reduced by nearly 30% The details can be seen in Table 4 omitted

However, in the t test of the Average Annualized Return, there was no statistically significant between the two groups. t= 0.706, p=0.500 0.05) The details can be seen in Table 5 omitted

Figure 4 t test of the average annualized return of default setting

 Chart

Discussion

In Tendency Forex System, all the indicators are essentially using default settings. To our knowledge, over optimization is a major issue with most Algos, which can lead them to show excellent performance in the backtesting but then fail to work well in live forward trading. Too much data mining may be the problem. It more or less gets some results for example the 50 period Moving Average may be more sensitive for symbol A than symbol B but when you move from backtesting to a live forward test, this kind of system generally will not work. According to the statistical analysis, there is no value in optimizing the Tendency Forex System further.

Conclusion

To optimize an automated trading system, there are three essential things which should be kept in mind:

1. Fully understand its core logic and all the indicators included.

2. The quality of historical data feed: the higher the better.

3. Statistical analysis method must be used to measure the optimization result.

Free Trade Copy is available in FCA, Cysec, FINMA regulated Brokers.The Investor Compensation Fund is up to £85k, €20k, CHF 100k respectively.


Editors’ Picks

EUR/USD: US Dollar to remain pressured until uncertainty fog dissipates

EUR/USD: US Dollar to remain pressured until uncertainty fog dissipates

Unimpressive European Central Bank left monetary policy unchanged for the fifth consecutive meeting. The United States first-tier employment and inflation data is scheduled for the second week of February. EUR/USD battles to remain afloat above 1.1800, sellers moving to the sidelines.

GBP/USD softens to near 1.3600 as BoE hints further rate cuts

GBP/USD softens to near 1.3600 as BoE hints further rate cuts

The GBP/USD pair loses ground to near 1.3610 during the early Asian session on Monday. The Pound Sterling softens against the Greenback amid growing expectations of the Bank of England’s interest-rate cut. Traders will take more cues from the Fedspeak later on Monday.

USD/JPY drops back below 157.00 on Japan's verbal intervention

USD/JPY drops back below 157.00 on Japan's verbal intervention

USD/JPY has come under moderate selling pressure below 157.00 in the Asian session on Monday. The Japanese Yen lost ground to near 157.70 following Japan’s ruling Liberal Democratic Party's outright majority win in Sunday’s lower house election, opening the door to more fiscal stimulus by Prime Minister Sanae Takaichi. However, JPY buyers jumped back and dragged the pair southward on FX verbal intervention by Japan’s Finance Minister Katayama.


Editors’ Picks

USD/JPY drops back below 157.00 on Japan's verbal intervention

USD/JPY drops back below 157.00 on Japan's verbal intervention

USD/JPY has come under moderate selling pressure below 157.00 in the Asian session on Monday. The Japanese Yen lost ground to near 157.70 following Japan’s ruling Liberal Democratic Party's outright majority win in Sunday’s lower house election, opening the door to more fiscal stimulus by Prime Minister Sanae Takaichi. However, JPY buyers jumped back and dragged the pair southward on FX verbal intervention by Japan’s Finance Minister Katayama.

Gold eyes acceptance above $5,000, kicking off a big week

Gold eyes acceptance above $5,000, kicking off a big week

Gold is consolidating the latest uptick at around the $5,000 mark, with buyers gathering pace for a sustained uptrend as a critical week kicks off. All eyes remain on the delayed Nonfarm Payrolls and Consumer Price Index data from the United States due on Wednesday and Friday, respectively.

AUD/USD: Buyers eyes 0.7050 amid upbeat mood

AUD/USD: Buyers eyes 0.7050 amid upbeat mood

AUD/USD builds on Friday's goodish rebound from sub-0.6900 levels and kicks off the new week on a positive note, with bulls awaiting a sustained move and acceptance above mid-0.7000s before placing fresh bets. The widening RBA-Fed divergence, along with the upbeat market mood, acts as a tailwind for the risk-sensitive Aussie amid some follow-through US Dollar selling for the second straight day.

Top Crypto Gainers: Aster, Decred, and Kaspa rise as selling pressure wanes

Top Crypto Gainers: Aster, Decred, and Kaspa rise as selling pressure wanes

Altcoins such as Aster, Decred, and Kaspa are leading the broader cryptocurrency market recovery over the last 24 hours, as Bitcoin holds above $70,000 on Monday, up from the $60,000 dip on Thursday.

Weekly column: Saturn-Neptune and the end of the Dollar’s 15-year bull cycle

Weekly column: Saturn-Neptune and the end of the Dollar’s 15-year bull cycle

Tariffs are not only inflationary for a nation but also risk undermining the trust and credibility that go hand in hand with the responsibility of being the leading nation in the free world and controlling the world’s reserve currency.

RECOMMENDED LESSONS

5 Forex News Events You Need To Know

In the fast moving world of currency markets where huge moves can seemingly come from nowhere, it is extremely important for new traders to learn about the various economic indicators and forex news events and releases that shape the markets. Indeed, quickly getting a handle on which data to look out for, what it means, and how to trade it can see new traders quickly become far more profitable and sets up the road to long term success.

Top 10 Chart Patterns Every Trader Should Know

Chart patterns are one of the most effective trading tools for a trader. They are pure price-action, and form on the basis of underlying buying and selling pressure. Chart patterns have a proven track-record, and traders use them to identify continuation or reversal signals, to open positions and identify price targets.

7 Ways to Avoid Forex Scams

The forex industry is recently seeing more and more scams. Here are 7 ways to avoid losing your money in such scams: Forex scams are becoming frequent. Michael Greenberg reports on luxurious expenses, including a submarine bought from the money taken from forex traders. Here’s another report of a forex fraud. So, how can we avoid falling in such forex scams?

What Are the 10 Fatal Mistakes Traders Make

Trading is exciting. Trading is hard. Trading is extremely hard. Some say that it takes more than 10,000 hours to master. Others believe that trading is the way to quick riches. They might be both wrong. What is important to know that no matter how experienced you are, mistakes will be part of the trading process.

Strategy

Money Management

Psychology

Best Brokers of 2025