How i look for trade setups

I first started writing this article at the end of July to show you a before and after chart of 1 gold and 1 natural gas trade I took, but ended up providing a lot more than that! So I then decided to put it on hold for a while as I added more content in order to make it an educational article for those who are interested in how I look for trade setups. There are lots of lessons in this, so I hope you take something on board!
There are lots of before and after charts in this article. I have included some examples of the trades that haven't worked towards the end. My intention is to provide you some ideas about how to look for trades, manage the risk while in a trade and how to exit etc.
July was a great month and the start of August has been equally good. The fact that FX, precious metals and a few other markets have been trending has made it easier to trade – and luckily I have been in sync with the markets. My style of trading is not particularly suited for range-bound market conditions.
Anyway, please find below some before and after examples, along with the rationale behind each trade idea.
Example: Gold part 1 (23rd July 2020)
As some of you already know, I have been bullish on gold for a long time. In fact, in 2019, I predicted that gold would hit $2,000 at some point in 2020. You can read my then comments for example in HERE. I have also created a couple of YouTube videos on gold and silver recently, which contain a lot of insights on precious metals and trading in general. You can watch them HERE, HERE and HERE.
This particular trade setup was one of the several trades I issued on gold during July for my subscribers. I have chosen to share this particular one here because it was based on H1 time frame, as Daily was up on several straight days. So, this can be seen as an example of how I chase momentum sometime. I do this by zooming in to lower time frames. When momentum is strong, you won't get deep pullbacks. That's why I wasn't looking at the daily in this case.
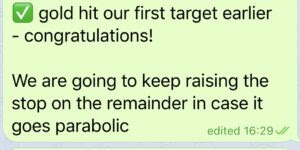
When I issued this trade, this is what I wrote in the Telegram group:
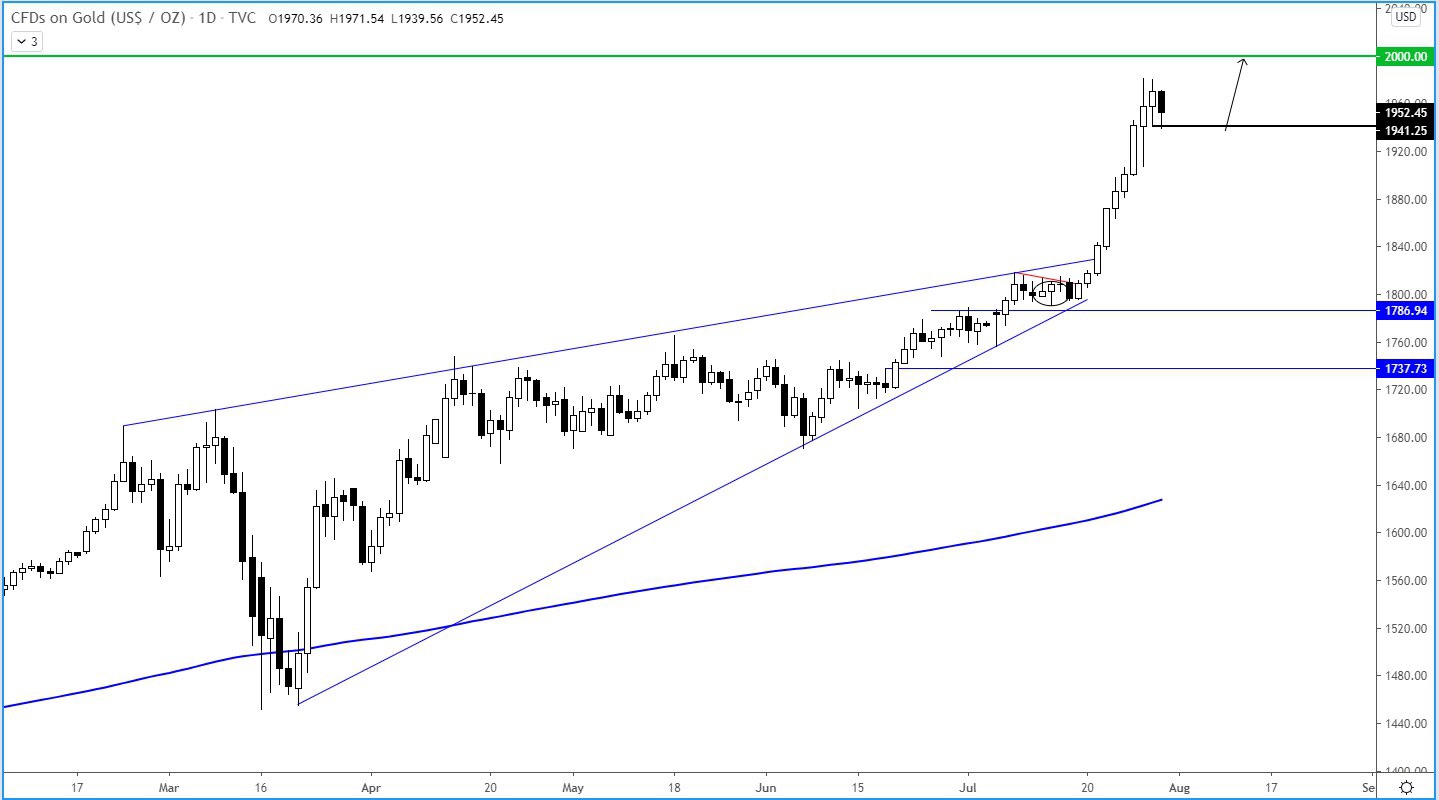
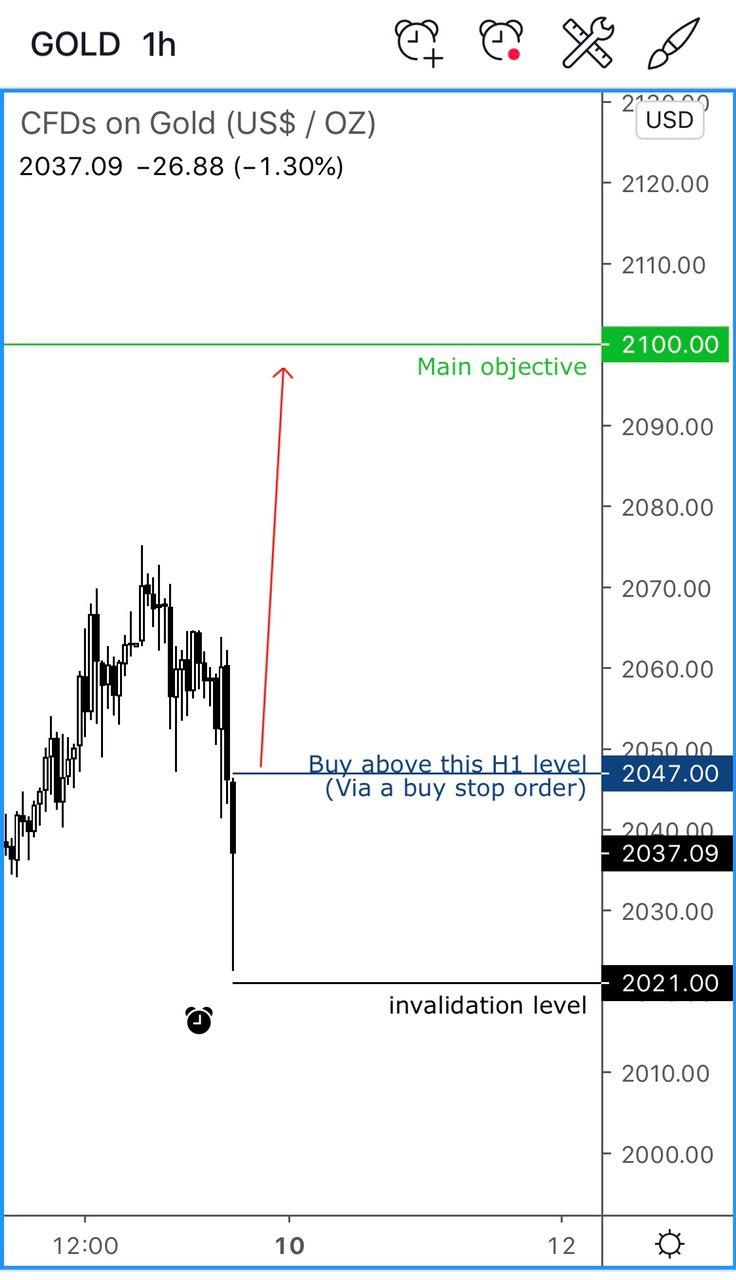
I wanted to wait for a deeper pullback but gold has had minor retracements instead, suggesting a very strong bullish trend.
With prices very close to the all-time high of $1920, i think it will break through it in the coming days. So, make sure you leave a portion of your trade open, assuming you get on board and price hits our first objective.

Source: TradingCandles.com and TradingView.com
Shortly after issuing the trade idea, the metal ent a little bit deeper into the support zone before starting to push higher:

Source: TradingCandles.com and TradingView.com
Shortly afterwords...
Source: TradingCandles.com and TradingView.com
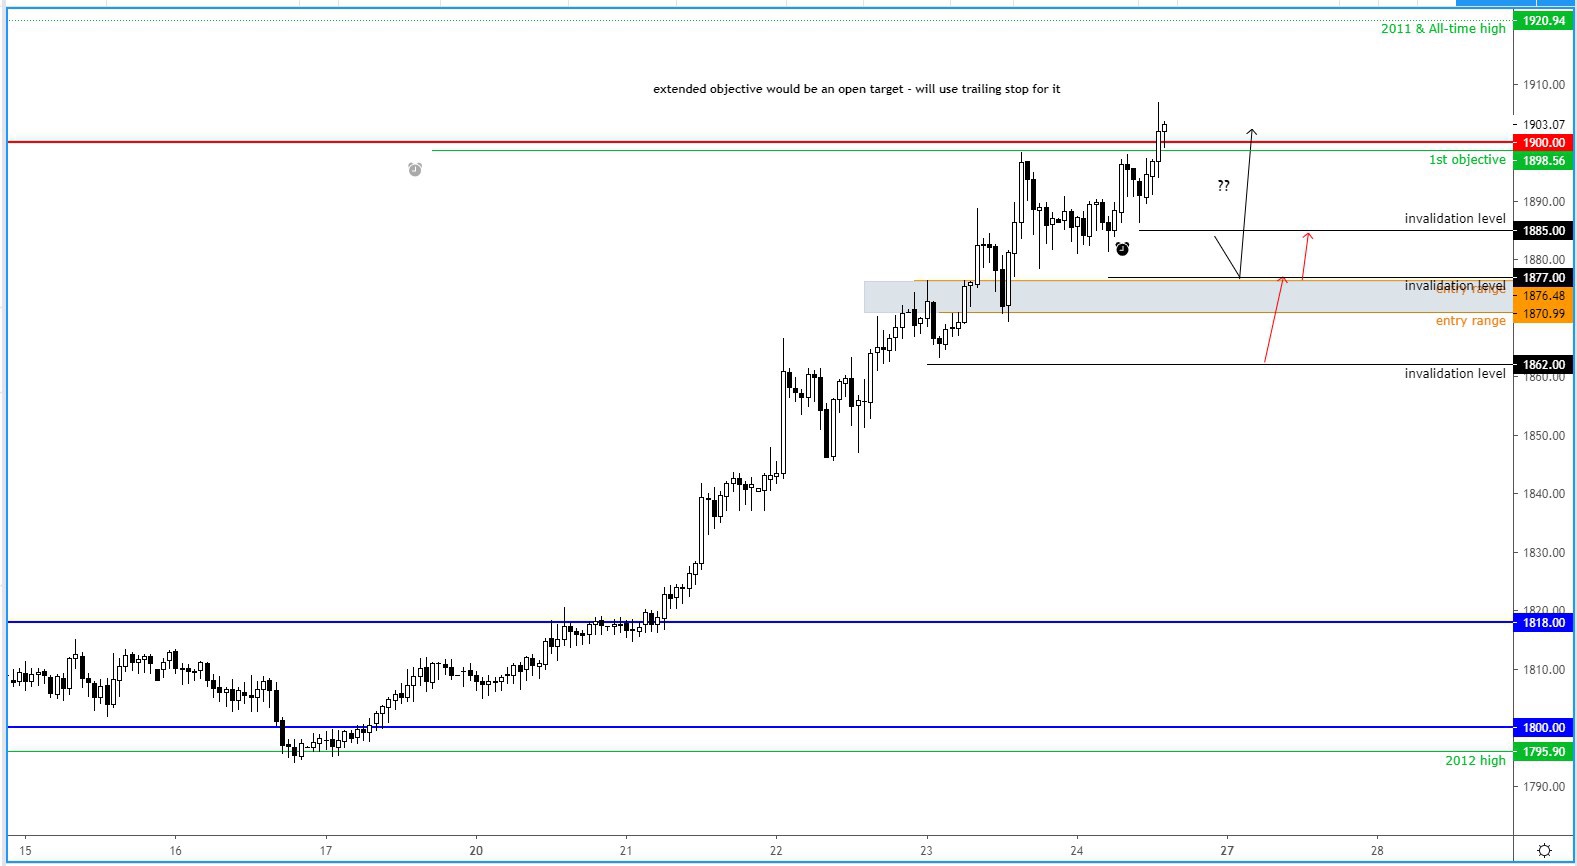
As planned, I provided the following update:
Gold update: time to move the stop on the remainder of this below the most recent H1 low – after prices broke sharply higher again overnight. We will be pushing this higher and higher until prices reverse to close us out. The reason we have an open target is that no one knows how high gold will get before reversing back. So we are just gonna let gold go as high as it can, but at the same time be prepared to exit on a any weakness, by keeping our stop at a reasonable distance from market.

Source: TradingCandles.com and TradingView.com
Unfortunately the rally halted and prices retreated to take us out on the remainder of the position, but it still provided for a handsome profit:
Source: TradingCandles.com and TradingView.com
Example: Gold part 2 (30th July 2020)
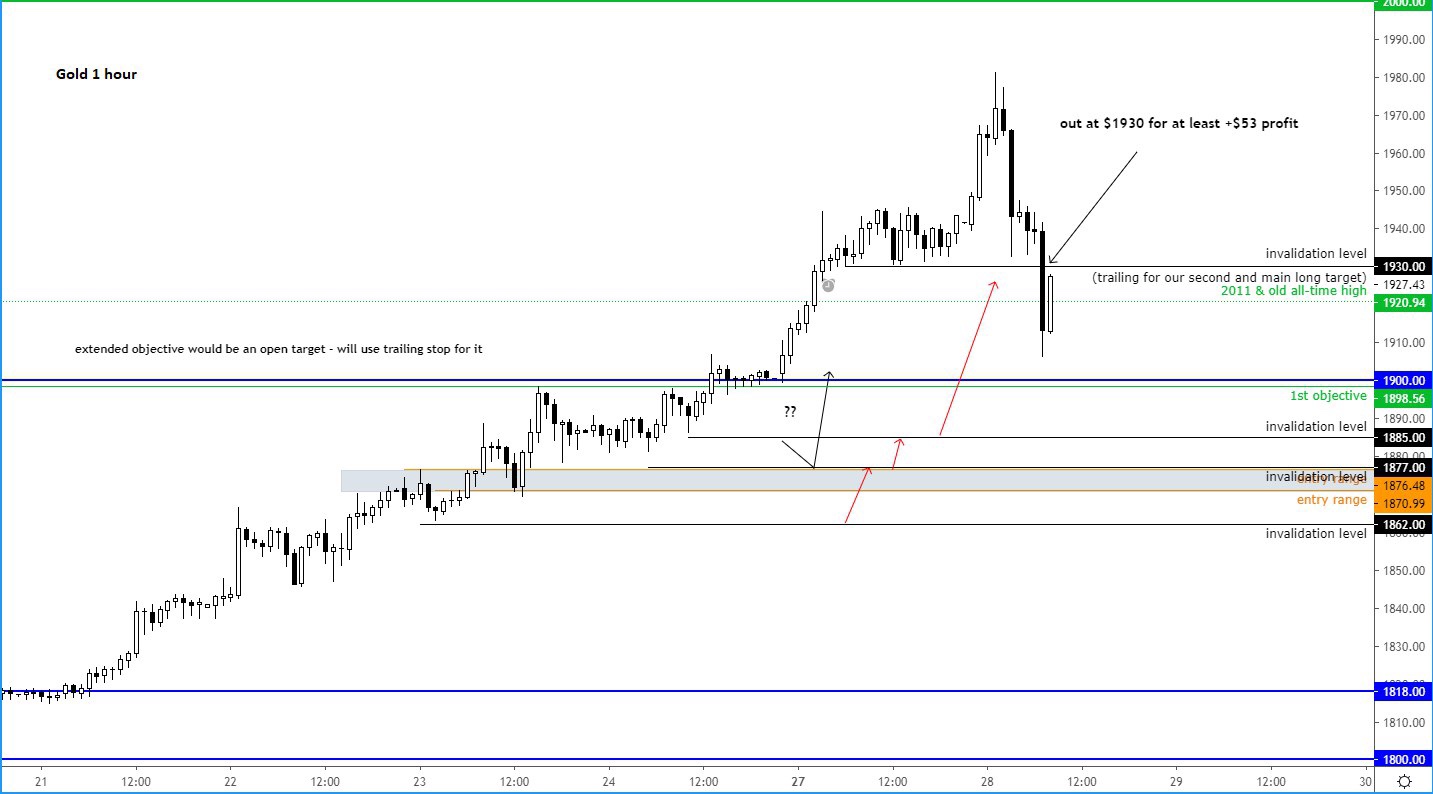
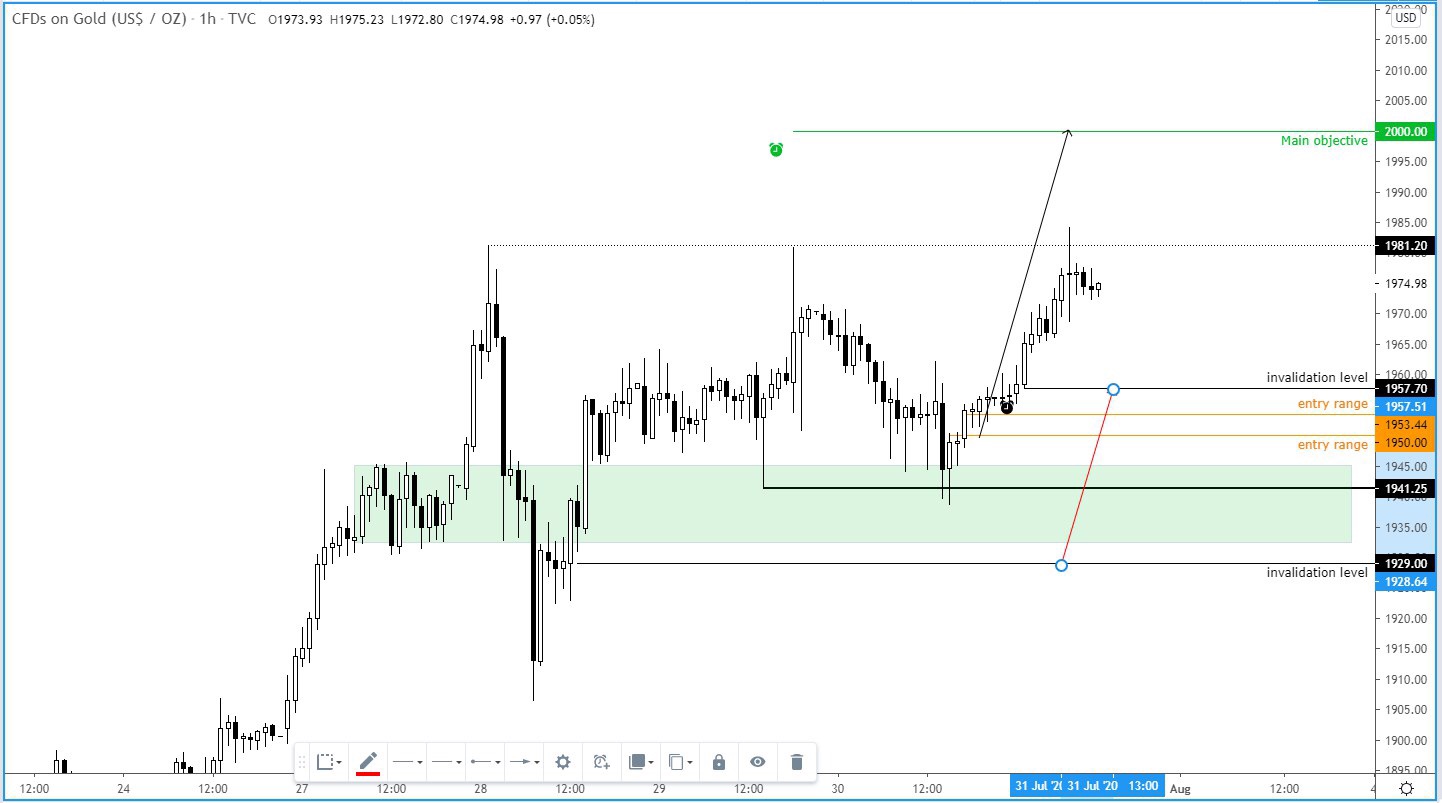
Following the successful trade above, we issued a similar setup which also worked successfully. On the hourly, it looked like this:
Source: TradingCandles.com and TradingView.com
The shaded region was support and resistance in the past. So when it came back to retest it, we issued a long trade signal.
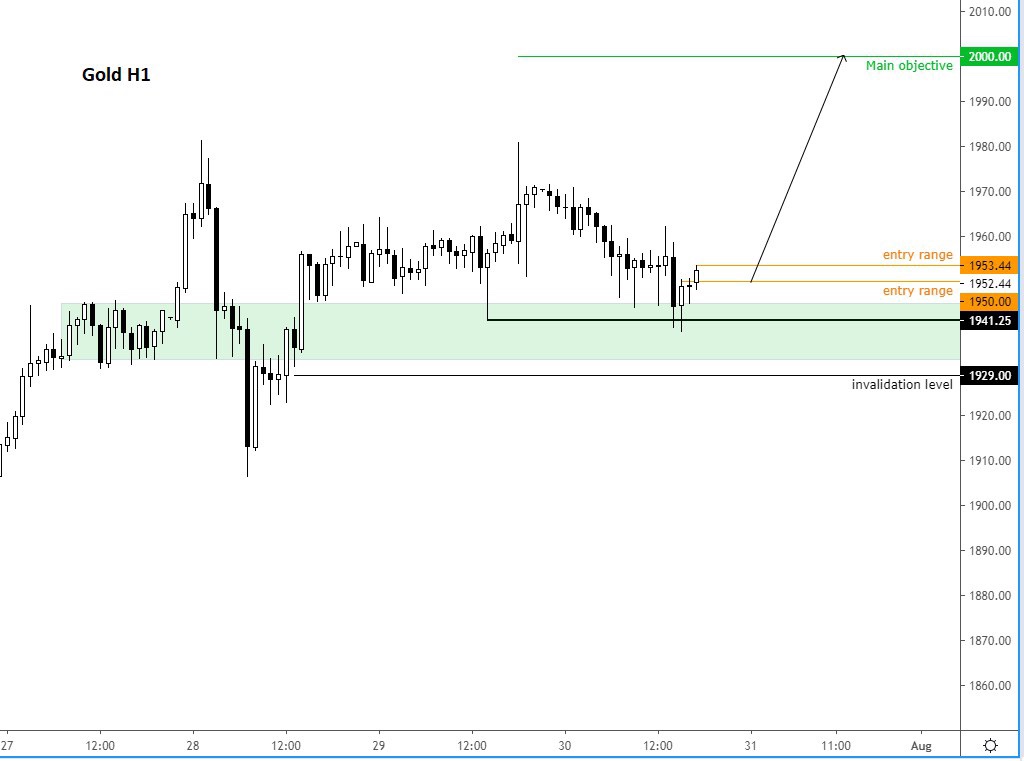
The idea was based off the daily chart, below. Gold had gone below the prior day's low, took out the weaker hands, then rebounded. So my thinking was that the earlier weakness was most likely a sell trap/run on stops of weaker longs. This is very typical of very strong trends, which in the case of gold was just that:
Source: TradingCandles.com and TradingView.com
I added that if I was correct, then a new high should be hit during Asian hours and potentially get to 2K before the week was out...
Source: TradingCandles.com and TradingView.com
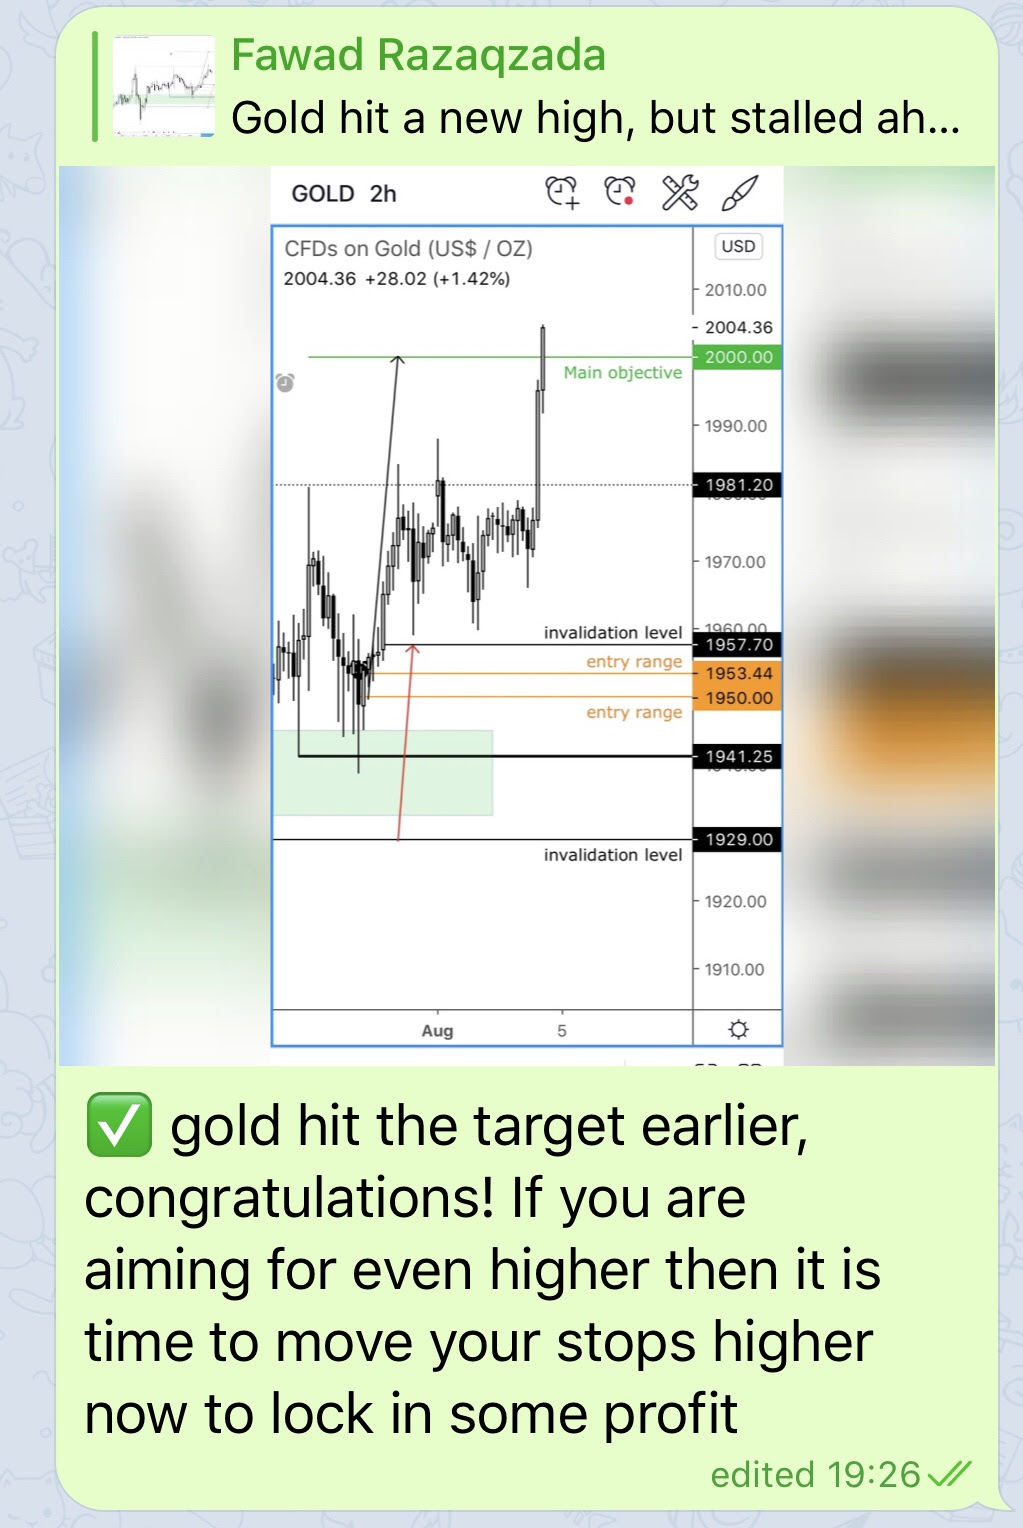
Well, the metal did indeed rise and reached a new high but stalled, prompting me to adjust the stop loss higher as part of our risk management strategy, which you can learn more about HERE. This is what I wrote in the group:
Gold hit a new high, but stalled ahead of our 2K target... so it is time to move the stop higher to remove the risk in case it goes lower again...
But it didn't:
Obviously, it isn't just gold trades that I look for, as you will see below.
Example: Natural Gas part 1 (29th July 2020)
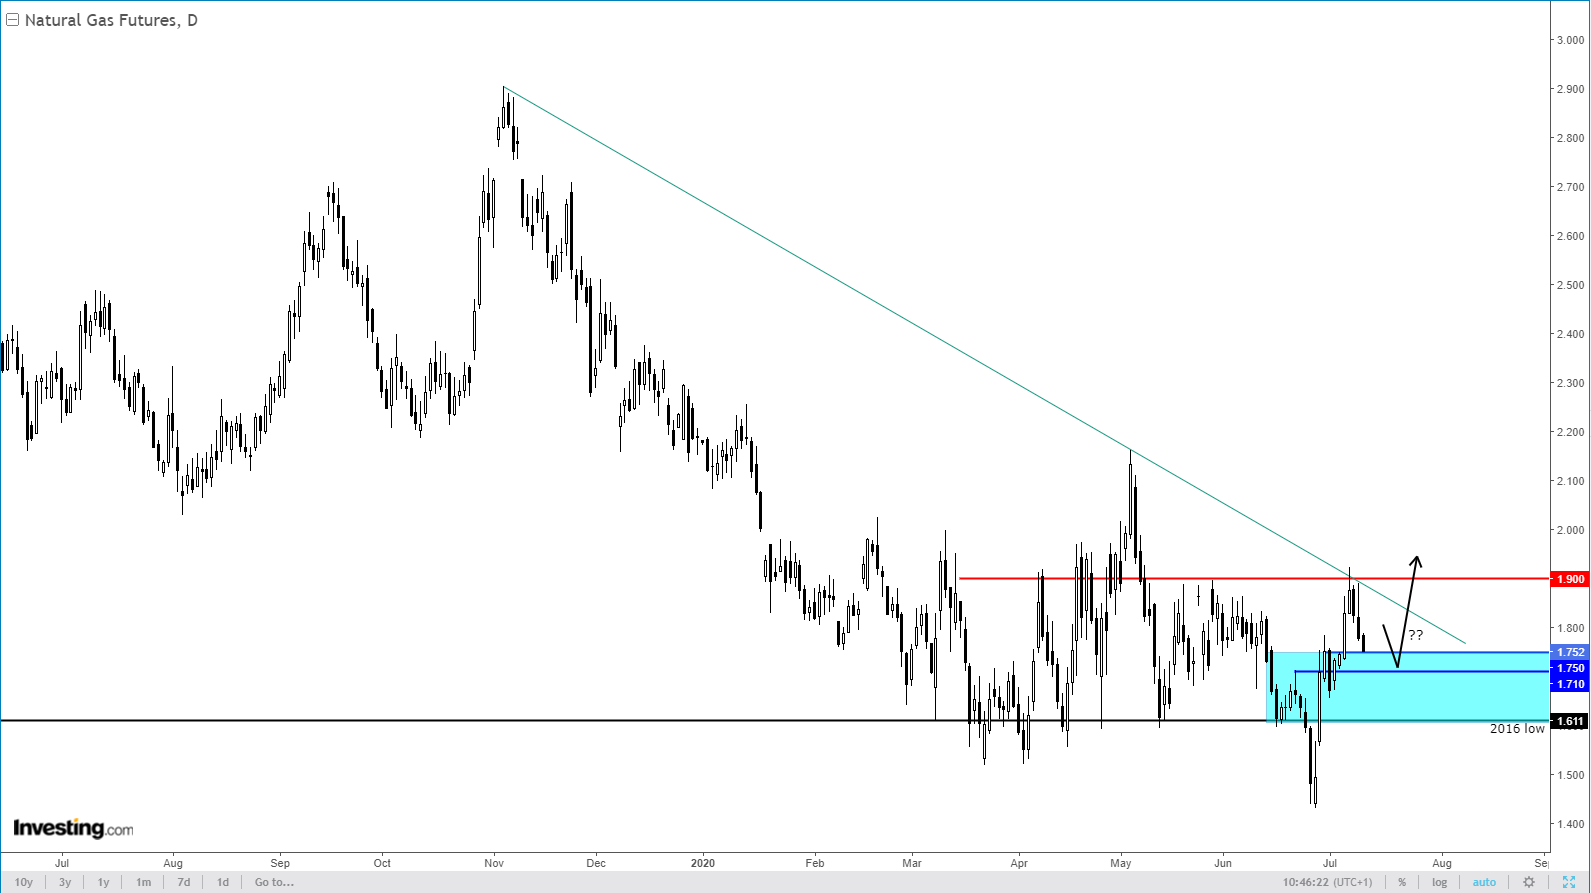
Natural gas has played out beautifully for bullish speculators in recent times, following the big sell-off earlier in the year. I first wrote an article for Investing.com, highlighting its potential to rise sharply HERE in early July. You can read the commentary by following the link, but these were the charts that I shared there:

Source: TradingCandles.com and Investing.com
Source: TradingCandles.com and Investing.com
I shared a similar chart on twitter HERE and for my subscribers in the Telegram group, only by now the market had created a clear bullish signal on the daily after bouncing back from the above green shaded support area:
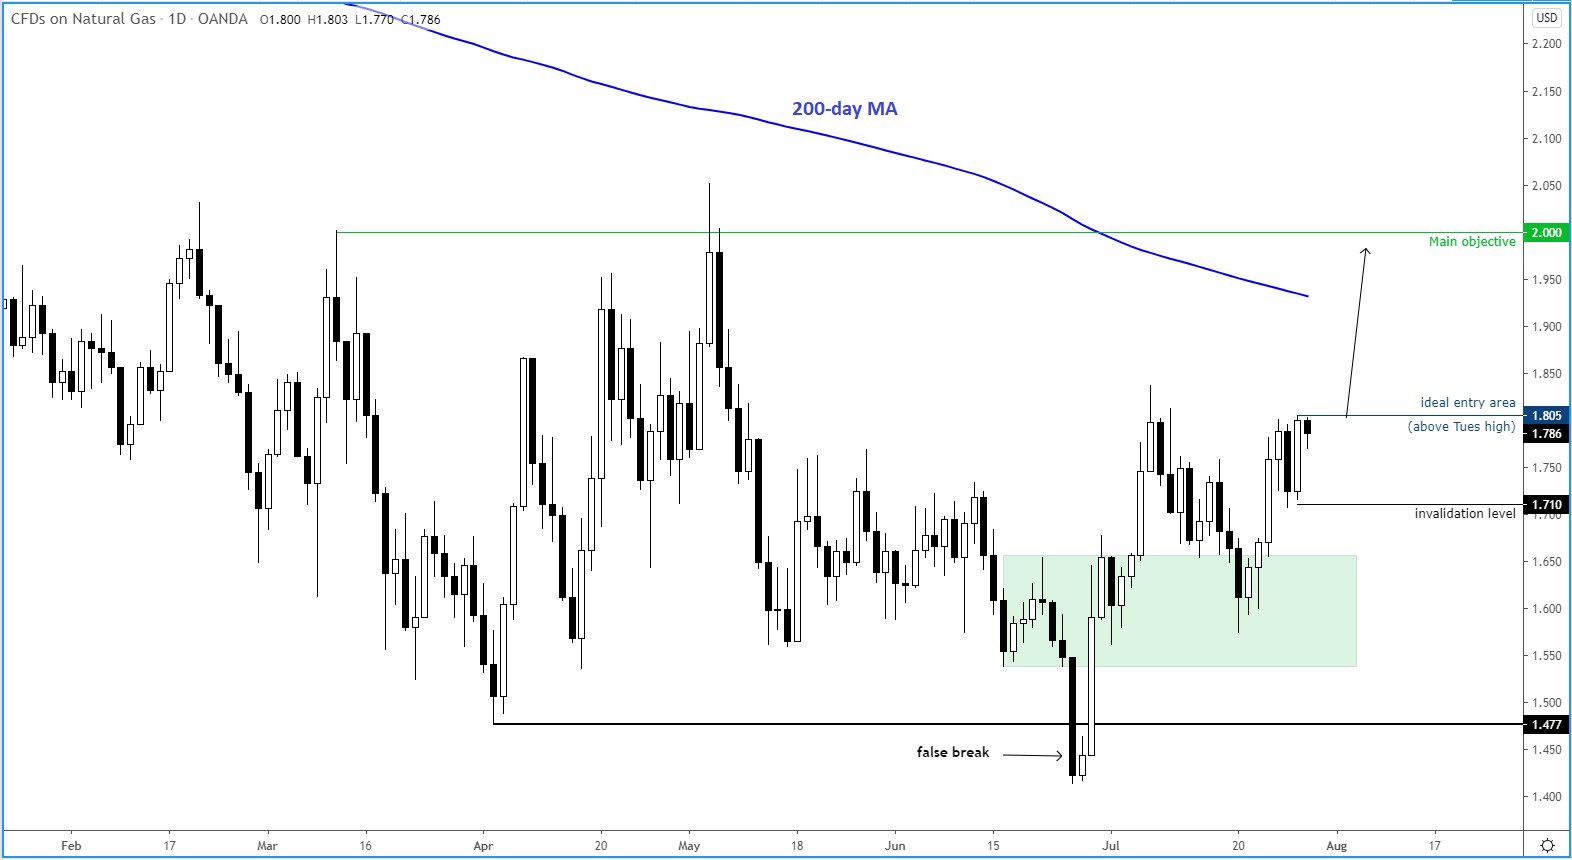
Source: TradingCandles.com and TradingView.com
The fact price was respecting support and showing signs the bears were getting trapped, prompted me to issue the above signal.
This was the outcome a couple of trading days later:
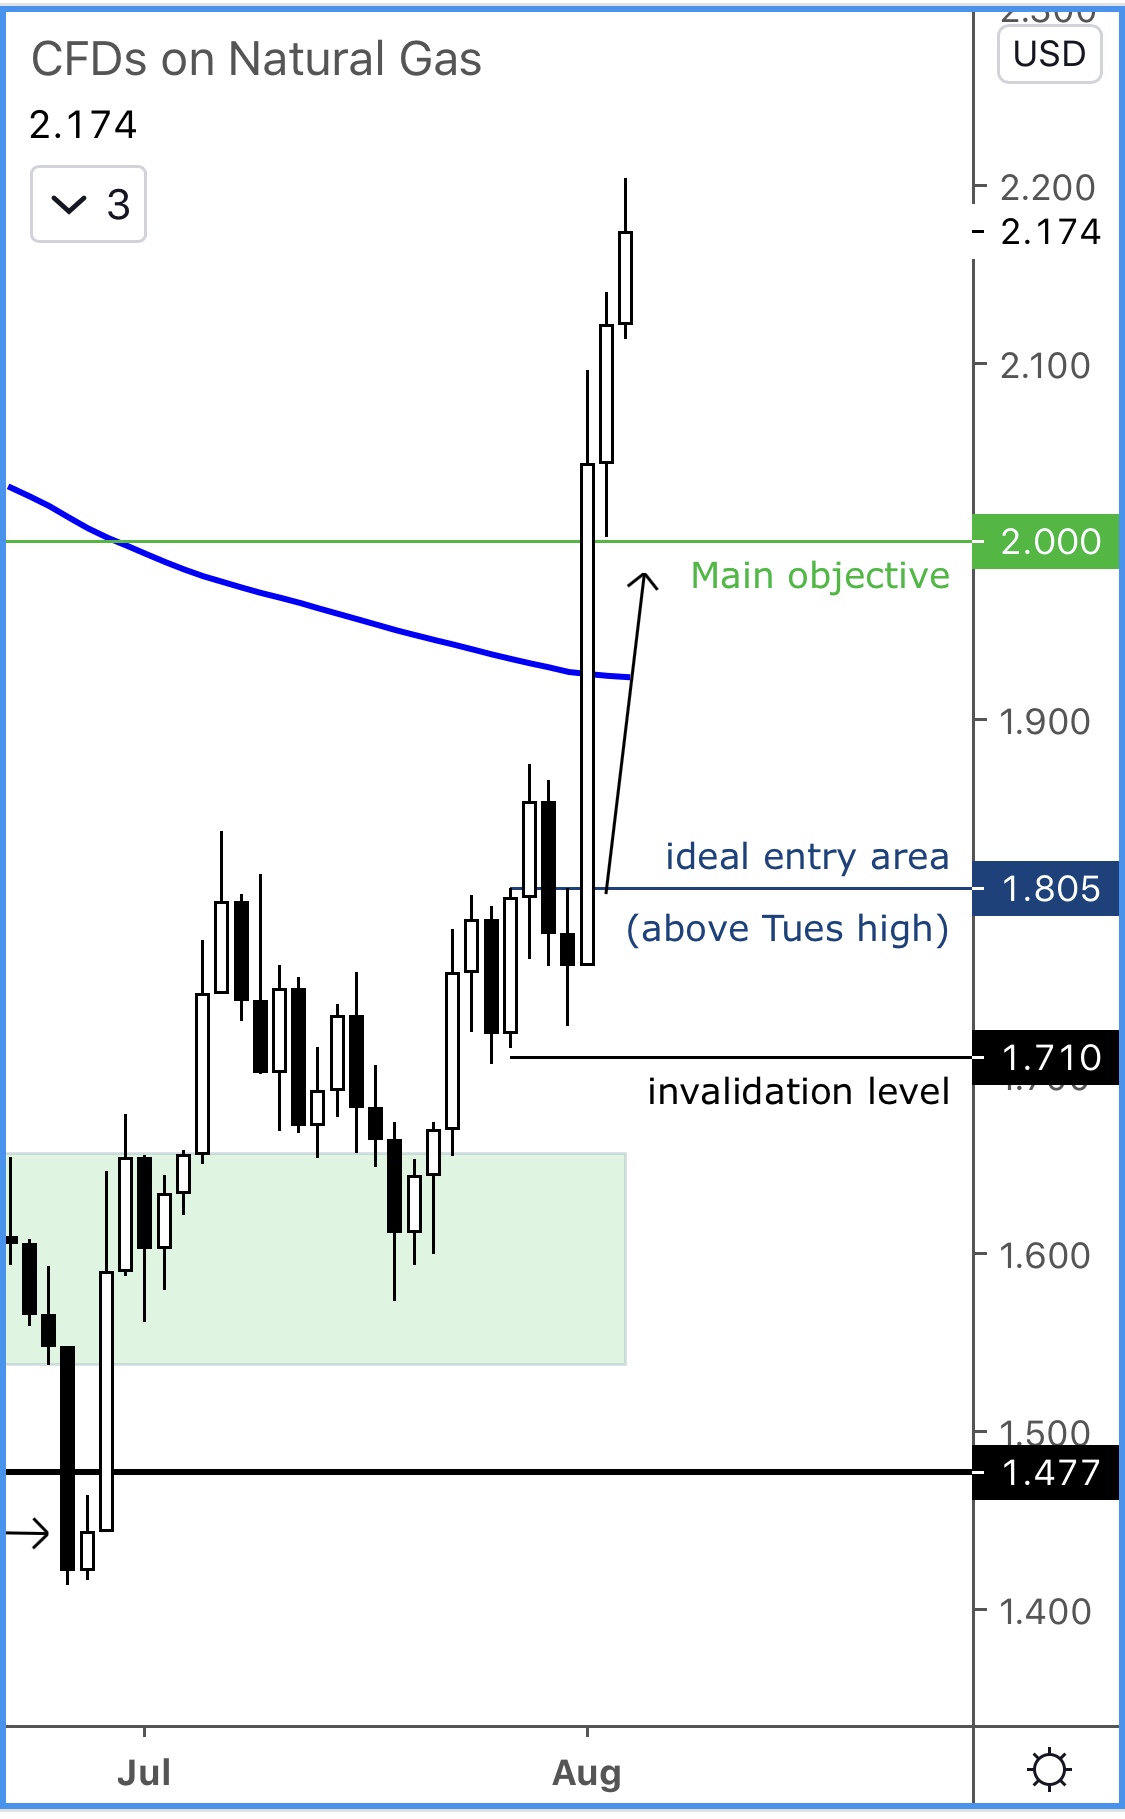
Source: TradingCandles.com and TradingView.com
The above trade was both fundamentally driven and based on technical factors too. Fundamentally, hot weather was expected to boost demand for NG, while the bearish factors had been priced in by recent weakness. Also, crude oil had already been rising, boosting investors' appetite for other energy-linked assets. Technically, there was a clear false breakout reversal pattern when prices failed to hold below the old low. You can learn more on false breakouts in THIS video.
Example: Natural Gas part 2 (29th July 2020)
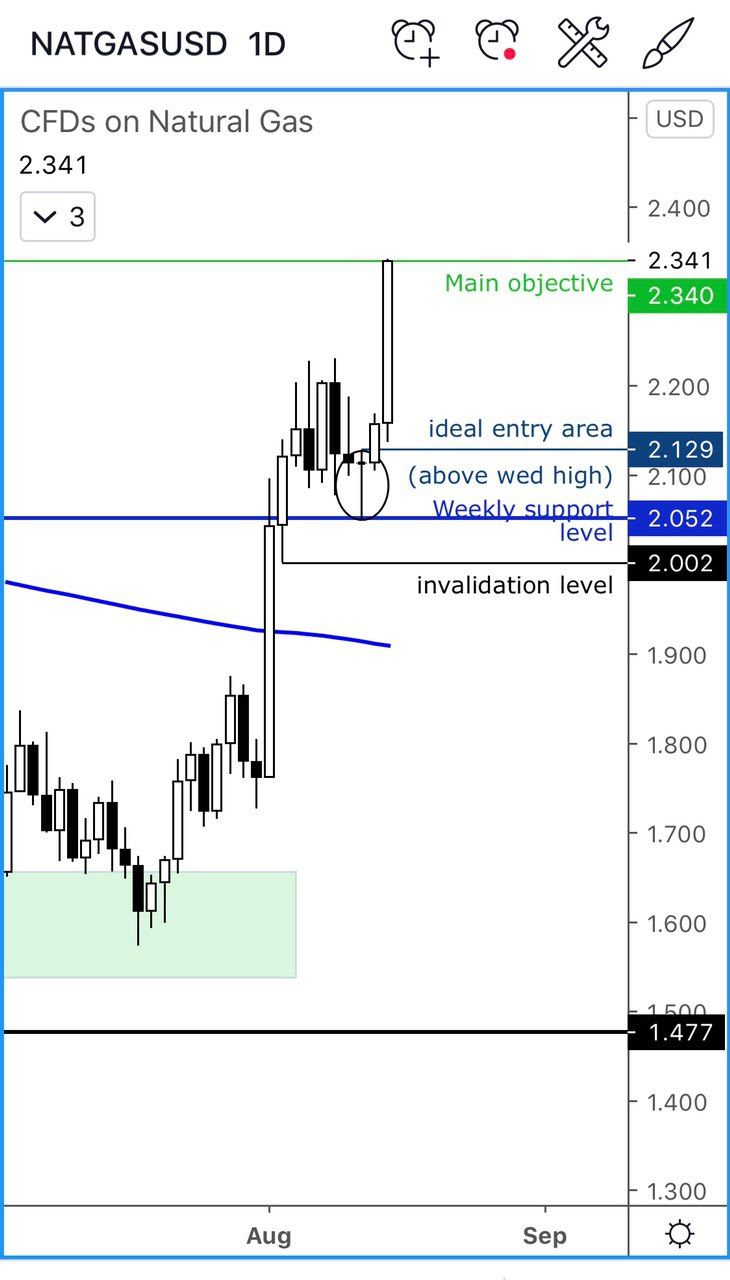
Following the successful trade on natural gas previously, the weekly chart displayed a big breakout candle and crucially it held above THIS weekly support level:
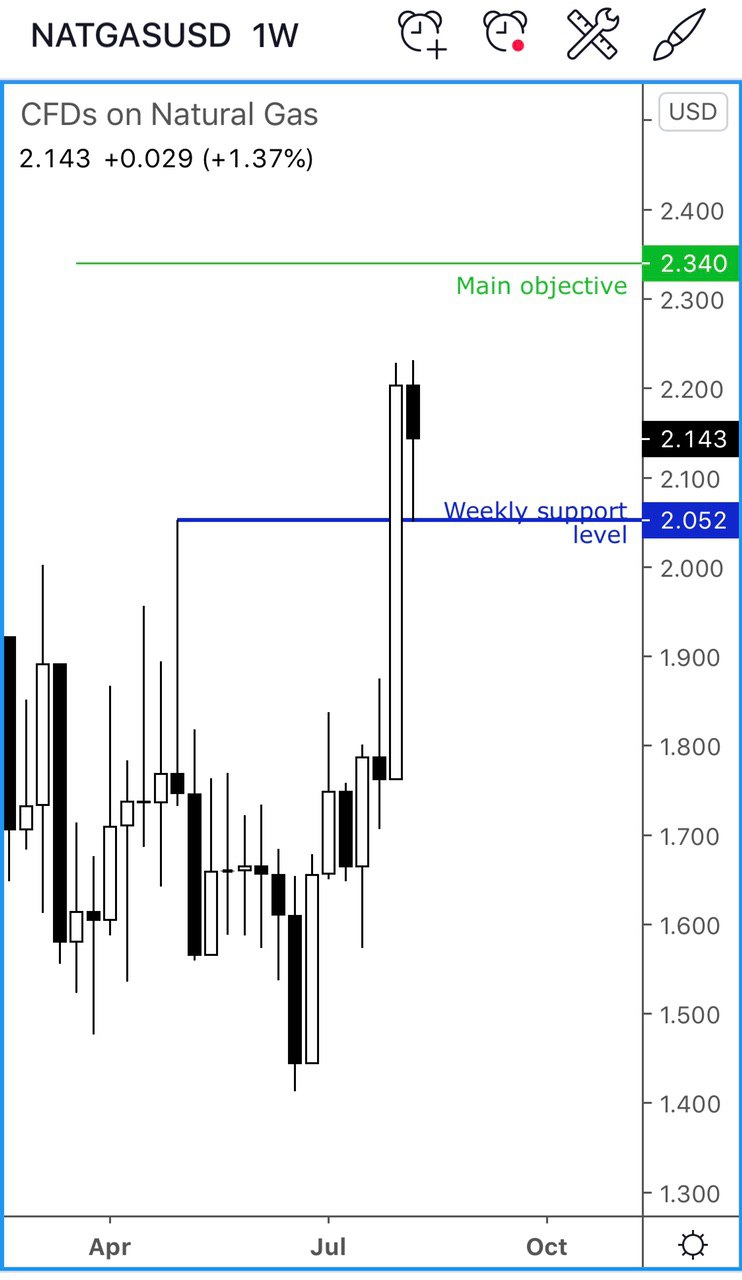
Source: TradingCandles.com and TradingView.com
I wrote in the group...
So far this week, NG has consolidated but I think it is now ready to go higher again. it held the weekly support level at 2.05 following yesterday's pullback.
I then shared the following trade idea and the accompanying daily chart:
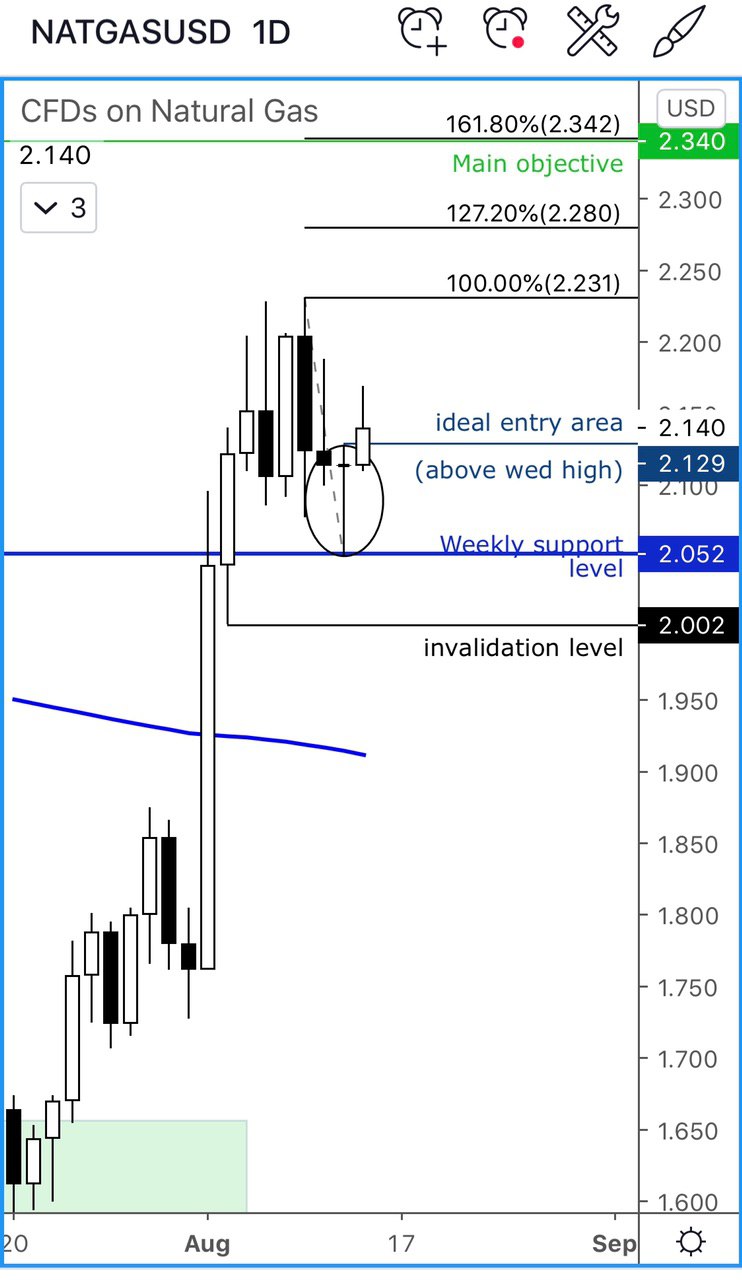
Source: TradingCandles.com and TradingView.com
Natural gas long trade idea. On the daily, it formed a doji candle yesterday. So the idea is to go long on the expected momentum that should ideally come in today above the doji candle. The invalidation is below the weekly support level, in case it decides to come back down one more time then go up. But if and when it creates a new high above last week's high then we can move the stop higher. The target is based on 161.8% fib extension of the retracement from last week's high
This trade worked beautifully and we did see the burst of momentum I was expecting on the very next day, as it hit the target:
Source: TradingCandles.com and TradingView.com
As mentioned, FX has also been trending thanks to the sell-off in the dollar. So, I have concentrated on selling the buck against the other major currencies. Some trades like the USD/CAD and USD/JPY short worked perfectly, although I have also had a loser during this period – it think was the cable.
Example: USD/CAD (4th Aug 2020)
This was the rational behind the short USD/CAD trade and the chart on which the idea was based on:
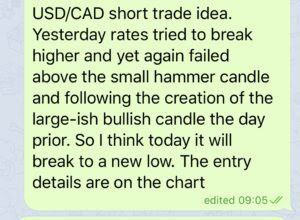
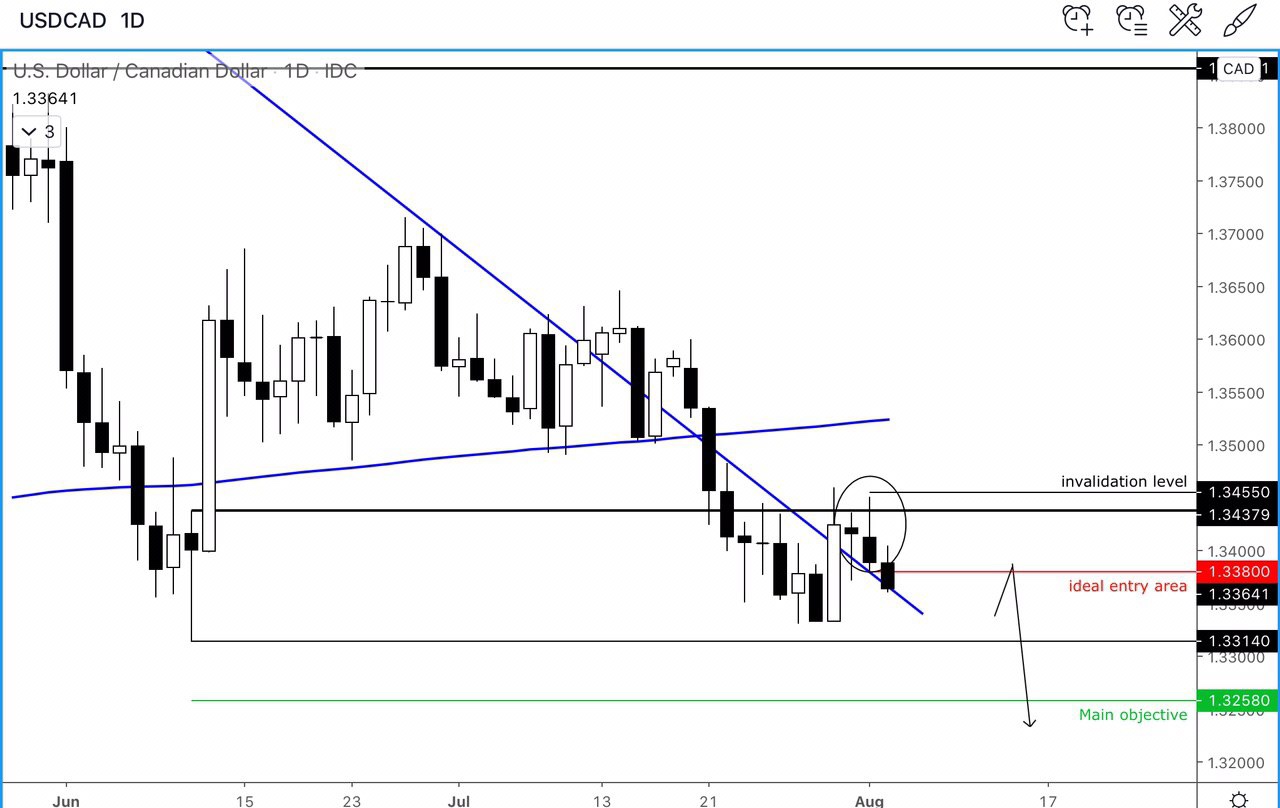
Source: TradingCandles.com and TradingView.com
And the outcome:
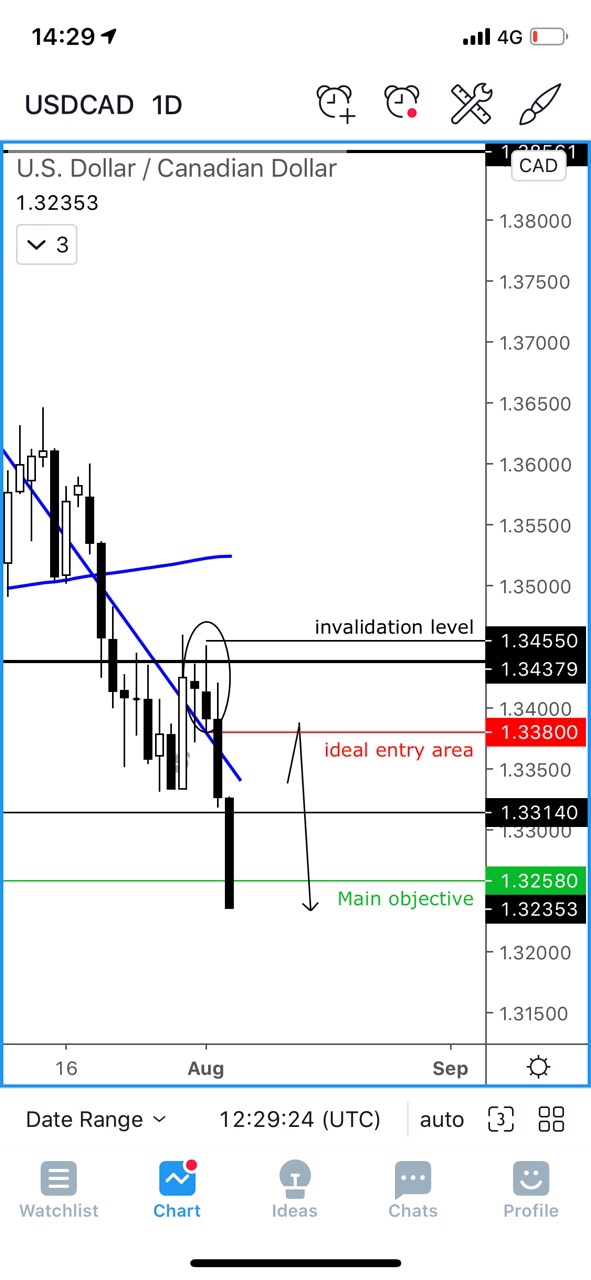
Source: TradingCandles.com and TradingView.com
Example: USD/JPY (24 July 2020)
I wrote an article on the USD/JPY for investing.com HERE and turned that idea into a trade signal – this is the chart I shared and what I wrote in the group:
USDJPY Daily chart looks like it might be about to break lower following today's breakdown below short-term support around 106.70

Source: TradingCandles.com and TradingView.com
Based on the above daily chart, this was the breakdown on the hourly, with the attached entry and exit details:
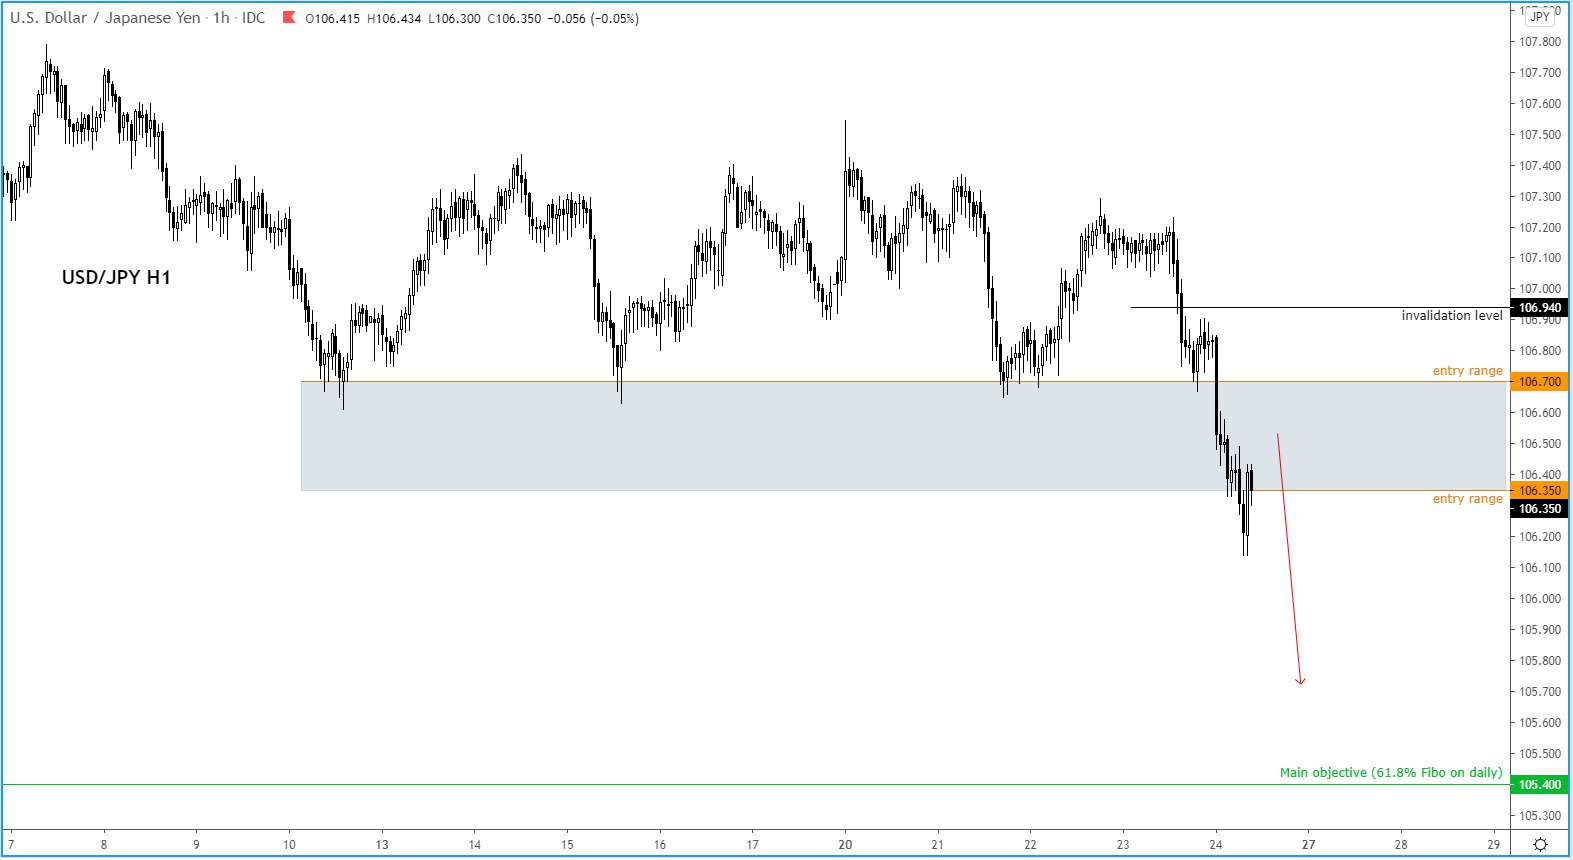
Source: TradingCandles.com and TradingView.com
For the trade, the invalidation was above the most recent H1 congestion zone above that broken 106.70 level. There was no reason for price to revisit this area if the trend was indeed as bearish I had envisaged, which luckily was the case:
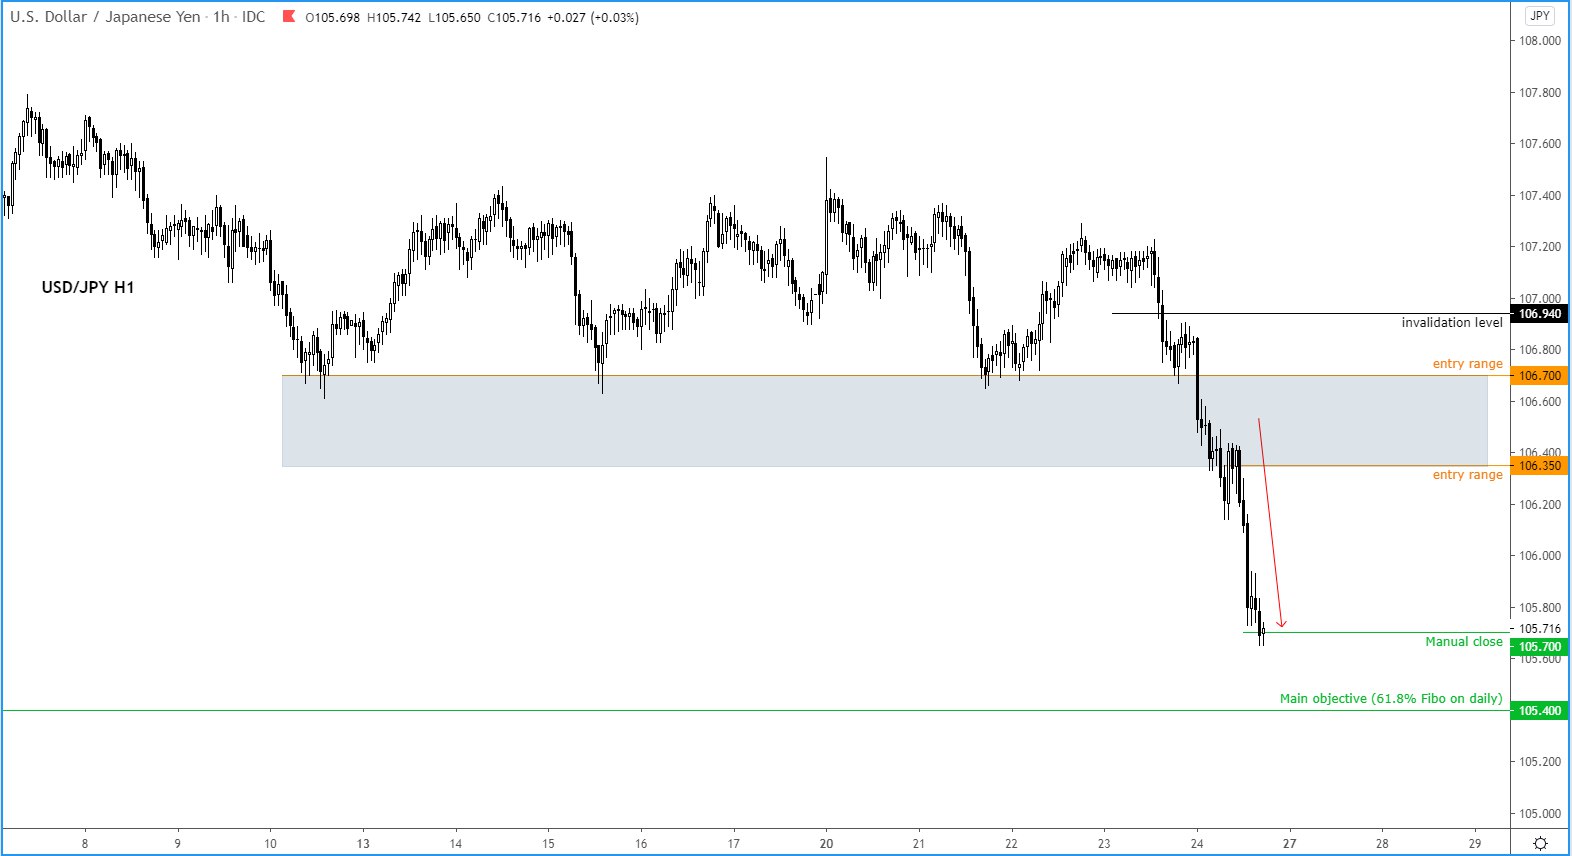
Source: TradingCandles.com and TradingView.com
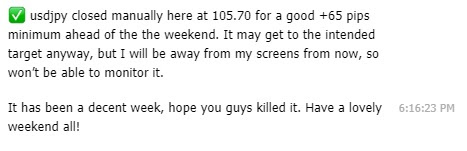
It was getting late on the day with the weekend approaching, so I decided to close it manually ahead of the target (which as it turned out would have hit in the following week):
Example: GBP/USD (5 Aug 2020)
GBP/USD was in a strong up trend so this is the idea I shared in the group on August 5:
GBPUSD long trade idea straight off the daily chart. The trend is bullish and we are going with the trend. The GBPUSD spent the last 3 days pulling back only a little bit from the high, suggesting the bull trend remains strong. The day before, it created a hammer-like candle and today poked above it. So the idea here is to go long with the invalidation being the low of the day before. We are targeting the liquidity above the old highs. So our first target is the high above 1.32 then subsequent target is the 1.33 handle. If/when the first objective is hit make sure to move stop above entry to lock in some profit for the remainder of the trade.
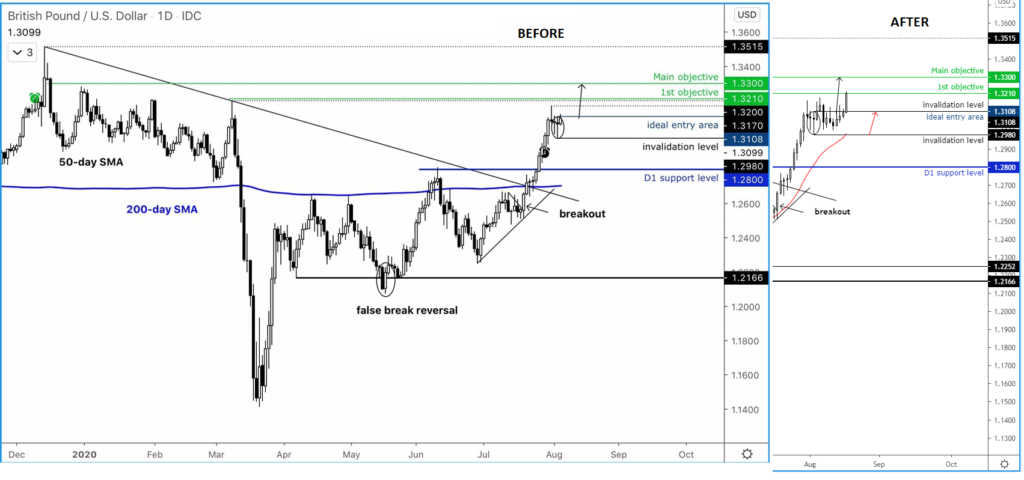
The GBP/USD took its sweet time but eventually hit the target on 18th Aug as per the chart above. Sometimes the markets move to your target or stop loss immediately, sometimes they take time. Trading is not like you put ‘X' amount of effort and you should be rewarded ‘Y' at ‘Z'.
We obviously had a few trades that didn't work out, and here are a couple of examples:
Example: Brent crude oil (22nd July 2020):
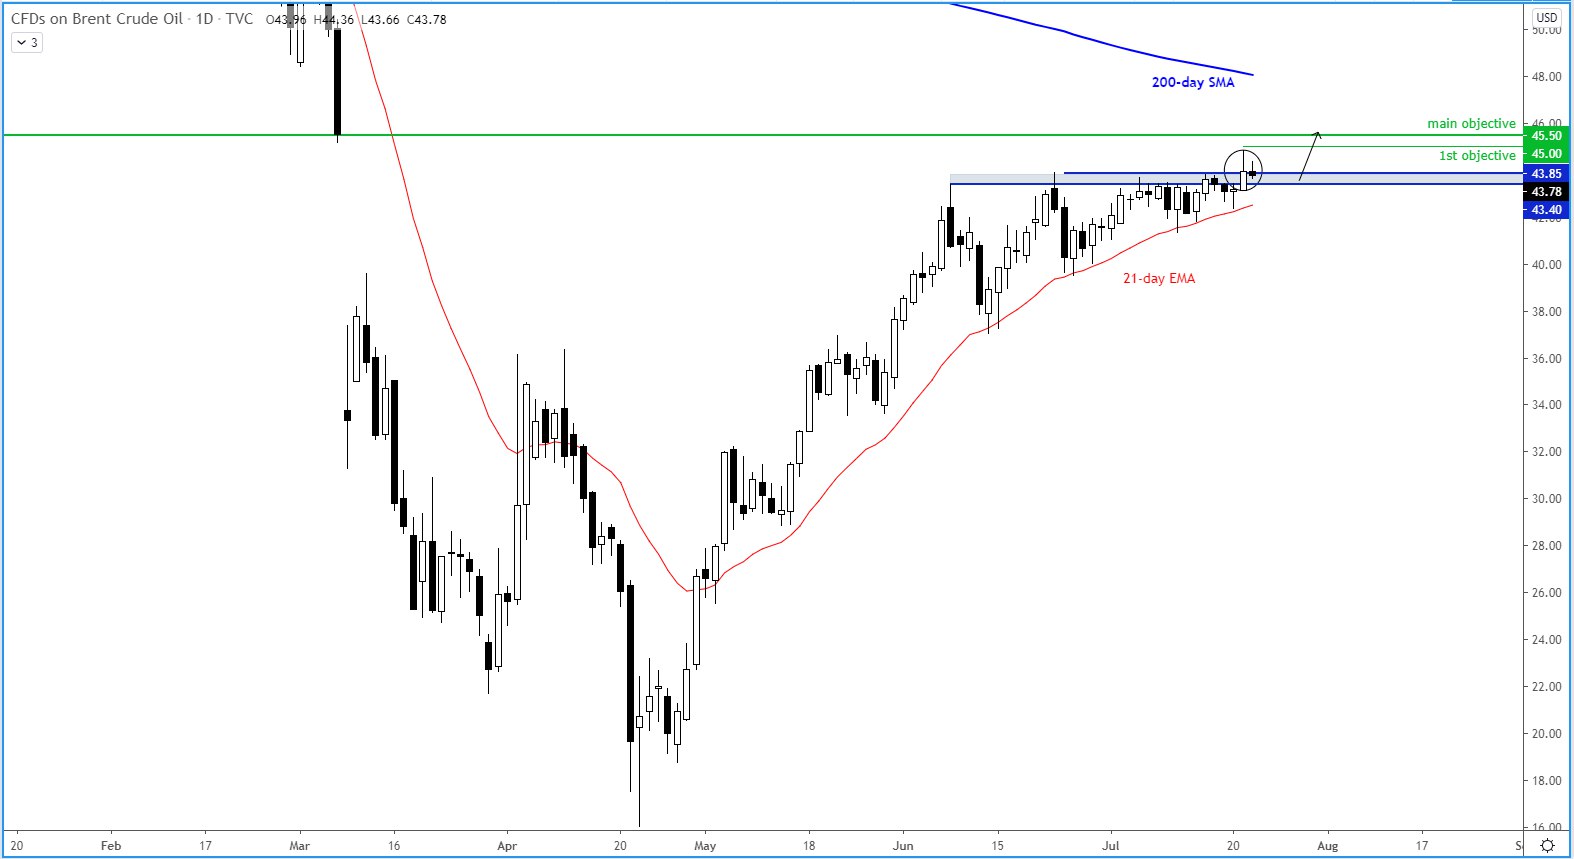
Following a successful trade on Brent earlier in the month, I was looking to get long again after prices retreated to THIS daily support area:
Source: TradingCandles.com and TradingView.com
Source: TradingCandles.com and TradingView.com
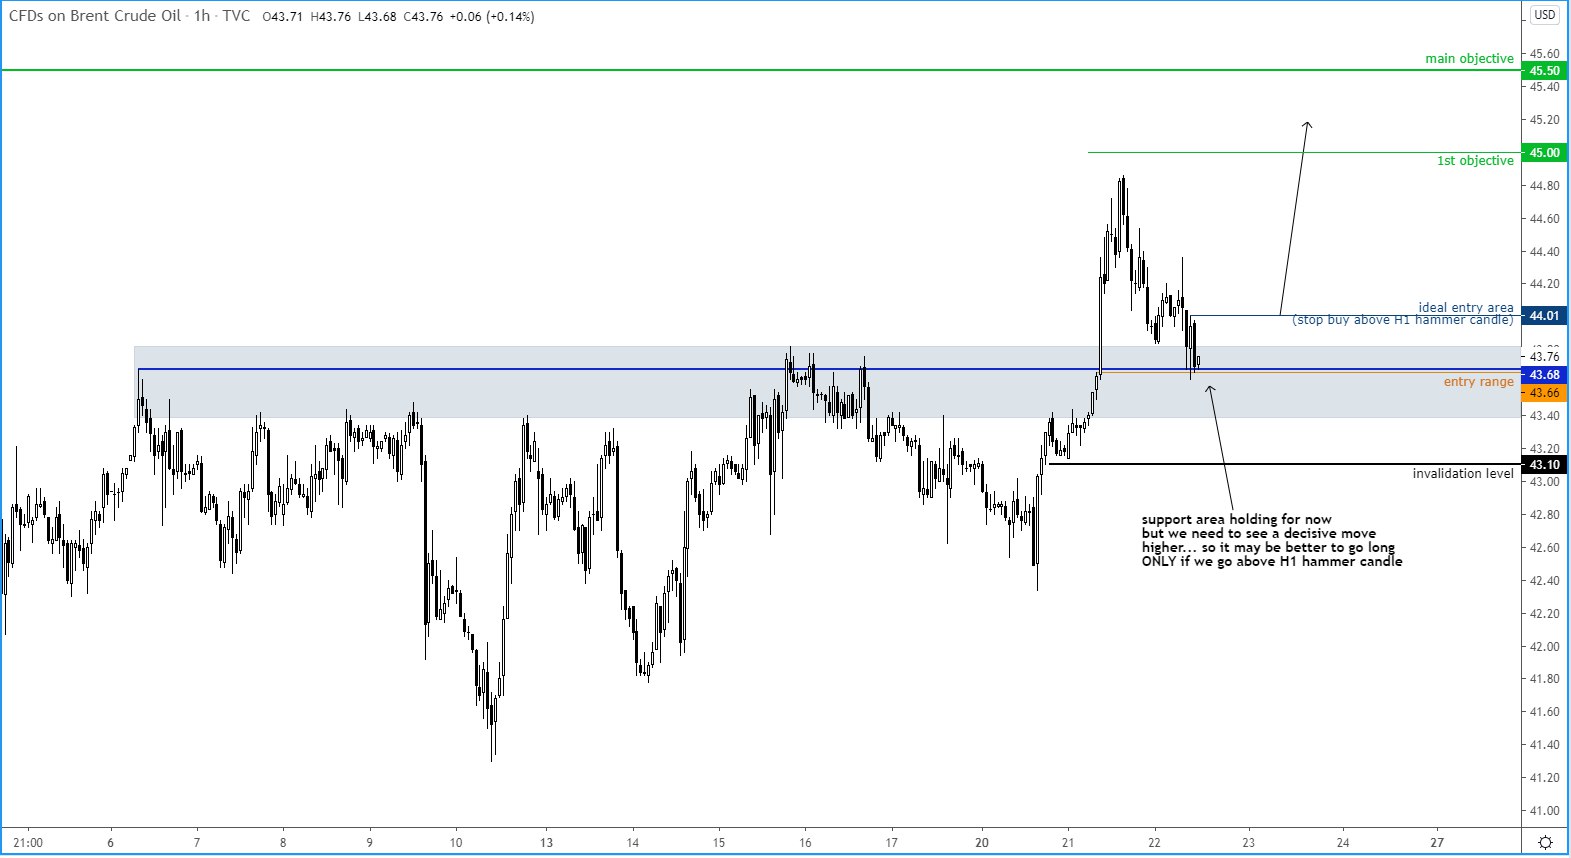
Brent H1 chart shows a trade idea based on the daily setup. For confirmation you can look to get on board above the hourly H1 candle... if you feel aggressive and don't want to wait for confirmation, you may also consider taking a position here... I will wait for confirmation personally and will be setting order to go long upon break of 44.00
Brent oil decided to pull back deeper before rallying to the main target, thus stopping us out in the process:
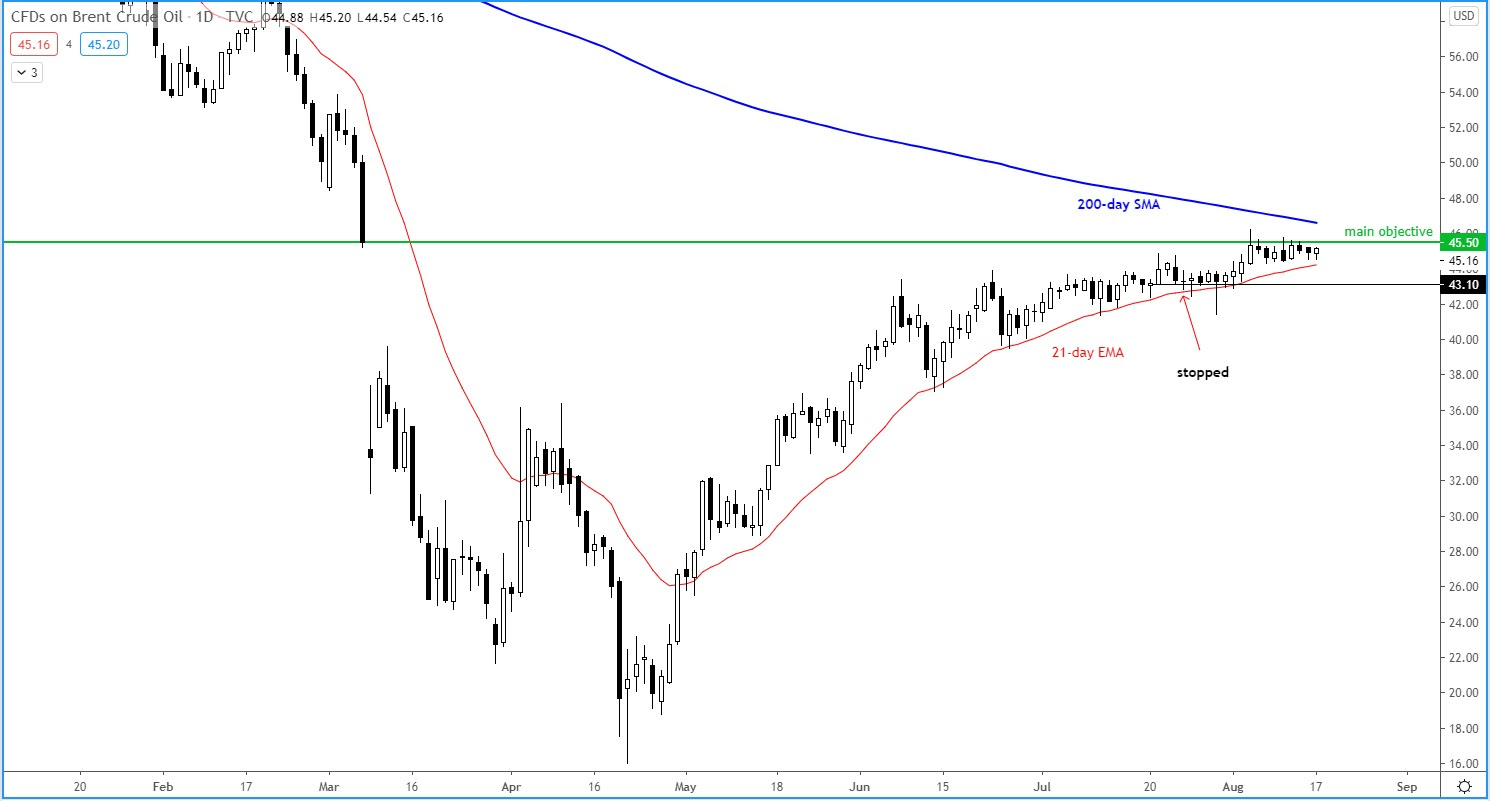
Source: TradingCandles.com and TradingView.com
Example: Gold (7th Aug 2020)
We took losses in a few trades and THIS gold trade idea was among them. My thinking was that THIS breakdown was a stop out rather than a reversal:
Source: TradingCandles.com and TradingView.com
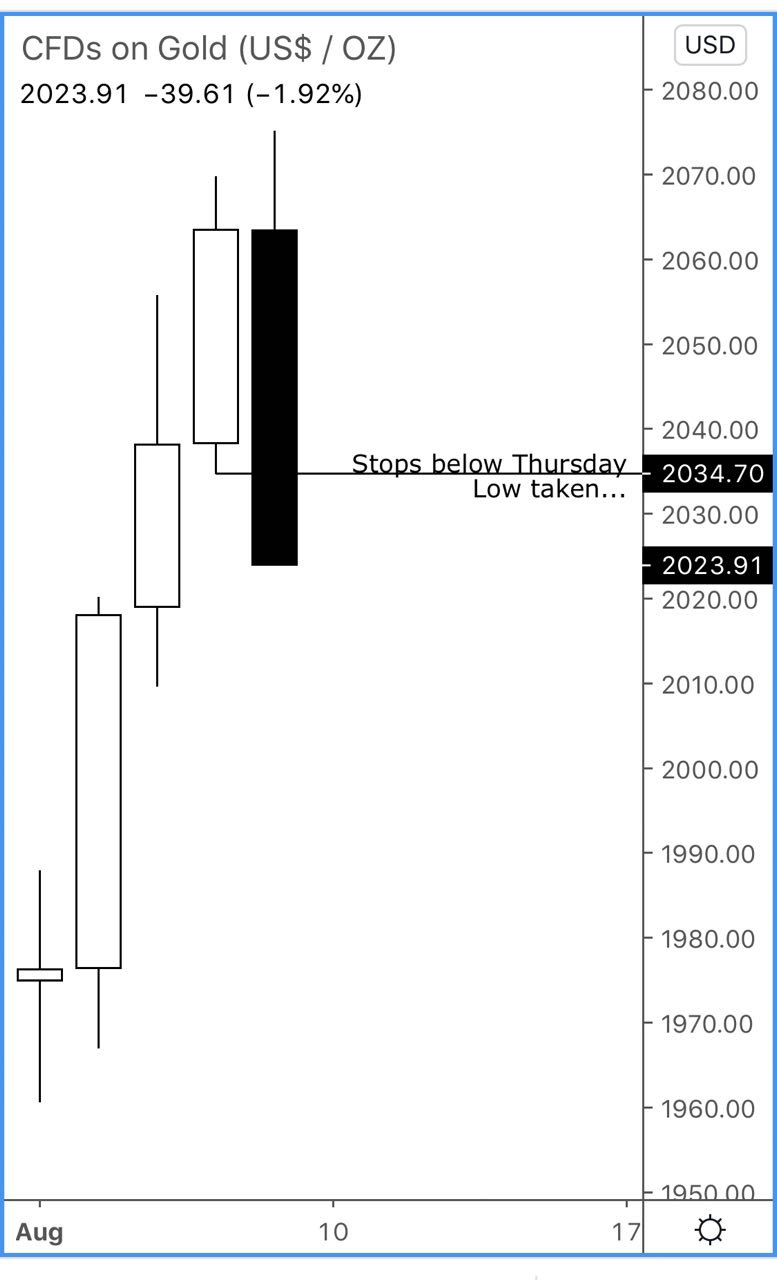
Gold long trade idea on H1 chart, using the above daily chart as the reason. We are looking to buy if we go back above this hour's high, for this would indicate the earlier breakdown was indeed a sell trap. The stop or invalidation is below today's low. Target above recent highs eg where I have shown on the chart.
If gold creates a new low before triggering our entry, then the stop loss will need to be adjusted so it is just below today's low, whatever that level maybe (unless it goes down by so much that the reward-risk falls below 1:1). But to be clear, we are ONLY entering IF we go back above this H1 high (and thus above Thursday's low)
Source: TradingCandles.com and TradingView.com
Gold triggered our entry in the following week, but the selling resumed and quickly stopped us.
But we made it up in the next gold trade!
Example: Gold (17/08/2020)
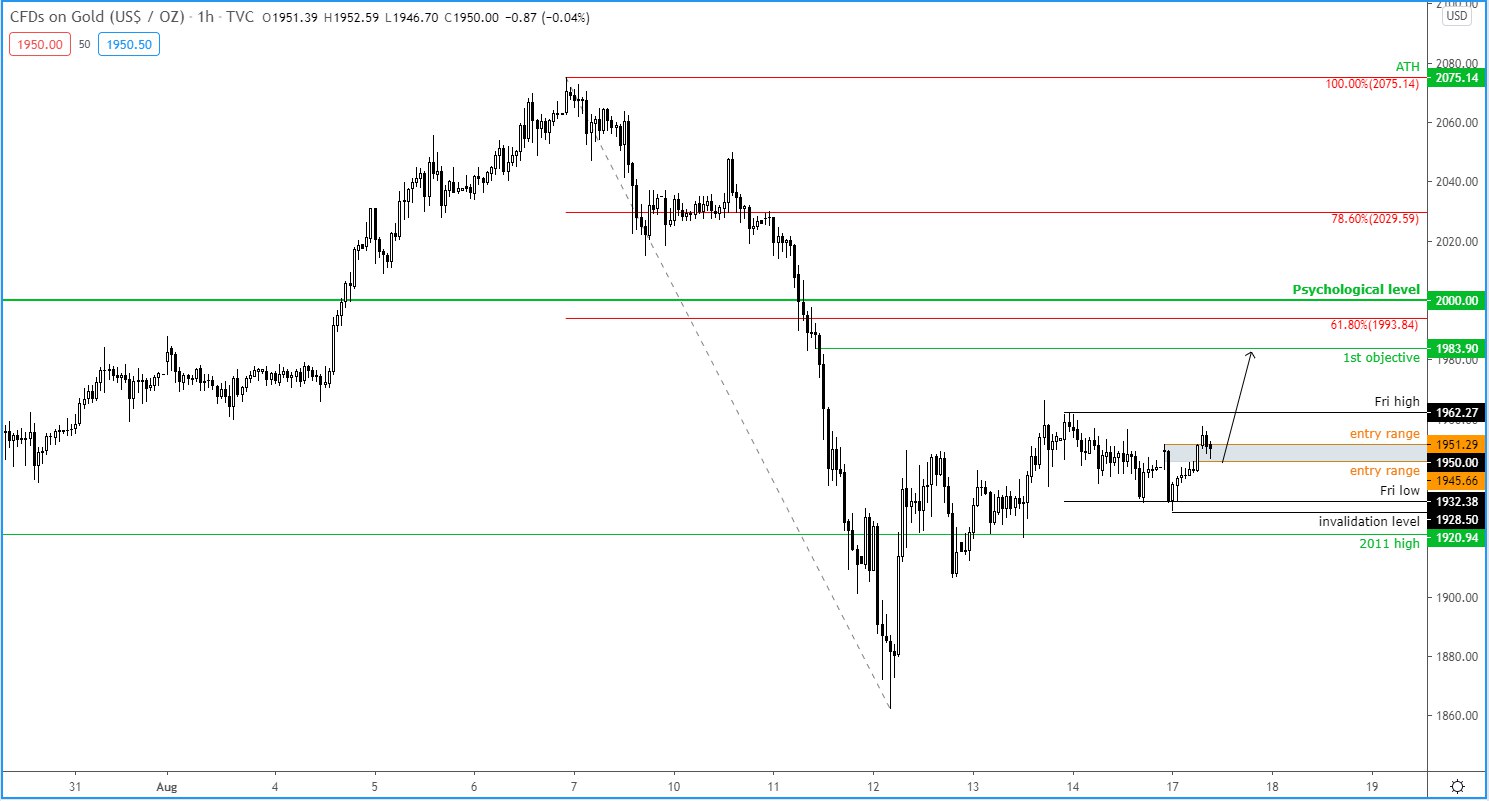
Gold daily is trying to form a base after its correction last week. So far it is holding above the rising trend line and 21-day exponential... In another bullish sign, it looks like those who sold below Friday's low are trapped... so from here gold may at least go on to probe liquidity above Friday's high next

Source: TradingCandles.com and TradingView.com
Gold trade idea on H1 chart..
invalidation is below today's low, for if price gets there, the bear trap idea we identified on daily would become invalid
1st target is just below the 61.8% Fibo, and first trouble area based on hourly candles
2nd target will be an open target in case gold hits new record highs – so ensure you keep a small portion open!
Source: TradingCandles.com and TradingView.com
Gold didn't disappoint this time and it quickly hit out first objective:
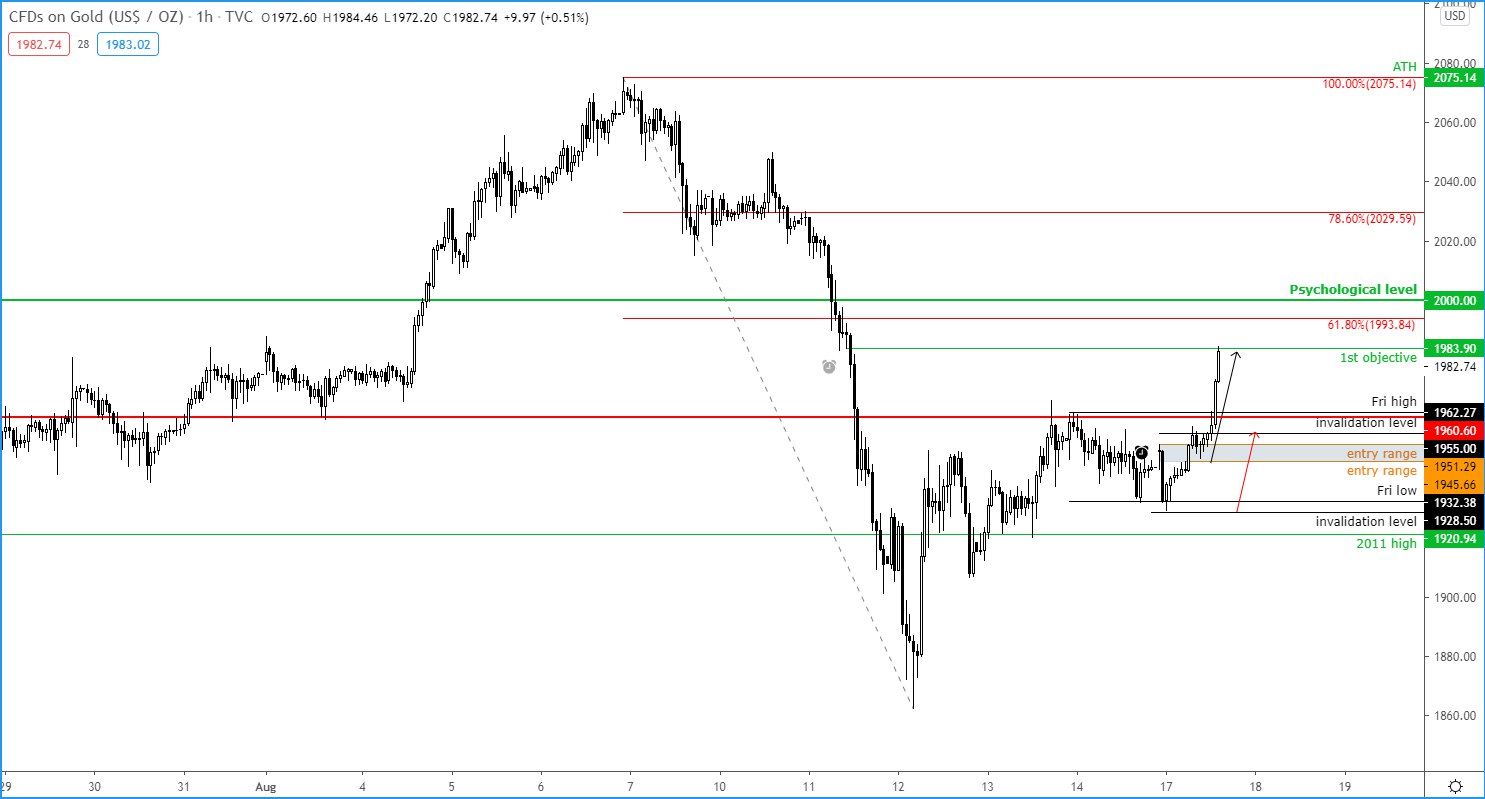
Source: TradingCandles.com and TradingView.com
This was on the same day this report was published, so I have no idea whether it will hit a new record high or not. But I did advise that...
If you are holding (a portion of) this trade for even higher, make sure to keep raising your stops . I have done so for this trade to above entry (below H1 thrust candle)
This above was obviously just a snapshot of the trade setups I look for. Every situation is different, and when market conditions change so too will my approach. But hopefully you have got some ideas about my approach and learned a few tricks along the way. Please don't hesitate to get in touch if you have any questions.
Author

Fawad Razaqzada
TradingCandles.com
Experience Fawad is an experienced analyst and economist having been involved in the financial markets since 2010 working for leading global FX, CFD and Spread Betting brokerages, most recently at FOREX.com and City Index.


