MT4 Charts and how to customise them
MetaTrader 4 (MT4) is one of the most widely used trading platforms in the financial industry. One of the primary reasons for its enduring popularity is the extensive charting capabilities it offers. Whether you are analyzing a specific asset using various technical analysis tools or monitoring multiple assets simultaneously, MT4 provides the functionality to meet these needs in a user-friendly and efficient manner. Additionally, it allows for quick navigation between different assets.
MT4 is free, resource-efficient and highly customizable. The options for personalizing the platform are abundant. Users can determine what to display, how many charts to open, which indicators to apply and how to visualize price movements. Each chart can be customized with distinct colors for different components, allowing for a tailored analytical experience. This vast array of possibilities is a significant factor that explains why MT4 remains a top choice among forex traders.
How to use MT4 charts

Once you have set up your account on the MT4 platform and established a stable connection, you are ready to utilize the platform for trading and market analysis. A key feature of MT4 is its charting capabilities, which provide users with the tools to visualize price movements and analyze market trends effectively.
When you first log into MT4, several chart windows may automatically appear on your screen. These charts can be customized to suit your trading preferences. You can maximize a chart to fill the screen for better visibility or remove other sections of the MT4 interface to create more space for the chart, allowing you to focus entirely on your analysis.
A new chart
To open a new chart in MT4, you can select an asset from the Market Watch section. By right-clicking on the asset and choosing "Chart Window," a new chart will display. Alternatively, you can drag the asset to an existing chart, which will update it to reflect the newly selected asset. Another method is to use the toolbar: click on the icon that resembles a plus sign and a chart, then choose your desired asset. Additionally, you can type the asset symbol directly into the currently displayed chart. For example, typing "EURUSD" and pressing Enter will switch the chart to display the Euro versus the US Dollar.
Time frames
MT4 offers a variety of time frames for analyzing price movements, allowing traders to select, in the toolbar, from one minute (M1), five minutes (M5), fifteen minutes (M15), thirty minutes (M30), one hour (1H), four hours (4H), daily (D1), weekly (W1) and monthly (1M) charts. Each time frame provides a different perspective on market trends, enabling traders to conduct both short-term and long-term analyses, as well as manual backtesting.
In the Market Watch area, you can access a Tick chart, which displays every price variation based on each individual trade rather than a time-based analysis. This feature allows traders to monitor real-time price movements.
Scroll
Traders can use the scroll option, which allows users to navigate through historical price data on charts. This can be done with:
Mouse Wheel: Use your mouse scroll wheel to move the chart left or right. Scrolling left will take you back in time.
Scroll Buttons: Alternatively, you can use the horizontal scroll buttons located at the bottom of the chart. Clicking these buttons will incrementally move the chart backward or forward.
Zoom Function: To get a closer view of specific periods, you can use the zoom feature. Right-click on the chart and select “Zoom In” or “Zoom Out” to adjust the time frame visible on the screen.
Navigating into the past helps traders identify historical trends, find support and resistance levels and also perform backtesting.
Chart types

MT4 supports several chart types, including line charts, bar charts and candlestick charts. Each chart type presents price data differently:
Line charts: These provide a simple view of price movement over time, connecting closing prices with a continuous line. They are useful for quickly identifying trends and general price direction.
Bar charts: These display the open, high, low and close prices for each period, offering more information than line charts. Each bar represents a specific time frame and provides a clear visual representation of price fluctuations within that period.
Candlestick charts: These are similar to bar charts but offer a more visually appealing representation of price movements. Each "candle" consists of a body and wicks (or shadows), representing the open, close, high and low prices for a given period. The body of the candle indicates the price range between the opening and closing values, while the wicks show the highest and lowest prices reached during that period. The color of the candle is significant: a bullish candle (typically represented in green or white) indicates that the closing price is higher than the opening price. Conversely, a bearish candle (often shown in red or black) indicates that the closing price is lower than the opening price. This format allows traders to assess market sentiment and identify patterns.
Users can easily switch between chart types by clicking on the toolbar or using keyboard shortcuts: pressing Alt + 1 switches to a line chart, Alt + 2 changes to a bar chart and Alt + 3 selects a candlestick chart.
MT4 allows for the customization of chart colors.
Drawing tools

MT4 offers a variety of drawing tools that can be used to enrich chart analysis and to identify potential entry and exit levels. There are numerous drawing tools. Here are the most popular:
Trend lines: You can draw straight lines that connect significant price points. This helps identify the direction of the trend and potential breakout points.
Horizontal lines: These can mark support and resistance levels, identifying relevant price levels.
Equidistant channel: This channel consists of two parallel lines that are equidistant from a central line, which typically represents a trend.
Fibonacci retracement levels: This tool allows you to plot horizontal lines that indicate potential support and resistance levels based on Fibonacci ratios, which traders often use to identify retracement areas.
Shapes and text: You can add shapes, such as rectangles and arrows, to highlight important areas or events on the chart, as well as text annotations to note specific observations or strategies.
All these graphics can be manipulated and modified easily. They can also be deleted quickly, or they can remain on the chart permanently.
To analyze the same asset in a different timeframe, the user can choose to open a new chart for the same asset and draw new lines. For example, they can use the 1D timeframe to determine the entry level, and once the trade is executed, monitor the asset's performance on another chart, such as the 1M or 5M, where they can draw additional lines. The trader can divide the screen to view both charts simultaneously or simply switch from one to the other by clicking on the tabs below the chart.
Technical indicators

MT4 offers a wide selection of tools for technical analysis, including a variety of built-in technical indicators. Users also can develop their own indicators using MQL4 or download custom indicators created by other traders. These indicators help traders analyze price movements, identify trends and improve the timing of trades.
MT4 provides more than 30 built-in technical indicators that cover various analytical approaches. The most popular include:
Trend indicators: These help identify the direction of the market trend. Examples include Moving Averages, Average Directional Index (ADX), Parabolic SAR and Ichimoku Kinko Hyo.
Momentum indicators: These measure the speed of price movement, such as the Relative Strength Index (RSI), Moving Average Convergence Divergence (MACD) and Stochastic Oscillator.
Volatility indicators: These assess the market's volatility, with examples like Bollinger Bands, Standard Deviation and the Average True Range (ATR).
Volume indicators: These analyze trading volume to gauge market strength, including the On-Balance-Volume (OBV), Volume, Accumulation/Distribution Line and Chaikin Money Flow (CMF)
All these graphics can be manipulated and modified easily. They can also be deleted quickly, or they can remain on the chart permanently.
In each chart, users can include as many indicators as they want, without limit. Additionally, it is possible to introduce various types of the same indicator, for example, multiple moving averages with different settings; more than one stochastic oscillator with different parameters, etc. However, it’s essential to avoid cluttering the chart, which can lead to confusion and contradictory signals. Users can also draw lines and shapes on indicators, applying technical analysis to indicators, which further contributes to the process of finding entry and exit points.
MT4 charts customization options

MT4 charts customization options
Another positive aspect of MT4 is that it allows for a great amount of customization options. From modifying the colors of the charts and the background to configuring the toolbar, as well as having different chart layouts; with the ability to save configurations and apply them whenever desired.
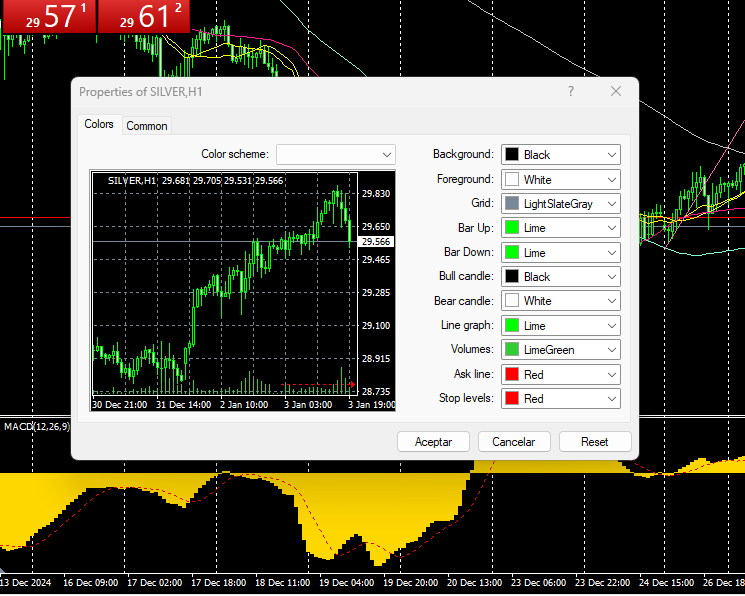
Colors
Traders can modify the colors of various chart elements, including candlesticks, backgrounds, gridlines and indicators. By accessing the 'Colors' tab in the 'Properties' window, users can select between multiple color schemes.
Settings
MT4 allows users to customize chart settings. Traders can select different chart types, and modify the price scale and chart shift features. Additional settings, such as font size, bar spacing and line thickness, can also be tailored to improve visual clarity. These adjustments can be made through the 'Charts' tab in the main menu.
Indicators
The platform provides a variety of technical indicators that traders can adjust according to their strategies by changing parameters, adding lines, highlighting and more. Furthermore, advanced traders can create custom indicators using the MQL4 programming language or download indicators created by other traders.
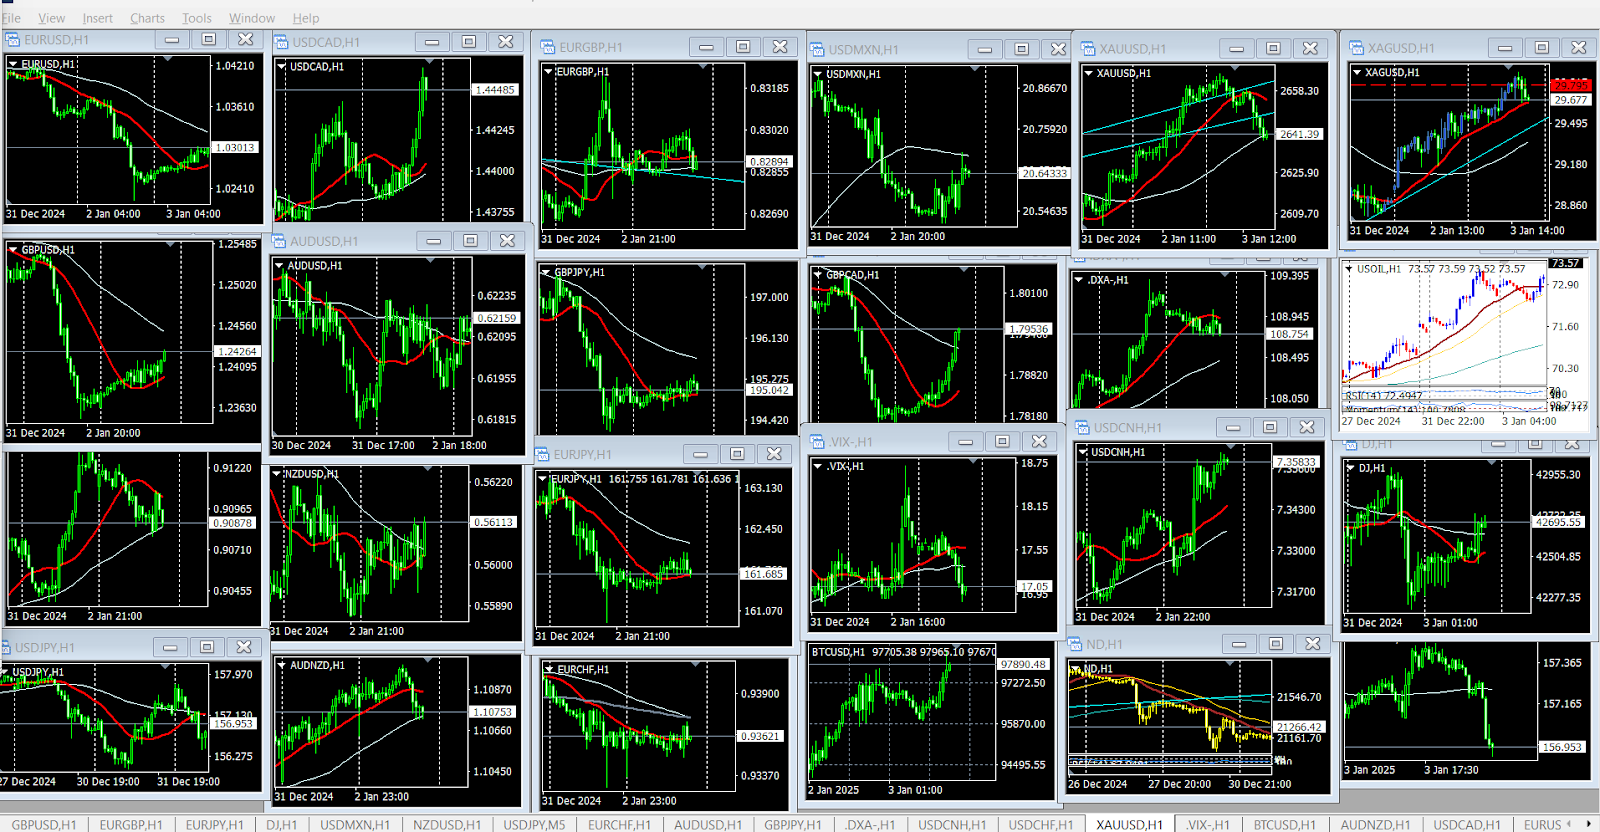
Chart windows
MT4 facilitates adding or removing chart windows. Traders can open multiple chart windows, each displaying different assets or timeframes. This feature enables simultaneous market analysis. To manage chart windows, traders can use the 'New Window' icon to add charts or right-click on existing charts.
Chart templates
Traders can save specific chart configurations—including indicators, colors, chart types and timeframes—and quickly apply their preferred setups to different charts. This feature not only saves time by eliminating the need for repetitive manual adjustments but also enables users to maintain a consistent visual layout across various assets. Templates can be renamed or deleted as needed.
Personalizing workspace layout
Traders can rearrange elements such as charts, market watchlists and trade terminals to fit their workflow. Chart windows can be organized automatically horizontally, vertically, in multiple windows or a cascade. They can also be rearranged as desired by the user, with different sizes and locations. Additionally, users can create various workspaces (profiles) and save them, enabling quick transitions between setups.
Toolbar buttons
Traders can customize the toolbar buttons in MT4. By right-clicking on the toolbar and selecting 'Customize,' users can add or remove buttons.
Language
MT4 supports 39 languages, allowing traders to change the platform's language settings to their preferences.
Expert advisors
For those looking to automate their trading strategies, MT4 offers to install Expert Advisors (EAs). These programs execute trades based on predefined rules and can analyze market conditions automatically. EAs can be easily attached to charts through the Navigator window.
Alerts
Traders can set up alerts in MT4 to monitor critical price levels and identify key trading opportunities. By right-clicking on the chart or using the 'Alerts' button in the Terminal window, users can create alerts based on specific conditions.
MT4 chart templates
MetaTrader 4 (MT4) offers traders the ability to create and utilize chart templates. This means that if you are working on a chart and have already set up the variables, such as your preferred moving averages, technical indicators and choosing colors, you can replicate that same chart for another asset in one simple step without needing to reload the indicators or modify the colors. That’s what templates are for. Chart templates allow users to save specific chart settings, including indicators, colors and layouts, enabling quick access to preferred configurations.
To create a chart template in MT4, traders first customize their chart to their preference. This includes adjusting indicators, colors, chart type and timeframes. Once the chart is configured, traders can save the setup as a template by right-clicking on the chart and selecting ’Template’ >’Save Template.’ They can then name the template for easy identification.
To use saved templates, traders have to right-click on any chart, select 'Template,' and then choose the desired template from the list. The chart will change instantly, allowing rapid transitions between different chart setups without the need to replicate manually all the configurations. Users can delete templates they no longer need or rename them for better organization.
The use of templates allows traders to maintain a consistent visual for different charts; at the same time, it enables the application of different configurations of indicators and colors for various assets. All of this can be done without spending time configuring manually each time.
Author
FXStreet Team
FXStreet
Composed of a group of economic journalists and FX experts, the FXStreet content team produces and oversees all content published on FXStreet. It provides a purely journalistic approach to the Forex market.


