All Gold trading strategies you need to know

Gold has always held a unique position in financial markets, revered for its ability to maintain value and provide a hedge against economic uncertainty. Whether you are a beginner or an experienced trader, developing an effective Gold trading strategy is essential for navigating its volatility and capitalizing on its price movements. In this article, we will guide you through the fundamentals of Gold trading strategies, from what they are to how to choose one that aligns with your trading style and goals.
What is a Gold Trading Strategy?

A Gold trading strategy is a plan or approach that traders use to make informed decisions when buying or selling Gold. It encompasses various techniques, rules, and methodologies designed to optimize trades and manage risk in Gold markets.
Strategies can range from short-term trading, like day trading or scalping, to longer-term investments such as swing trading or holding positions for months or even years.
Effective strategies are built upon careful analysis of the market, including factors like historical price movements, geopolitical events, macroeconomic indicators, and supply and demand dynamics. It typically involves the use of technical analysis, market sentiment, and fundamental factors to identify profitable trade opportunities while managing risk.
By using a Gold trading strategy, traders reduce the emotional impact of market fluctuations and rely on structured decision-making to achieve their objectives. A well-defined strategy serves as a roadmap for when to enter and exit trades, how much capital to allocate, and how to protect profits.
Best Gold trading strategies

Here’s a deep dive into several popular and advanced Gold trading strategies. We will also highlight their risks, pros and cons, and who they are most suited for, beginners or more advanced traders.
Beginner Gold trading strategies
These strategies are simple to understand and do not require deep knowledge of technical or fundamental analysis. They are best suited for traders who are just starting in the Gold market and want to gain experience with lower risk.
Gold range-trading strategy
Range trading is one of the simplest and most effective strategies for beginners. It involves identifying a price range in which Gold is trading and then buying at the lower end of the range (support) and selling at the upper end (resistance). Unlike trend-following strategies, range trading is based on the assumption that Gold’s price will continue moving within a defined range without breaking out into a strong upward or downward trend.
This strategy works best when Gold is in a sideways market, where prices fluctuate within a horizontal range for an extended period. As a beginner, this strategy provides you with clear entry and exit points, making it easier to understand and manage risk.
How it works:
The first step is to identify a trading range where Gold is consistently bouncing between a support level (the lower boundary) and a resistance level (the upper boundary). You can do this by looking at historical price data and noting where the price tends to reverse direction frequently.
The support level is where Gold price tends to find a "floor" and stop falling. Conversely, the resistance level is where the price tends to hit a "ceiling" and stop rising.
When Gold price approaches the support level, it is considered a potential buying opportunity. At this point, the assumption is that the price will bounce off the support and move back up towards the resistance level.
Once the Gold price reaches the resistance level, it is a signal to sell. The assumption here is that the price will not break through resistance but instead reverse direction and move back down toward support.
To manage risk, it’s important to place stop-loss orders slightly below the support level when you enter a buy trade. This ensures that if the price breaks below support, you will automatically exit the trade to avoid further losses.
Similarly, if you are shorting Gold at the resistance level, set a stop-loss slightly above the resistance to protect yourself from losses in case the price breaks through.
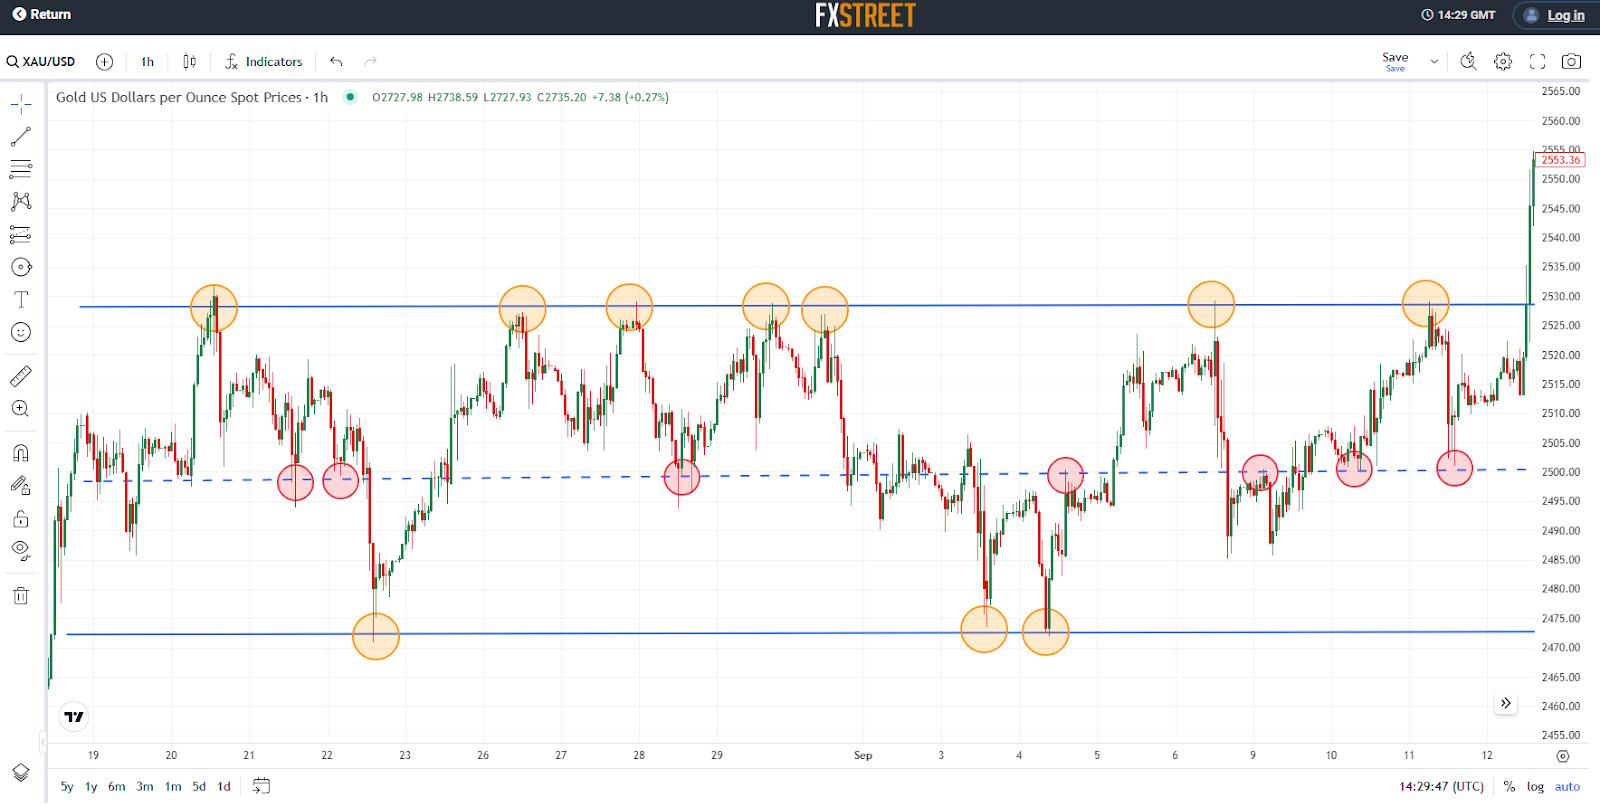
Gold in a range price action
Pros:
- Simplicity: Range trading is easy to understand, making it ideal for beginners. It provides clear entry and exit points based on observable price levels.
- Lower risk: By buying at support and selling at resistance, you are entering trades at levels where risk is minimized. Stop-loss orders further help in managing risk.
- Frequent opportunities: Gold often moves in ranges during periods of consolidation, providing multiple trading opportunities within a short period.
Cons:
- Ineffective in trending markets: Range trading doesn’t work well in markets where Gold is experiencing a strong trend (either upward or downward). In such cases, the price is more likely to break out of the range.
- False breakouts: There’s always a risk of false breakouts, where the price temporarily breaks through support or resistance, triggering your stop-loss, only to move back into the range.
Tips:
The main disadvantage of this strategy lies in false breakouts. To help reduce losses when this occurs, avoid setting a stop-loss too close to the support and resistance levels of the range. Also remember to calculate and adjust the size of your trade to respect your money management according to this wider stop-loss.
Gold breakout strategy
The breakout strategy is a popular and straightforward trading method that aims to capitalize on significant price movements when Gold "breaks out" of a defined range. A breakout occurs when the price of Gold moves above a resistance level (bullish breakout) or below a support level (bearish breakout) with increased momentum.
Breakouts often signal the beginning of a new trend, as price escapes the consolidation phase, leading to strong movements in the direction of the breakout.
How it works:
Before a breakout occurs, Gold often consolidates within a trading range, where the price fluctuates between a well-defined support level (the lower boundary) and resistance level (the upper boundary). You can identify these levels by looking at historical price movements and spotting where the price tends to bounce off repeatedly.
A breakout happens when the price breaks above the resistance level or below the support level with strong momentum.
- When the price breaks above the resistance level with increased volume, this signals a bullish breakout. You would enter a long position, expecting the price to continue rising as the breakout gains momentum.
- When the price breaks below the support level with increased volume, this signals a bearish breakout. You would enter a short position, expecting the price to continue falling.
After entering a breakout trade, you should look to exit either when the price reaches a new key resistance or support level or when the price starts to reverse.
Some traders use trailing stops to lock in profits as the price continues to move in their favor. For example, in a bullish breakout, you might set a trailing stop just below the rising price, ensuring you capture profits if the price reverses.
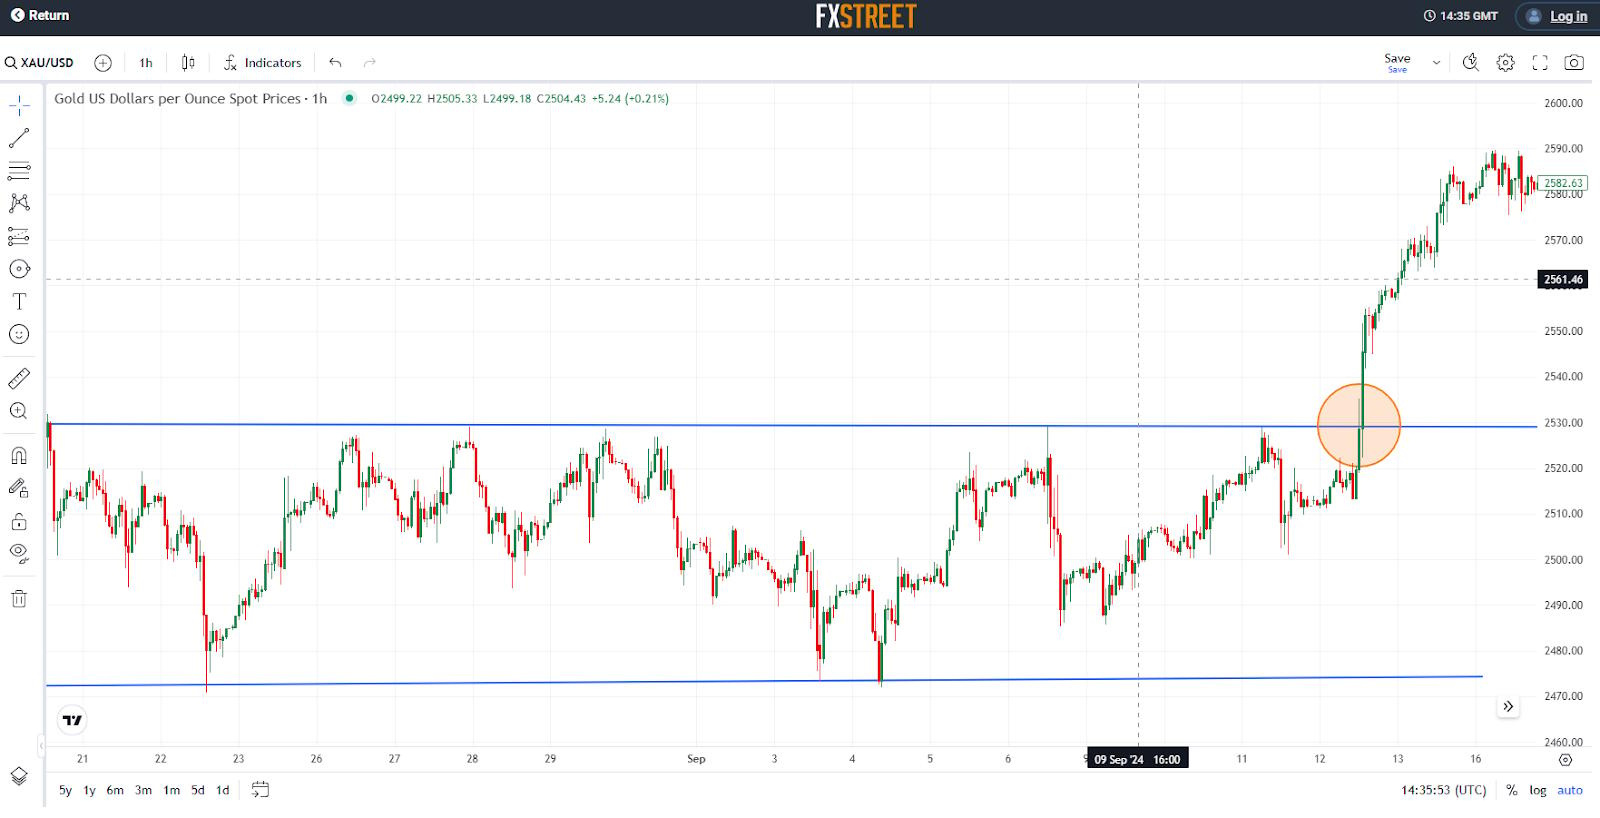
Gold price breaking out from a range
Pros:
- Clear entry and exit points: Breakout trading provides well-defined entry points, making it easier for beginners to execute trades with confidence.
- High profit potential: Breakouts can lead to significant price movements, allowing traders to capture large price swings in relatively short periods.
- Works in trending markets: The strategy is effective during periods of strong price movement and trend formation, which are common following breakouts.
Cons:
- Ineffective in trending markets: Range trading doesn’t work well in markets where Gold is experiencing a strong trend (either upward or downward). In such cases, the price is more likely to break out of the range.
- False breakouts: One of the biggest challenges with breakout trading is the risk of false breakouts, where the price briefly moves beyond support or resistance but then quickly reverses, leading to losses.
- Requires quick execution: Successful breakout trading often requires fast decision-making and quick trade execution, as breakouts can happen suddenly and move quickly.
Tips:
To avoid false breakouts, it’s essential to use additional confirmation tools. Look for increased trading volume during the breakout, as this indicates stronger market conviction. Low volume may suggest that the breakout lacks strength and could be short-lived.
You can also wait for the price to close above the resistance or below the support on a higher timeframe (such as a daily chart) to confirm the breakout before entering the trade.
Gold moving average crossover strategy
The moving average crossover strategy is a simple yet effective trading method that helps beginners identify potential trends and entry/exit points in the Gold market. This strategy relies on two moving averages, a short-term and a long-term average, to signal changes in market direction. A "crossover" occurs when the short-term moving average crosses above or below the long-term moving average, indicating a potential trend change.
This strategy is ideal for beginners because it provides clear, rule-based signals for entering and exiting trades, making it easier to avoid emotional decision-making.
How it works:
The most common moving averages used in this strategy are the 20-period moving average (short-term) and the 50-period moving average (long-term). These moving averages represent the average closing price of Gold over their respective time periods.
- A bullish crossover occurs when the 20-period moving average crosses above the 50-period moving average, indicating that prices may be entering an uptrend. This is a buy signal.
- A bearish crossover occurs when the 20-period moving average crosses below the 50-period moving average, signaling that prices may be entering a downtrend. This is a sell or short-sell signal.
Traders should exit their position when the opposite crossover occurs. For example, if you entered a buy trade on a bullish crossover, you would exit the trade when a bearish crossover happens.
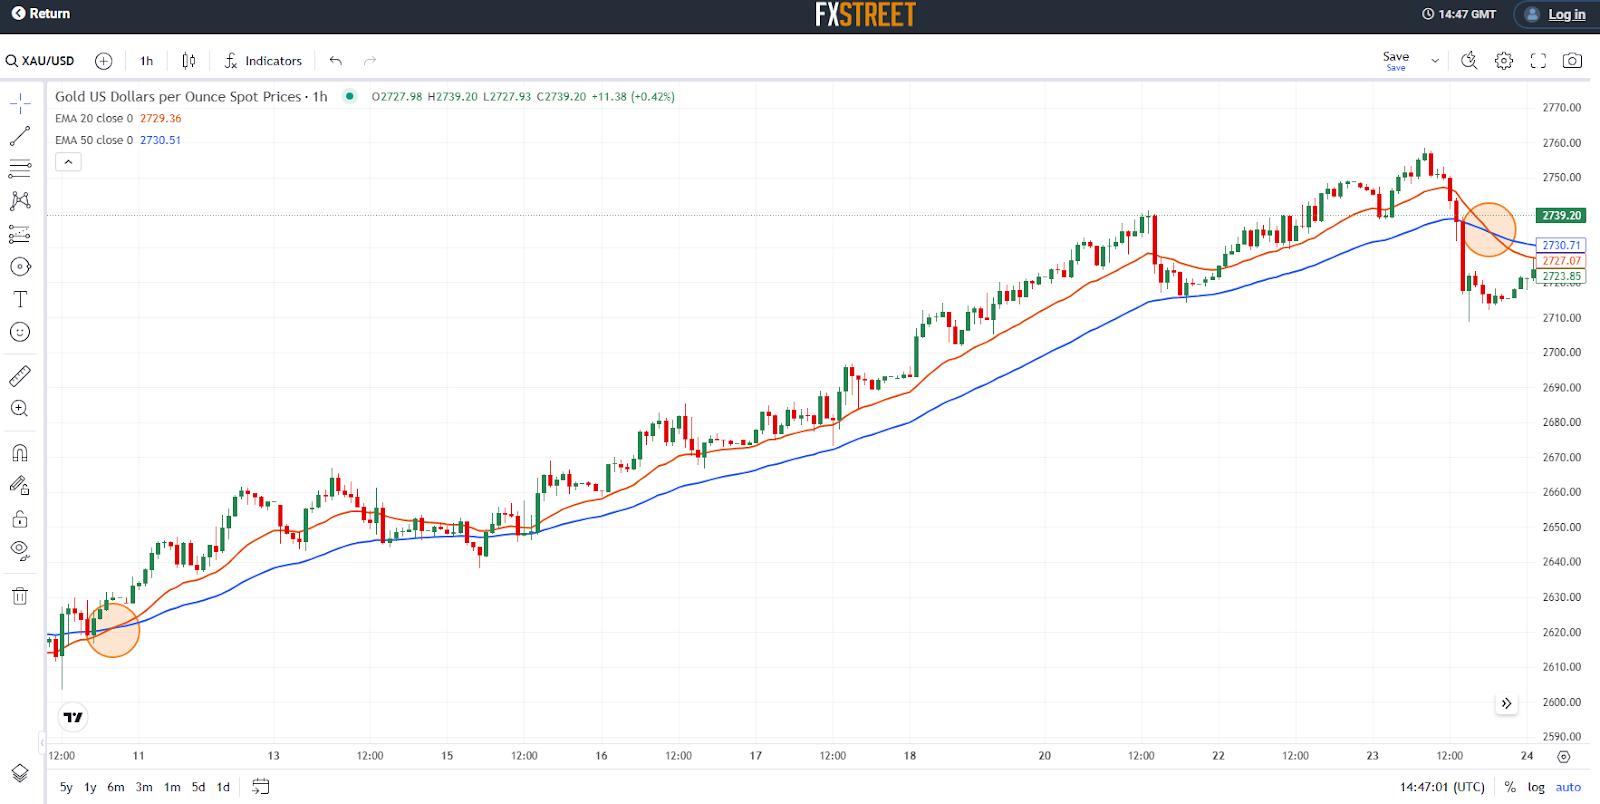
Moving averages showing a bullish crossover (buy signal) and a bearish crossover (exit signal)
Pros:
- Simple and clear signals: The crossover provides easily identifiable buy and sell signals, making this strategy accessible to beginners.
- Trend identification: Helps traders identify trends, making it a useful strategy for capitalizing on sustained price movements.
- Reduces emotional trading: Since the strategy is rule-based, it helps remove the emotional component from decision-making.
Cons:
- Lagging indicator: Moving averages are based on past price data, so the crossover signals may lag behind real-time price movements. This means you may enter trades later in the trend, potentially missing the early part of a price movement.
- Whipsaws in sideways markets: In choppy, non-trending markets, the moving averages may cross multiple times, generating false signals and leading to small, frequent losses.
- Requires quick execution: Successful breakout trading often requires fast decision-making and quick trade execution, as breakouts can happen suddenly and move quickly.
Tips:
Moving averages are lagging indicators, giving trading signals well after the start of a new trend, sometimes even too late. One trick to reduce this lag effect is to use exponential moving averages instead of simple moving averages. Exponential moving averages give more weight to the most recent prices and react more quickly to trend changes, offering trading signals more prematurely.
Gold's moving average crossover trading strategy also offers the trader considerable freedom of testing. We mentioned the 20 and 50 moving averages in our presentation, but there are infinite possibilities for combinations of moving averages. So don't hesitate to experiment with different possibilities depending on the market phases of Gold prices.
Just bear in mind that the smaller the gap between the moving averages, the more frequent and premature your trading signals will be, with more risk of false signals, and the larger the gap, the fewer your signals will be, and they will probably be more delayed but also of better quality. The trick is to find the right balance for your trading style.
Intermediate Gold trading strategies
These strategies require a deeper understanding of technical and fundamental analysis. They offer better potential returns but also involve more complexity and risk.
Gold trend-following strategy
The trend-following strategy is one of the most reliable and widely-used methods for trading Gold, particularly suitable for traders who want to capitalize on sustained market movements. The basic premise of this strategy is simple: you trade in the direction of the dominant market trend, either buying when the market is trending upward or selling (shorting) when it’s trending downward. Rather than trying to predict reversals, trend-following traders focus on riding existing trends for as long as possible to capture significant price movements.
The strategy works well in Gold markets because prices often exhibit strong, prolonged trends during times of economic uncertainty, inflation fears, or geopolitical tensions.
How it works:
The first step in the trend-following strategy is to identify whether the Gold market is trending up, down, or moving sideways. A market is in an uptrend if the price consistently makes higher highs and higher lows. Conversely, a downtrend is defined by lower lows and lower highs. Sideways or consolidating markets show no clear direction.
To identify trends, traders often use technical indicators like moving averages, which smooth out price data and help visualize the overall direction of the market.
- If Gold is in an uptrend, you buy when the price pulls back and touches a moving average or support level within the trend. This ensures that you're entering the trade at a lower point during the trend, improving your risk/reward ratio.
- If Gold is in a downtrend, you sell when the price rallies toward a resistance level or a key moving average. This allows you to sell at a higher price, maximizing profit potential when the price resumes its downward movement.
The goal in trend following is to stay in the trade as long as the trend remains intact. For a long position, as long as Gold keeps making higher highs and the price stays above your chosen moving average, you hold the position. For a short position, you remain in the trade as long as the price makes lower lows and stays below the moving average.
Some traders also use a moving average crossover technique to manage their trend-following positions, as mentioned earlier.
You exit the trade when the trend starts to show signs of reversal. For long positions, this may happen when the price drops below a key moving average or starts making lower highs. For short positions, you exit when the Gold price rises above the moving average or starts making higher lows.
A common technique in trend following is to use a trailing stop. This type of stop-loss moves up (in a long trade) or down (in a short trade) with the price, allowing you to lock in profits as the trend continues. If the price reverses and hits your trailing stop, you exit the trade with a portion of your profits intact.
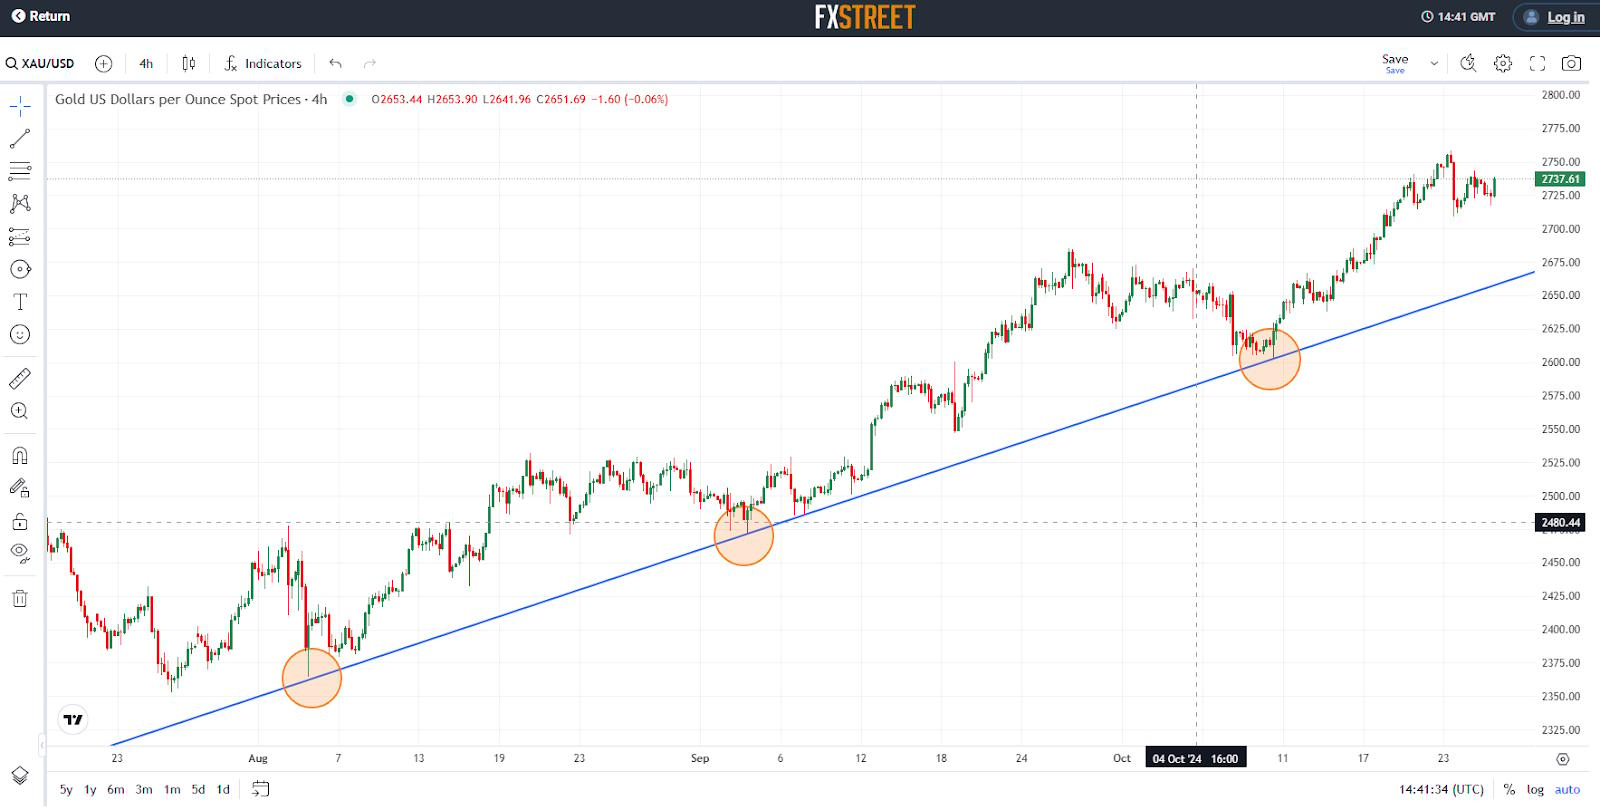
Gold prices going higher following a bullish trendline
Pros:
- Simple and effective: Trend following is relatively easy to understand and execute. The strategy focuses on identifying and trading in the direction of the trend, which reduces the need to predict market reversals.
- Works well in trending markets: The strategy is particularly effective when Gold is trending strongly, allowing traders to ride trends for potentially large profits.
- Reduces emotional trading: By following predefined rules based on technical indicators, traders can avoid emotional decisions, sticking to the trend until clear signals of a reversal emerge.
Cons:
- Not suitable for ranging markets: In sideways or choppy markets, trend-following strategies generate frequent false signals, leading to losses or missed opportunities. This strategy works best in markets with strong directional movements.
- Late entries and exits: Trend-following strategies often lead to late entries and exits since the strategy waits for confirmation of the trend before entering and signs of reversal before exiting. This means you may miss the early stages of the trend and give back some profits when the trend ends.
Tips:
To reduce the risk of false signals, use indicators like the Relative Strength Index (RSI) or MACD to confirm the strength of the trend. For example, if the RSI is above 50 during an uptrend, it indicates that momentum is still strong, increasing the reliability of the trend.
Always use a stop-loss just below the most recent low (for a long trade) or above the most recent high (for a short trade) to protect yourself from sudden trend reversals. A trailing stop helps lock in profits as the price moves in your favor while giving the trade room to grow.
This Gold trading strategy works best in trending markets. If the market is consolidating or moving sideways, it’s better to stay out and wait for a clear breakout in either direction before entering a trend-following trade.
Finally, drawing trend lines between significant highs and lows helps visualize the direction of the market and determine potential entry points and reversals.
Gold Bollinger Bands squeeze strategy
The Bollinger Bands squeeze strategy is a popular short-term trading method that aims to capitalize on periods of low volatility in the Gold market, followed by a potential breakout. Bollinger Bands are a volatility-based indicator consisting of three lines: a simple moving average in the middle and two outer bands placed two standard deviations away from the moving average. When the bands "squeeze" or narrow, it signals a period of reduced volatility, often preceding a sharp price move.
This strategy is perfect for beginners because it provides clear visual cues and does not require complex technical analysis, while also offering the potential for significant profit when the market becomes volatile again.
How it works:
Bollinger Bands expand when market volatility is high and contract when volatility decreases. A "squeeze" occurs when the bands come closer together, indicating that the Gold market is in a consolidation phase with low volatility.
This contraction is often a sign that a breakout, either upward or downward, is about to happen, as periods of low volatility are usually followed by high volatility.
Once the Bollinger Bands start to expand again after a squeeze, you need to wait for a clear price breakout.
- If the Gold price breaks above the upper band, it signals a potential bullish breakout, and you would enter a long (buy) position.
- Conversely, if the price breaks below the lower band, it signals a potential bearish breakout, and you would enter a short (sell) position.
You can exit the trade when the price starts to reverse or when it reaches a key support or resistance level. Some traders also choose to exit when the price returns to the middle band (the moving average) after a breakout.
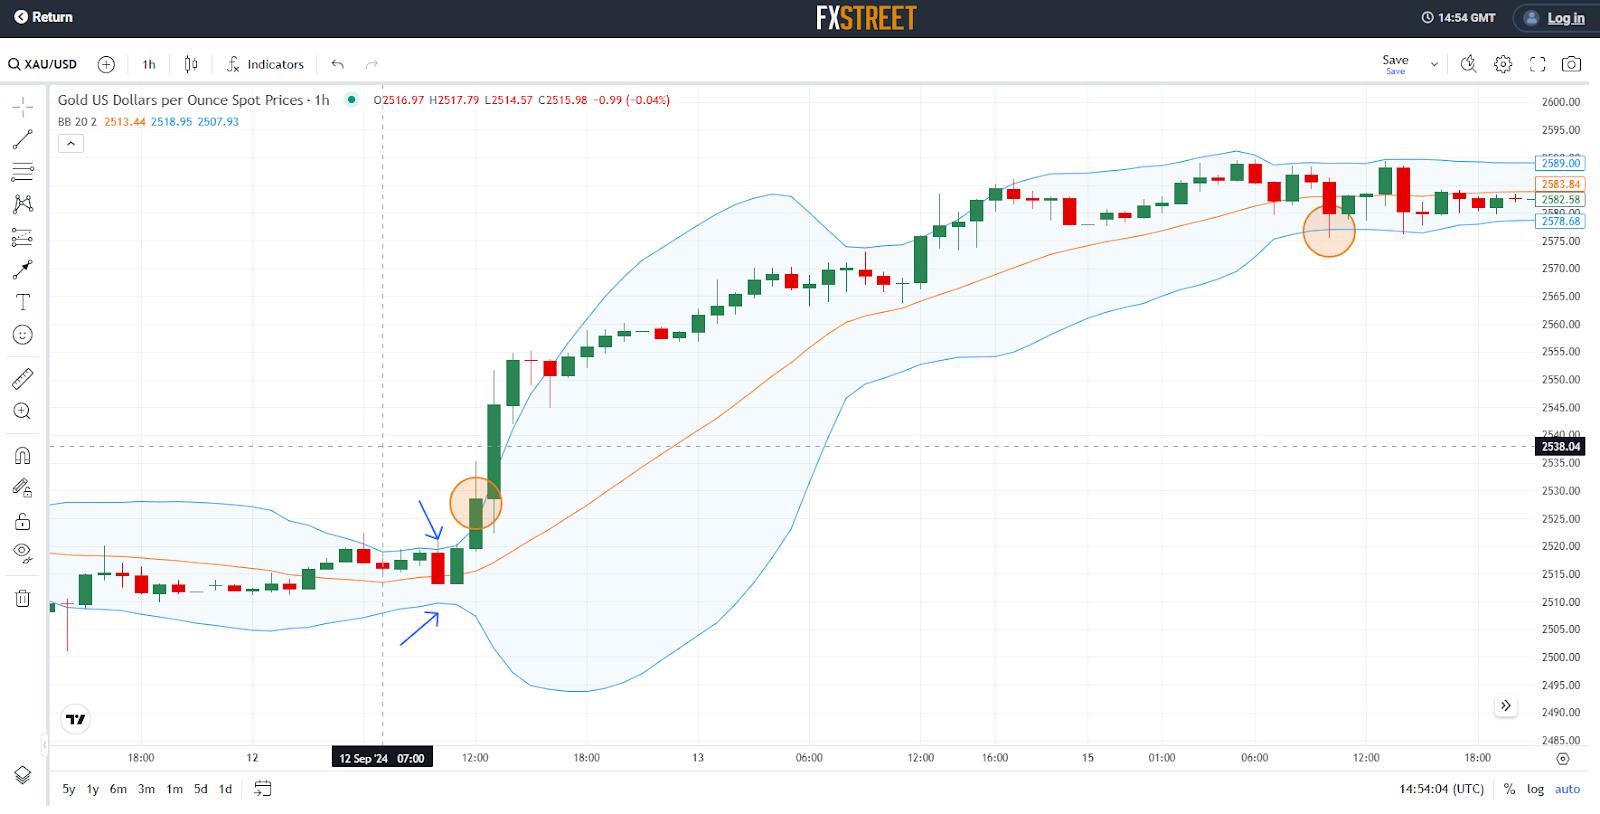
Buying Gold opportunity after a Bollinger Bands squeeze
Pros:
- Simple visual setup: The squeeze is easy to spot, making this strategy beginner-friendly. The narrowing of the bands clearly signals a potential upcoming breakout.
- Capitalizes on breakouts: By entering the market after a period of low volatility, you can catch strong price movements and potentially profit from both upward and downward breakouts.
- Flexible across markets: This is a solid Gold trading strategy that works in various market conditions and can be applied to multiple timeframes, making it versatile for short-term and longer-term traders.
Cons:
- False breakouts: Not every breakout after a Bollinger Bands squeeze leads to a strong, sustained move. False breakouts can occur, where the Gold price briefly breaks out but then reverses direction, leading to losses.
- Requires confirmation: Relying solely on the bands can lead to wrong signals. It’s essential to use additional indicators, such as the RSI or volume, to confirm the breakout strength and direction.
Tips:
Relying solely on the Bollinger Bands can lead to false breakouts. To avoid this, confirm the breakout with momentum indicators like the RSI or MACD (Moving Average Convergence Divergence). If the RSI shows overbought or oversold conditions in the direction of the breakout, it adds strength to the signal.
A breakout with low trading volume may not be sustainable, so look for a volume spike during the breakout, as this indicates stronger market participation and increases the chances of a reliable move.
Gold Fibonacci retracement strategy
The Fibonacci retracement strategy is a widely used method in Gold trading that helps traders identify potential support and resistance levels based on key ratios derived from the Fibonacci sequence. This strategy is built around the idea that after a significant price movement, whether upward or downward, the price will often retrace or pull back to a certain percentage level before continuing in the direction of the original trend.
The most commonly used Fibonacci retracement levels are 23.6%, 38.2%, 50%, and 61.8%, with 61.8% being particularly significant as it represents the "Golden Ratio." These levels serve as potential entry points in a trending market, offering traders opportunities to enter at a more favorable price during a pullback.
How it works:
Before using Fibonacci retracement, you must first identify a clear trend in the Gold market. This trading technique works best in trending markets, where Gold price is moving consistently higher or lower.
- In an uptrend, you draw Fibonacci retracement levels from the lowest point of the trend (swing low) to the highest point (swing high).
- In a downtrend, you draw Fibonacci retracement levels from the highest point to the lowest point.
Once the trend is established, you plot Fibonacci retracement levels on the chart. Most charting platforms will automatically calculate and display the retracement levels, based on the price range you select.
The key Fibonacci levels (23.6%, 38.2%, 50%, 61.8%) are plotted between the swing low and swing high. These levels represent potential areas where the Gold price may pull back before resuming the trend.
- In an uptrend, you look for buying opportunities when the price pulls back to one of the Fibonacci retracement levels. For example, if the price pulls back to the 38.2% retracement level, you would consider buying, anticipating that the price will resume its upward movement.
- In a downtrend, you look for selling opportunities when the price rallies to one of the Fibonacci retracement levels. If the price retraces to the 61.8% retracement level, you would sell, expecting the price to continue falling.
It’s important to confirm the validity of the Fibonacci retracement levels before entering a trade. Look for other technical indicators, such as moving averages, RSI, or candlestick patterns (e.g., bullish engulfing for uptrends or bearish engulfing for downtrends), to confirm that the price is likely to reverse at the Fibonacci level.
Additionally, watch for volume spikes near key Fibonacci levels, as increased volume can indicate strong market participation and confirm the level as a potential reversal point.
Once the trade is entered, the exit strategy will depend on how far the price moves after bouncing off the Fibonacci level. You can set profit targets at previous resistance levels in an uptrend or support levels in a downtrend.
Some traders use Fibonacci extensions, such as 127.2% and 161.8%, to determine future price targets beyond the original swing high or low.
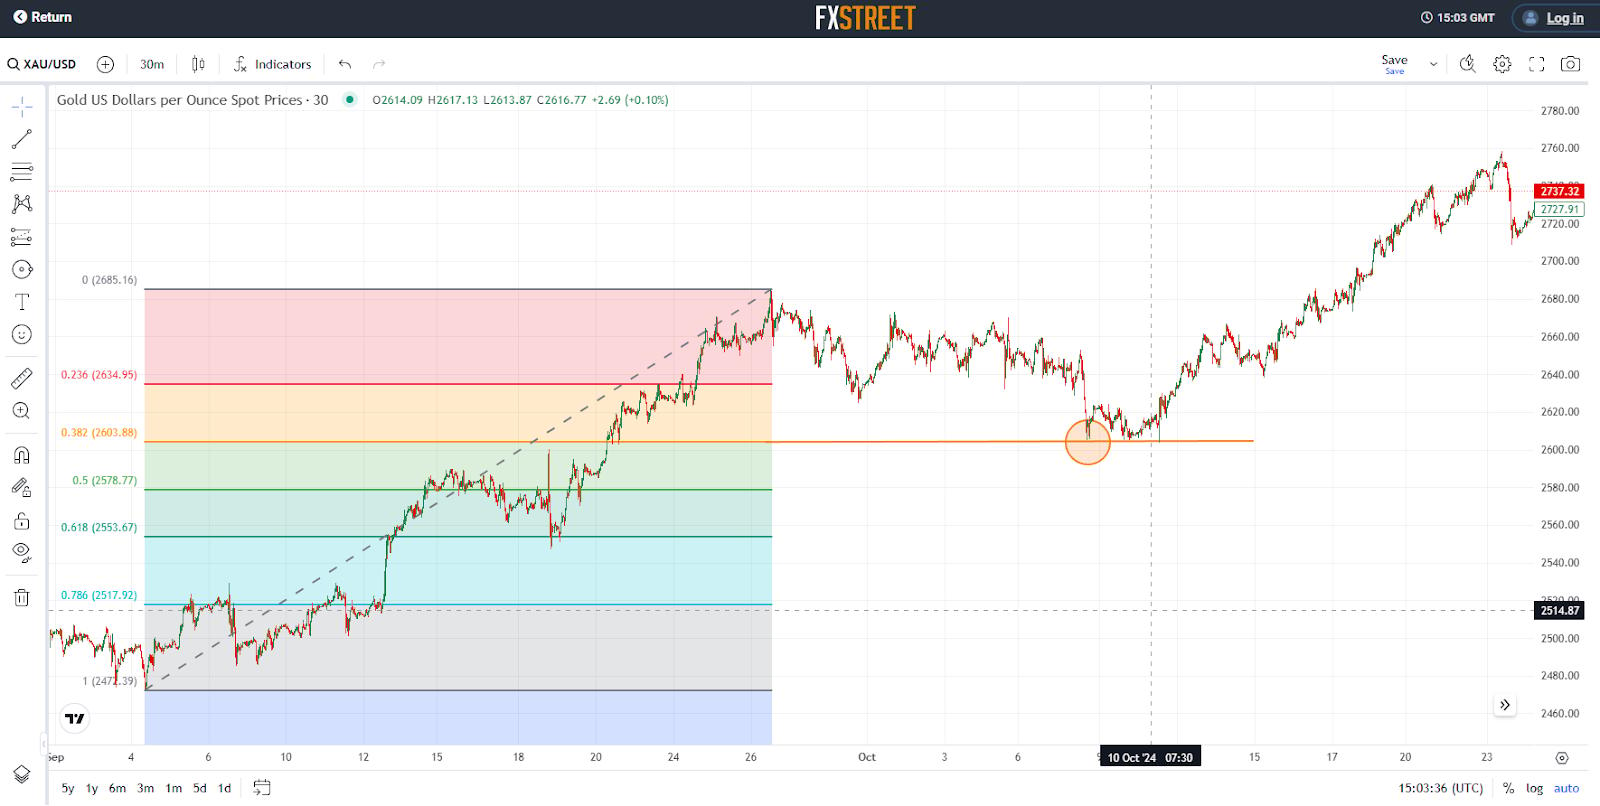
Gold prices retracing 38.2% before resuming previous uptrend
Pros:
- High-probability entry points: Fibonacci retracement levels are often key support or resistance levels, providing traders with favorable entry points during pullbacks.
- Works well in trending markets: This strategy allows traders to participate in a trend without having to chase the price. It offers a chance to enter the trend at a better price after a retracement.
- Clear visual cues: The Fibonacci levels are easy to spot on a chart, making it a user-friendly tool for identifying potential trade setups.
Cons:
- Not always accurate: While Fibonacci levels often provide useful guidance, the price doesn’t always retrace to these levels perfectly. False signals can occur if the market doesn’t respect the Fibonacci levels.
- Requires confirmation: Relying only on Fibonacci retracement levels without additional confirmation can lead to poor trade decisions. It’s important to use other indicators to validate potential reversals.
Tips:
The best Fibonacci retracement levels are those that align with other technical indicators (confluence price levels), such as support and resistance zones, moving averages, or trendlines. When multiple indicators align at a Fibonacci level, it strengthens the chance that the price will respect that level, increasing the likelihood of a successful trade.
With Fibonacci trading strategies, patience is key. Don’t rush into a trade as soon as you spot a Fibonacci level. Wait for the price to react to that level, showing signs of a reversal. Patience can help avoid premature entries and false signals.
Advanced Gold trading strategies
These strategies are complex and require a solid understanding of both technical and fundamental factors affecting the Gold market. They also demand more time, analysis, and experience to execute successfully.
Gold scalping strategy
The scalping strategy is a short-term trading approach that aims to capture small price movements in Gold by making numerous trades throughout the day. Scalping is a high-frequency strategy, where traders seek to take advantage of minute-by-minute fluctuations in the price of Gold. Each trade typically lasts just a few minutes or even seconds, and the goal is to accumulate small but consistent profits that add up over time.
Due to the fast-paced nature of scalping, it requires excellent timing, quick decision-making, and the ability to execute trades efficiently. Scalping is particularly effective during periods of high market liquidity and volatility, such as when major economic data is released or during market open and close times.
How it works:
Scalping works best when Gold is volatile, such as during the overlap of major trading sessions (e.g., the London and New York sessions) or around key economic news releases like Nonfarm Payrolls, interest rate decisions, or inflation reports. Higher volatility leads to more price fluctuations, which scalpers rely on to profit.
Scalping typically takes place on very short timeframes, such as the 1-minute or 5-minute chart. These timeframes help scalpers monitor price movements closely and make quick decisions.
Scalpers rely heavily on technical analysis for precise entries and exits. Common indicators used in Gold scalping include:
- Moving averages: Fast-moving averages like the 5-period and 15-period moving averages help identify short-term trends.
- RSI: It can indicate when Gold price is likely to reverse, helping to scalp during overbought or oversold conditions.
- Stochastic Oscillator: This momentum indicator helps identify overbought or oversold levels in Gold price on short timeframes.
- MACD: The Moving Average Convergence Divergence helps scalpers spot changes in momentum, useful for both trend and counter-trend scalping.
The key to scalping is to enter and exit trades rapidly, usually within a matter of seconds or minutes. Scalpers aim to capture small price changes, such as $1 or $2 per ounce of Gold, and may execute dozens of trades in a single session.
Due to the small price targets, scalping requires very tight stop-losses to minimize potential losses if the market moves against the trader. A common approach is to set stop-losses just a few dollars below or above the entry point.
Similarly, take-profits are set very close to the entry price, often just a few dollars higher for long positions or lower for short positions. The goal is to quickly lock in small profits repeatedly.
Pros:
- High frequency of opportunities: Scalping provides numerous trading opportunities throughout the day, particularly in volatile markets.
- Small capital requirements: Since the goal is to capture small price movements, scalping can be done with smaller position sizes, reducing overall risk exposure.
- Short holding periods: Positions are held for only a few seconds to minutes, which minimizes exposure to market risk over longer timeframes.
Cons:
- High transaction costs: The frequent trades in scalping can lead to high transaction fees or spreads, which can eat into profits. It’s essential to trade on platforms with low commissions and tight spreads.
- Stressful and demanding: Scalping requires constant attention and fast reflexes, as price movements occur rapidly. It can be mentally and emotionally taxing for traders, especially during volatile sessions.
- Requires quick execution: To succeed in scalping, traders must execute trades quickly and decisively, often using advanced trading platforms with fast order execution.
Tips:
The most profitable times for scalping Gold are during high volatility, such as the overlap of the London and New York trading sessions or around major economic events.
Scalping requires fast execution, so using a platform with low latency, tight spreads, and low transaction fees is essential. Delays in execution can quickly erode profits in scalping. Because profits in scalping are small, make sure the spread is narrow, as wide spreads can significantly cut into profits.
Always use tight stop-losses and avoid risking more than a small percentage of your capital per trade. Consistent risk management helps limit losses, which is crucial in such a fast-paced strategy.
The main trap with scalping strategies is overtrading. It’s easy to get caught up in the fast-paced nature of scalping, but be disciplined. Stick to your trading plan, and avoid overtrading when conditions are not ideal.
News trading strategy
The news trading strategy involves capitalizing on market-moving news events and economic data releases that have a significant impact on Gold prices. As a safe-haven asset, Gold is highly sensitive to macroeconomic news, geopolitical events, and central bank announcements. News trading requires traders to react quickly to key developments, anticipating how the news will affect Gold price direction and volatility.
News trading is a high-risk, high-reward strategy, and it demands an in-depth understanding of economic indicators, market sentiment, and fast execution skills. For experienced traders, this strategy can offer substantial profit opportunities, especially during major announcements.
How it works:
To execute a Gold news trading strategy, you first need to identify key news events:
- Central bank announcements: Statements from central banks – as Gold prices against US Dollar (the XAU/USD trading pair) react the most to the American Federal Reserve – on interest rate decisions, inflation targets, and monetary policy shifts can significantly impact Gold prices. Lower interest rates tend to weaken the counterpart currency and drive Gold prices up, while rate hikes often strengthen the counterpart currency, potentially leading to a decline in Gold.
- Economic data releases: Key economic indicators such as Nonfarm Payrolls (NFP), Consumer Price Index (CPI), Gross Domestic Product (GDP), and Unemployment Rate influence Gold’s demand as a hedge. For example, high inflation figures (CPI) often increase demand for Gold, while strong GDP growth may decrease its appeal as a safe haven.
- Geopolitical events: Political instability, trade tensions, and wars can create uncertainty in financial markets, increasing demand for safe-haven assets like Gold. Traders should monitor news outlets and geopolitical reports for potential Gold price impacts.
Once you have identified the key news driving Gold price, you should analyze market expectations. Prior to the release of economic data, analysts and economists often publish consensus forecasts, which represent the market’s expected outcome. If the actual data deviates significantly from the consensus, it can cause sharp moves in Gold prices. Market expectations and actual data releases can be seen real time on an Economic Calendar. For instance, if inflation numbers are much higher than expected, Gold may rally as investors seek protection from currency devaluation.
Another necessary step in the news trading strategy is to gauge the current market sentiment towards Gold. Sentiment indicators, such as the Gold Sentiment Index, can give an idea of whether traders are generally bullish or bearish leading up to a news event, helping you anticipate potential price reactions.
Depending on the actual data and market reaction, you can mainly adopt two approaches:
- Breakout strategy on news release: When major news is released, Gold often experiences a breakout, either upward or downward, based on how the news aligns with or diverges from market expectations. Traders can use this opportunity to enter trades immediately following the release if the price breaks a key support or resistance level with high volume.
- Fade the news: In some cases, Gold’s initial reaction to a news event may be exaggerated. Traders can “fade” the news by entering a position in the opposite direction of the initial move, expecting the price to return to its previous range after the initial volatility fades. This approach works well when the news impact is expected to be short-lived or less significant than the initial market reaction suggests.
Due to the high volatility associated with news trading, it’s essential to use tight stop-losses to limit potential losses in case the market moves sharply against your position. Place stop-loss orders just outside key support or resistance levels to protect your trade.
For take-profit, target levels can be set at the next key support or resistance level, depending on the direction of the trade. Since news-driven movements can be rapid and short-lived, scalping small profits multiple times in a session may be more effective than holding a position for an extended period.

Nonfarm Payrolls release on FXStreet Economic calendar
Pros:
- High profit potential: Major news events can cause large price swings, allowing traders to capture significant profits in a short period.
- Clear entry and exit points: News-driven breakouts often create clear levels of support and resistance, simplifying entry and exit decisions.
Cons:
- High volatility and risk: News trading can lead to sharp, unpredictable moves, making it essential to manage risk with tight stop-loss orders.
- Requires fast execution: Successful news trading requires immediate reaction to market events, as even a slight delay can result in missed opportunities or increased losses.
Tips:
By preparing in advance, you can react more effectively to unexpected results or surprises in the data. Identify key economic events for the week and plan potential trade scenarios.
You should focus on major news events, like central bank decisions or significant economic reports, which are likely to have a substantial impact on Gold prices, and avoid low-impact news that may not move the market enough to provide scalping or breakout opportunities.
If you miss the initial move, avoid entering the trade too late, as the price might reverse after an exaggerated reaction. Wait for a potential pullback or use a fading strategy to enter at a better price.
Gold sentiment analysis strategy
The sentiment analysis strategy leverages market psychology to gauge the overall mood or sentiment of traders and investors towards Gold. By assessing whether sentiment is overly bullish or bearish, traders can gain insights into potential reversals, continuations, or the strength of the current trend. Sentiment analysis is particularly useful in markets like Gold, where investor behavior is often driven by fear, greed, and responses to economic uncertainty or geopolitical events.
This strategy can be applied as both a momentum and contrarian approach. In momentum trading, traders align their trades with the prevailing sentiment, while in contrarian trading, they take the opposite stance, betting on sentiment extremes to reverse.
How it works:
First, you need to analyze Sentiment indicators like:
- Commitment of Traders (COT) report: The COT report, released weekly by the US Commodity Futures Trading Commission (CFTC), shows the positions of various types of traders, including commercial hedgers, large speculators, and small traders. Large speculators’ positions can indicate strong sentiment. For example, if large speculators hold a significant number of long positions, it may indicate overly bullish sentiment.
- Social media and news sentiment: Monitoring financial news outlets and social media platforms like X (formerly Twitter), forums, or specialized trading platforms can give insights into the public's opinion on Gold. Some sentiment tools use AI to aggregate and analyze social sentiment, providing real-time insights on whether the market is leaning bullish or bearish.
- Gold sentiment indicators: Sentiment indicators measure market mood by tracking traders positions or analysts surveys. These indicators may take several forms, for example some brokers provide data about how many traders have taken a long or a short position on Gold. Another example is the FXStreet Gold Forecast Poll which includes analysts' Gold forecasts for the following week, month and quarter, signaling a bullish, bearish or neutral bias for these periods
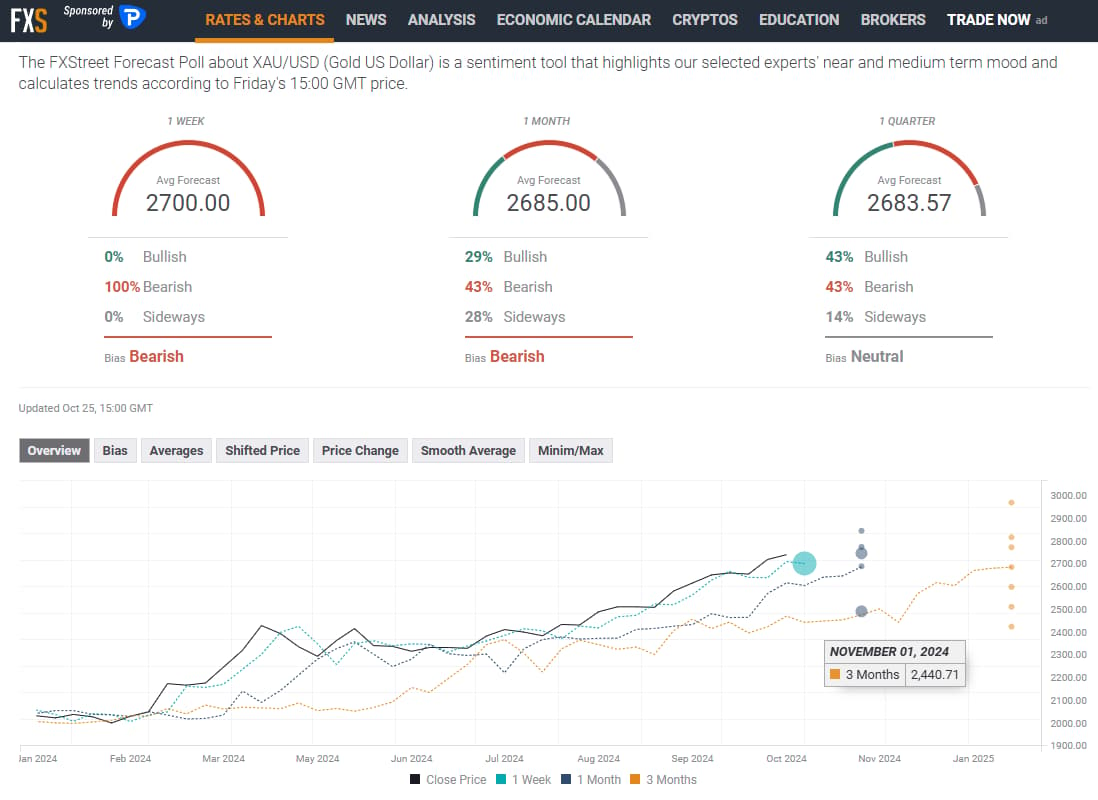
FXStreet Gold Forecast Poll
Once you get a better idea of the overall market sentiment towards Gold, you need to determine your sentiment approach: within the momentum or contrarian.
In a strongly trending market, align trades with the prevailing sentiment. For instance, if sentiment indicators show an increasing number of bullish positions along with positive Gold sentiment, enter a long trade, riding the momentum of the trend.
When sentiment reaches extreme levels, take the opposite stance, expecting a market reversal. If the COT report reveals an unusually high number of long positions (bullish extreme), it could signal that Gold is overbought and due for a correction. Conversely, if sentiment is extremely bearish, consider entering a long position, expecting a rebound.
Sentiment alone can be subjective, and can't give a clear timed trade signal, so use technical analysis to confirm potential trade entries.
Finally, in a momentum trade, exit at the next resistance for long trades or support for short trades, or when sentiment begins to shift. In a contrarian trade, exit when the price retraces to the next key level, or if sentiment normalizes from extreme levels.
Pros:
- Insight into market psychology: Sentiment analysis allows traders to understand the broader market mood, which can be a powerful tool for anticipating potential reversals or trend continuations.
- Works well with extreme levels: Sentiment analysis is particularly effective when the market reaches extreme levels, providing high-probability setups for both momentum and contrarian trades.
Cons:
- Requires additional confirmation: Sentiment alone is not always reliable, and traders should use technical indicators to avoid acting solely on market mood.
- Sentiment can remain extreme: In strongly trending markets, sentiment can stay at extreme levels for extended periods, which may lead to premature entries in contrarian trades. Hence the importance of using technical analysis before entering a trade.
Tips:
Use sentiment extremes in conjunction with support and resistance levels to improve trade accuracy. For example, look for bearish sentiment at support for a potential long setup, or bullish sentiment at resistance for a short setup.
You should focus on major news events, like central bank decisions or significant economic reports, which are likely to have a substantial impact on Gold prices, and avoid low-impact news that may not move the market enough to provide scalping or breakout opportunities.
Sentiment can shift quickly in response to news and events. Stay updated with weekly reports like the COT and daily sentiment indexes, and be prepared to adjust your strategy as sentiment changes.
How to choose a Gold trading strategy

Selecting the right Gold trading strategy depends on your trading style, risk tolerance, time horizon, and market knowledge. Here are key factors to consider:
Trading style and time commitment
If you prefer short-term trades and can dedicate several hours a day to monitoring the market, a strategy like day trading, scalping, or breakout trading might suit you. These strategies require close attention to price movements, technical indicators, and market trends.
However, if you’re unable to monitor the market constantly, a longer-term strategy like trend following or fundamental analysis would be more appropriate. These strategies require less day-to-day involvement and focus more on long-term gains.
Risk tolerance
Your risk tolerance is critical in selecting a strategy. Aggressive traders who are comfortable with higher risk may opt for breakout or scalping strategies, which provide frequent trading opportunities but carry more volatility. On the other hand, conservative traders might gravitate toward range trading or fundamental analysis, which aim for steady, more predictable returns.
It’s important to assess your psychological comfort with risk and avoid strategies that could lead to emotional decision-making, such as chasing after quick profits without proper risk management in place.
Market conditions
Market conditions also play a role in choosing the right strategy. For instance, trend-following strategies work best in markets where Gold prices are trending strongly in one direction. Range-bound strategies are more suitable for periods of consolidation, where the price is moving within a specific range.
Traders should be flexible and willing to adapt their strategy to current market conditions. Many traders find success by combining multiple strategies, using different ones in trending versus ranging markets.
Analytical tools and knowledge
Technical traders might favor strategies like moving averages, Bollinger Bands and Fibonacci retracements, which rely heavily on technical indicators and price charts. If you prefer fundamental analysis, sentiment analysis and news trading, you’ll need to develop a deep understanding of economic reports, monetary policy, and global geopolitical events that affect Gold prices.
Investing time in learning and mastering the analytical tools required for each strategy is essential. While it’s tempting to rely on automated systems, having a solid understanding of the underlying principles will give you greater control and confidence in executing trades.
Conclusion

Gold trading strategies offer a broad range of approaches to suit traders of all levels, from beginner to expert. The key is to understand your goals, risk tolerance, and market conditions, then choose a strategy that aligns with your trading style. Whether you decide to follow trends, trade breakouts, or focus on sentiment and news trading, the success of any strategy depends on discipline, proper risk management, and continuous learning.
Trading Gold can be a rewarding venture, but like all trading, it carries inherent risks. By employing a well-defined strategy and staying informed about global economic factors, traders can navigate the Gold market effectively and capitalize on its potential.
Author
FXStreet Team
FXStreet
Composed of a group of economic journalists and FX experts, the FXStreet content team produces and oversees all content published on FXStreet. It provides a purely journalistic approach to the Forex market.


