![]() Brandon Wendell, CMT
Brandon Wendell, CMT
Brandon Wendell
Prices do not simply move up and down on a chart. Even when the security is in a trend, price will move with the trend, pause and correct, and then continue in the trend direction. Often there will be a pattern observed on the chart when price is in the pausing mode. Understanding and recognizing these patterns can offer traders higher probability trading opportunities.
One of the most common and popular patterns is the flag. The flag formation can either be bullish or bearish depending on the trend and shape. Let’s examine the flag patterns and learn how they can help improve trade decisions.
What Is a Flag Pattern?
The flag pattern is called a flag because the price action on a chart resembles a flag sitting on a pole. The pole is created by a sharp rise or fall in price and is then followed by a sideways trend that ends with another sharp rise or fall in price.
Bull Flag Patterns
A bull flag pattern is formed by a rally in price with an increase in volume. The high volume during the rally exhausts the buying pressure that was propelling price higher, which forms the pole. Price then consolidates, forming the flag, and then moves either sideways or against the trend as investors wait for more buying pressure to build up.
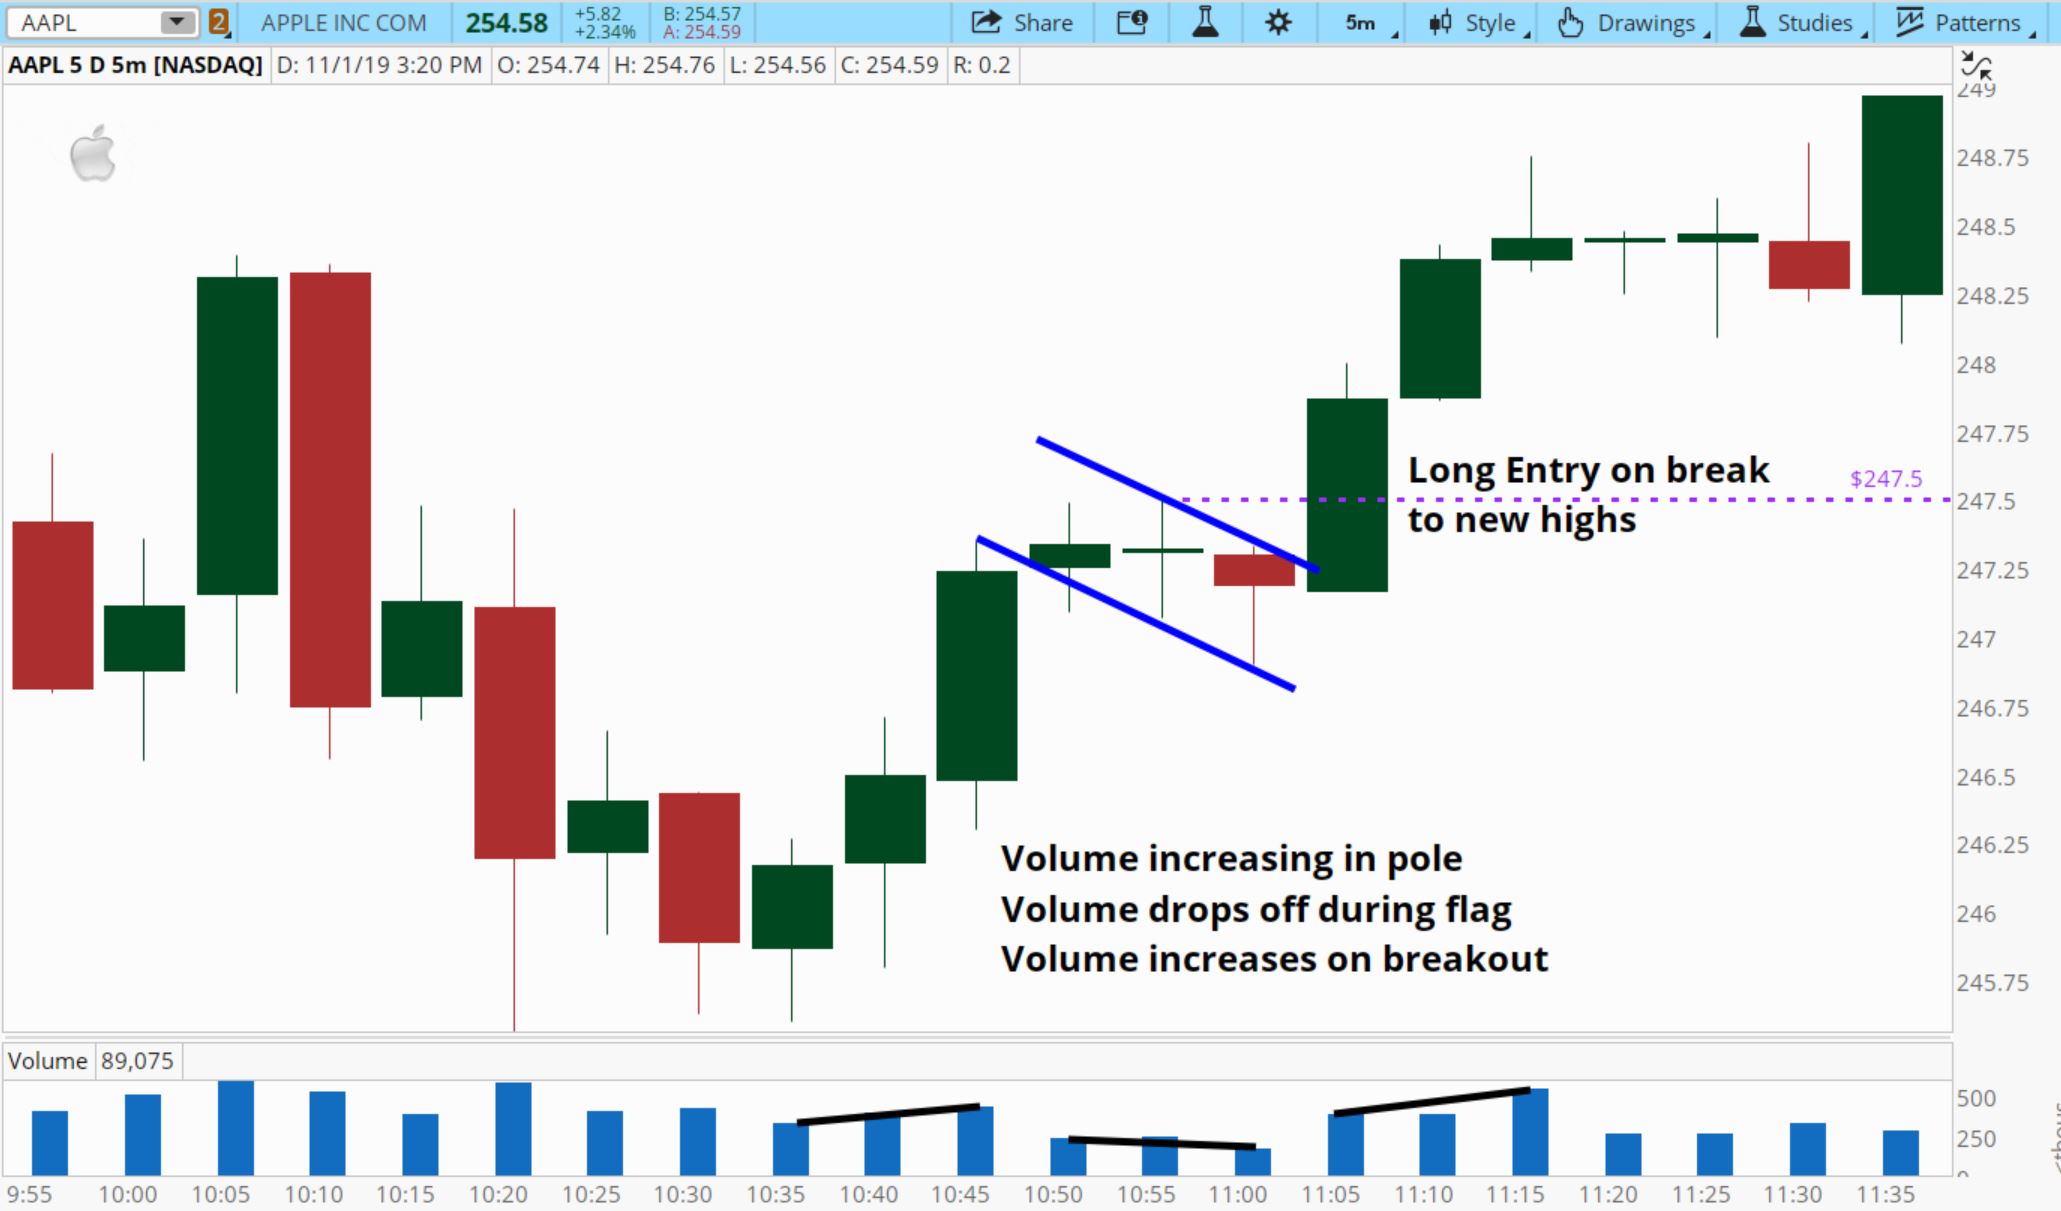
How to Trade a Bull Flag Pattern
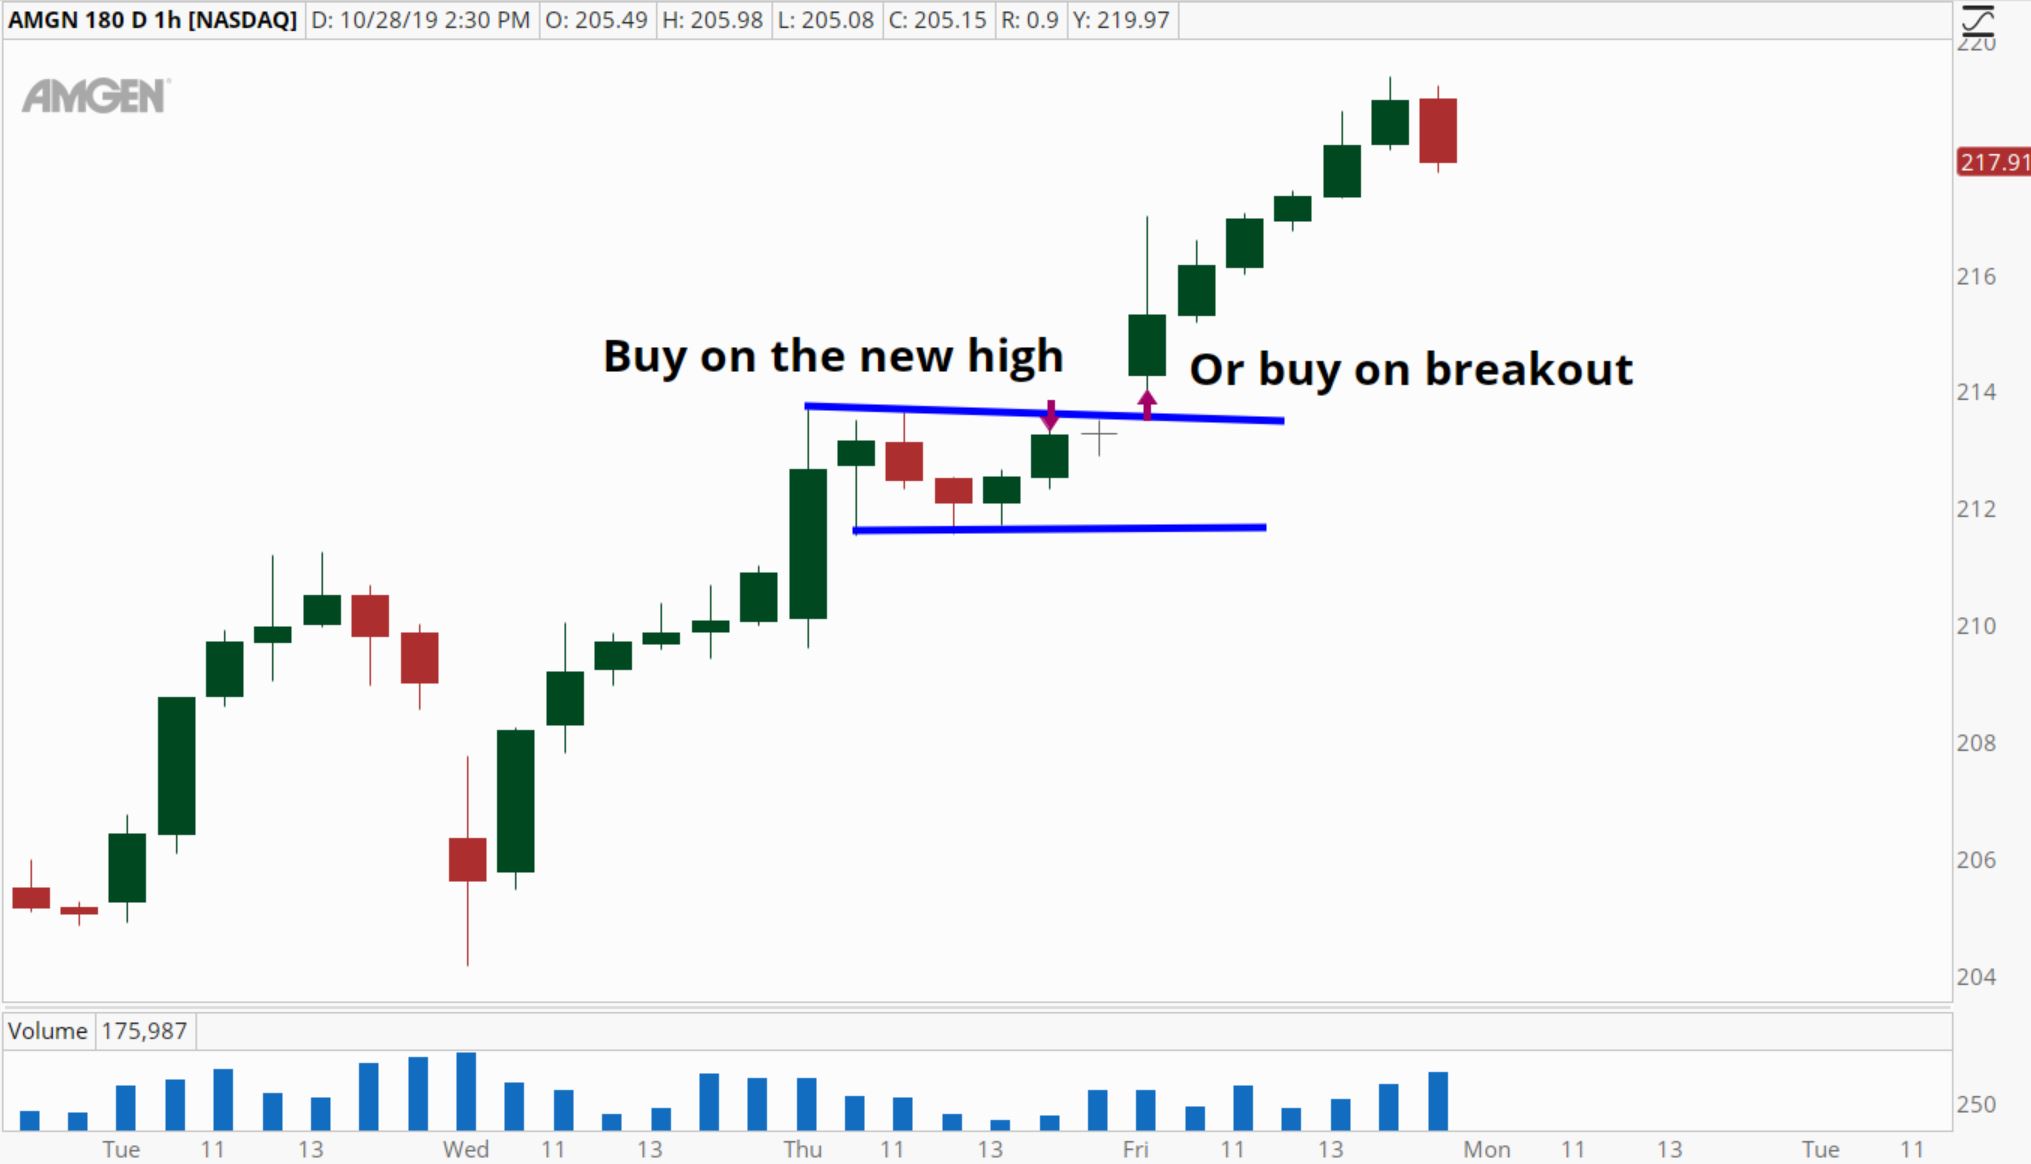
When trading bull flag patterns, there are several potential entry areas for a long position. The first long entry can be taken once prices break upwards out of the flag itself. A second potential entry point is when price makes a new high. Lastly, traders can wait for prices to retest the breakout point by changing their chart to a lower time frame.
A stop loss can be set below the beginning of the flag formation or one times the Average True Range below the entry price.
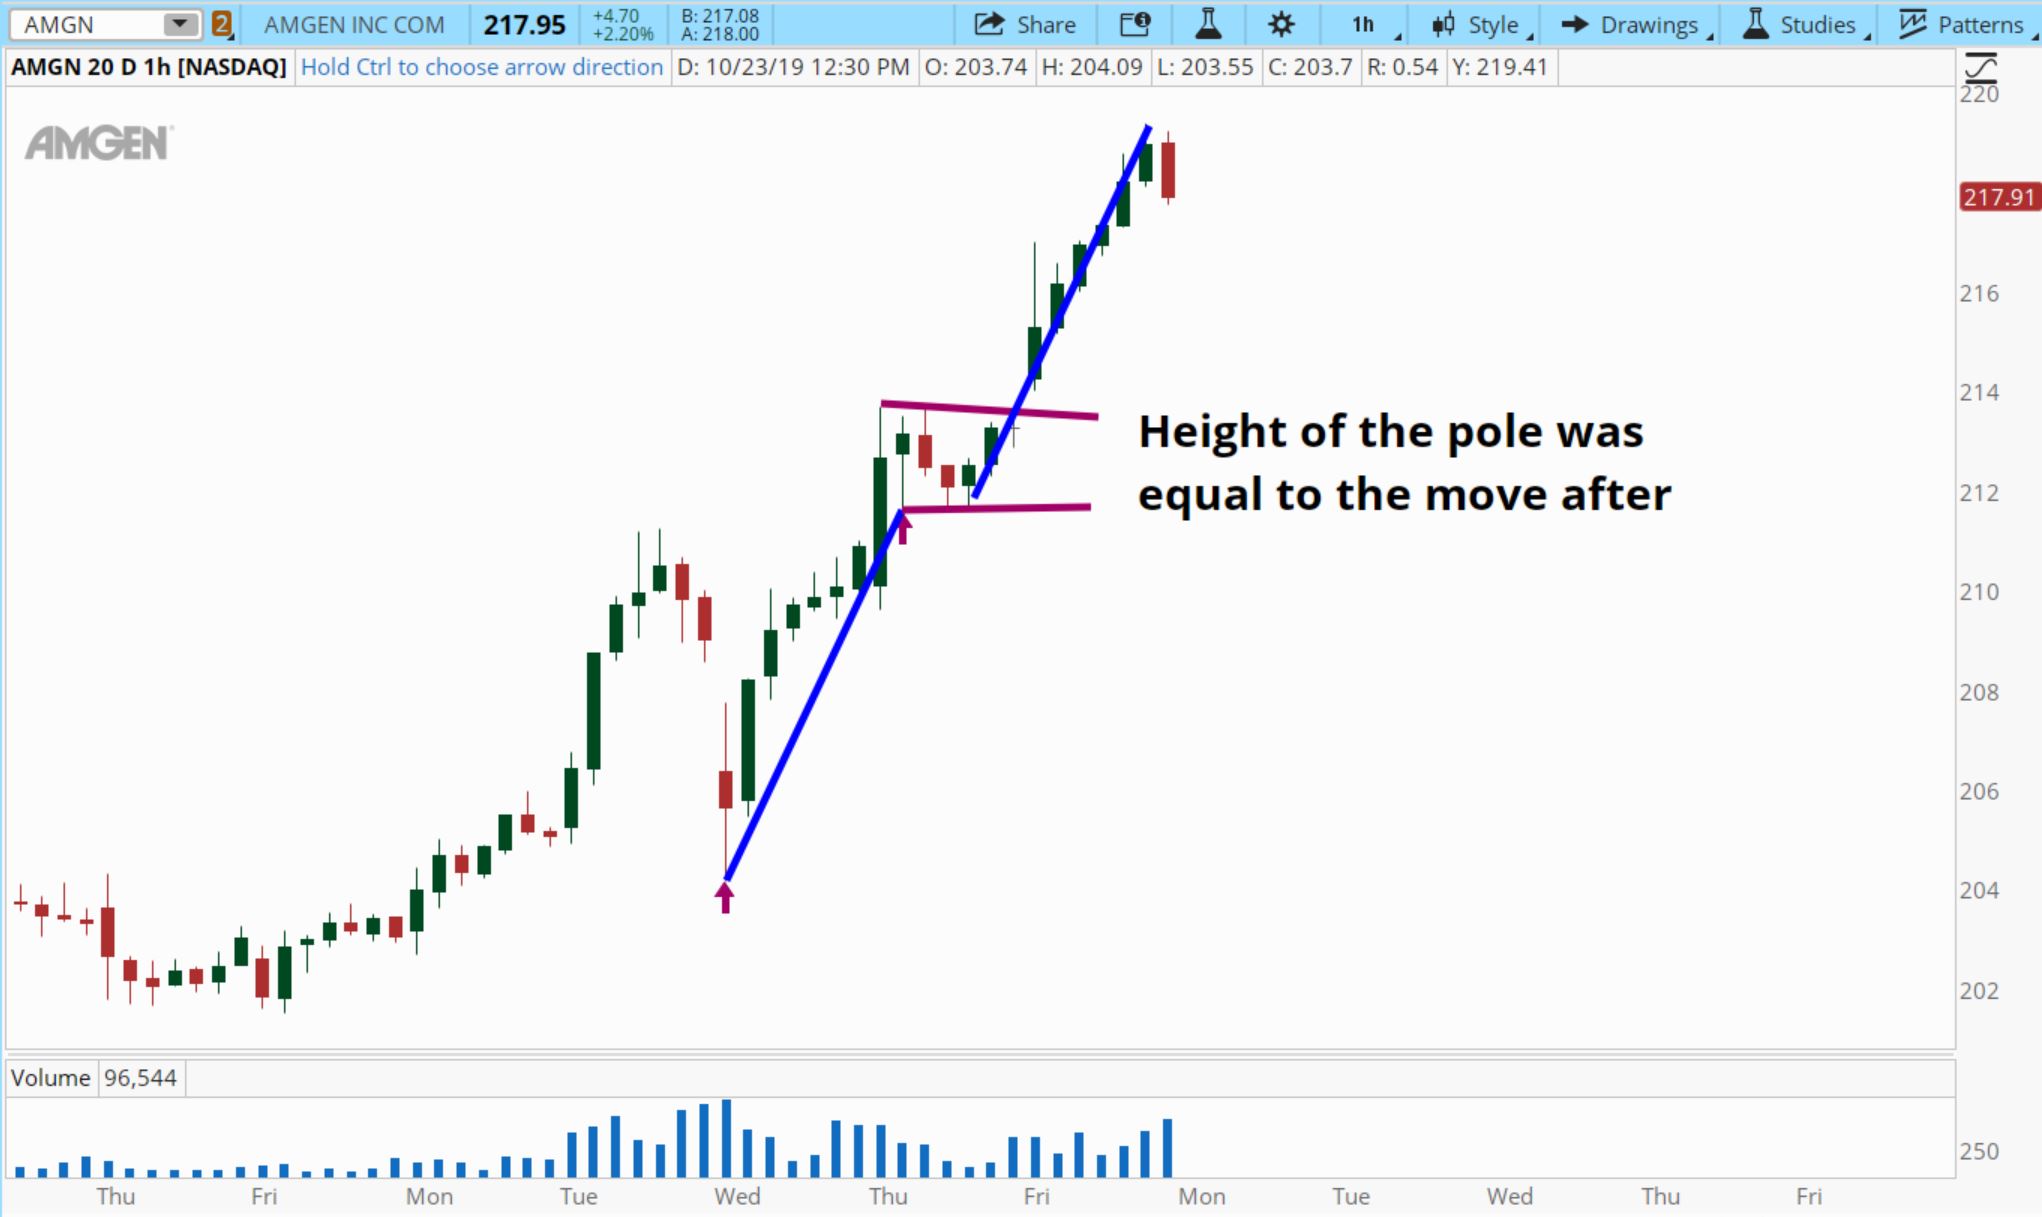
The flag is often said to be flying at half-mast. This means that the move following the breakout of the flag is often equal in size to the move before the flag itself. So, the target for the trade can be a move equal to the size of the flagpole.
Traders should always identify their supply or demand zones, as they are more powerful and reliable than measured moves in patterns for setting targets.
For a long position, the next supply zone on the chart would make the best target.
Bear Flag Pattern
The bear flag is a consolidation pattern that follows a sharp selloff. The volume characteristics should be the same as what we saw for the bull flag. Increase in volume on the initial drop, then a drop in volume during the flag/consolidation, and an increase in volume after the breakdown.
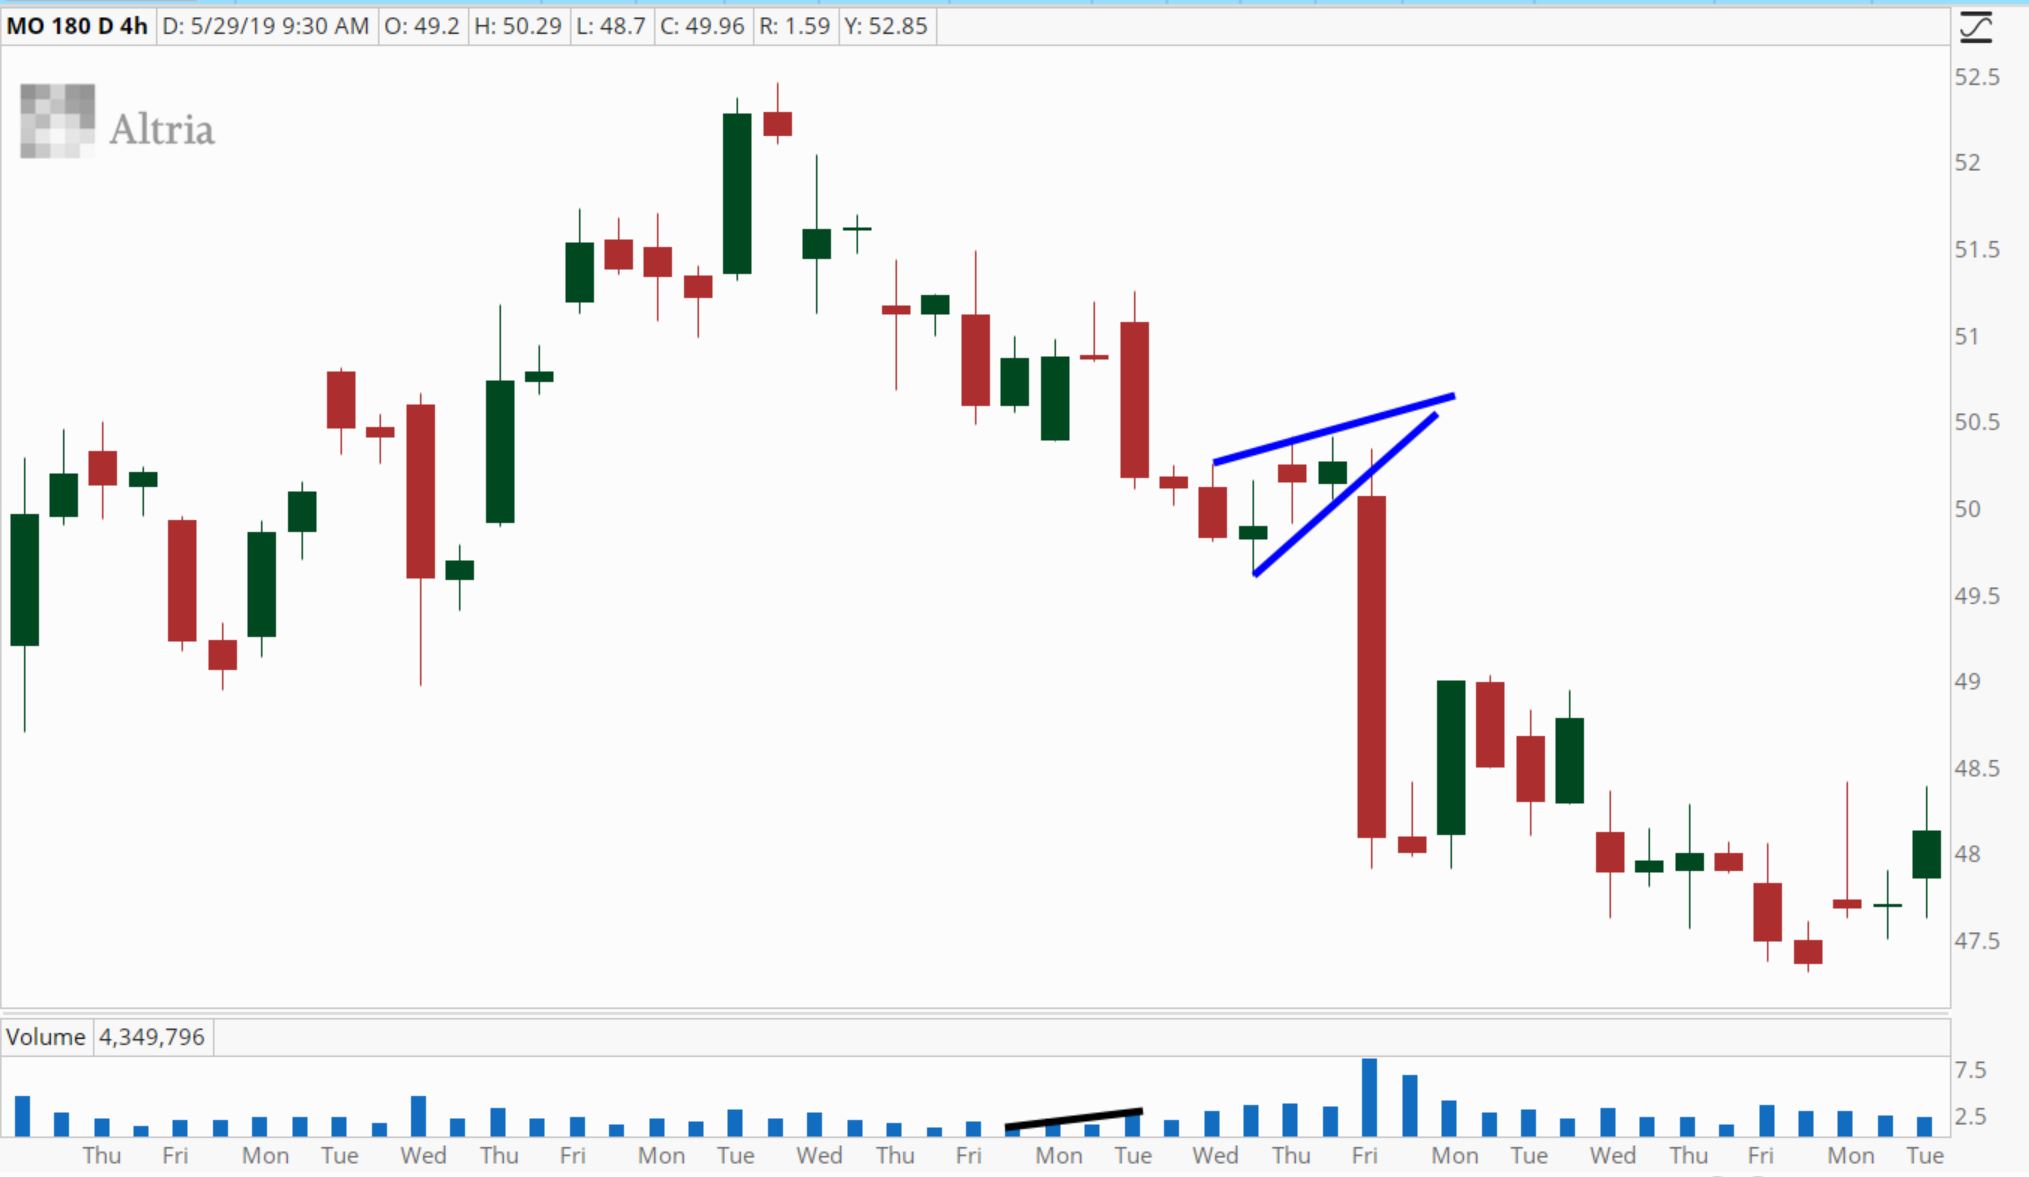
How to Trade a Bear Flag Pattern
The trading strategy is similar to that of the bull flag pattern. Entry for a short is when prices break down to a fresh low, a breakout of the flag, or a retest of the breakout point after the flag was formed.
Keep in mind that the patterns are just an odds enhancer for Online Trading Academy’s Core Strategy. The Core Strategy should always be followed without fail. If you are not familiar with Core Strategy, enroll in an introductory class and learn strategies to help you navigate the financial markets.
Neither Freedom Management Partners nor any of its personnel are registered broker-dealers or investment advisers. I will mention that I consider certain securities or positions to be good candidates for the types of strategies we are discussing or illustrating. Because I consider the securities or positions appropriate to the discussion or for illustration purposes does not mean that I am telling you to trade the strategies or securities. Keep in mind that we are not providing you with recommendations or personalized advice about your trading activities. The information we are providing is not tailored to any individual. Any mention of a particular security is not a recommendation to buy, sell, or hold that or any other security or a suggestion that it is suitable for any specific person. Keep in mind that all trading involves a risk of loss, and this will always be the situation, regardless of whether we are discussing strategies that are intended to limit risk. Also, Freedom Management Partners’ personnel are not subject to trading restrictions. I and others at Freedom Management Partners could have a position in a security or initiate a position in a security at any time.
Editors’ Picks

EUR/USD: US Dollar to remain pressured until uncertainty fog dissipates
Unimpressive European Central Bank left monetary policy unchanged for the fifth consecutive meeting. The United States first-tier employment and inflation data is scheduled for the second week of February. EUR/USD battles to remain afloat above 1.1800, sellers moving to the sidelines.

GBP/USD softens to near 1.3600 as BoE hints further rate cuts
The GBP/USD pair loses ground to near 1.3610 during the early Asian session on Monday. The Pound Sterling softens against the Greenback amid growing expectations of the Bank of England’s interest-rate cut. Traders will take more cues from the Fedspeak later on Monday.

USD/JPY drops back below 157.00 on Japan's verbal intervention
USD/JPY has come under moderate selling pressure below 157.00 in the Asian session on Monday. The Japanese Yen lost ground to near 157.70 following Japan’s ruling Liberal Democratic Party's outright majority win in Sunday’s lower house election, opening the door to more fiscal stimulus by Prime Minister Sanae Takaichi. However, JPY buyers jumped back and dragged the pair southward on FX verbal intervention by Japan’s Finance Minister Katayama.
Editors’ Picks
USD/JPY drops back below 157.00 on Japan's verbal intervention
USD/JPY has come under moderate selling pressure below 157.00 in the Asian session on Monday. The Japanese Yen lost ground to near 157.70 following Japan’s ruling Liberal Democratic Party's outright majority win in Sunday’s lower house election, opening the door to more fiscal stimulus by Prime Minister Sanae Takaichi. However, JPY buyers jumped back and dragged the pair southward on FX verbal intervention by Japan’s Finance Minister Katayama.

Gold eyes acceptance above $5,000, kicking off a big week
Gold is consolidating the latest uptick at around the $5,000 mark, with buyers gathering pace for a sustained uptrend as a critical week kicks off. All eyes remain on the delayed Nonfarm Payrolls and Consumer Price Index data from the United States due on Wednesday and Friday, respectively.

AUD/USD: Buyers eyes 0.7050 amid upbeat mood
AUD/USD builds on Friday's goodish rebound from sub-0.6900 levels and kicks off the new week on a positive note, with bulls awaiting a sustained move and acceptance above mid-0.7000s before placing fresh bets. The widening RBA-Fed divergence, along with the upbeat market mood, acts as a tailwind for the risk-sensitive Aussie amid some follow-through US Dollar selling for the second straight day.

Top Crypto Gainers: Aster, Decred, and Kaspa rise as selling pressure wanes
Altcoins such as Aster, Decred, and Kaspa are leading the broader cryptocurrency market recovery over the last 24 hours, as Bitcoin holds above $70,000 on Monday, up from the $60,000 dip on Thursday.

Weekly column: Saturn-Neptune and the end of the Dollar’s 15-year bull cycle
Tariffs are not only inflationary for a nation but also risk undermining the trust and credibility that go hand in hand with the responsibility of being the leading nation in the free world and controlling the world’s reserve currency.
RECOMMENDED LESSONS
Making money in forex is easy if you know how the bankers trade!
I’m often mystified in my educational forex articles why so many traders struggle to make consistent money out of forex trading. The answer has more to do with what they don’t know than what they do know. After working in investment banks for 20 years many of which were as a Chief trader its second knowledge how to extract cash out of the market.
5 Forex News Events You Need To Know
In the fast moving world of currency markets where huge moves can seemingly come from nowhere, it is extremely important for new traders to learn about the various economic indicators and forex news events and releases that shape the markets. Indeed, quickly getting a handle on which data to look out for, what it means, and how to trade it can see new traders quickly become far more profitable and sets up the road to long term success.
Top 10 Chart Patterns Every Trader Should Know
Chart patterns are one of the most effective trading tools for a trader. They are pure price-action, and form on the basis of underlying buying and selling pressure. Chart patterns have a proven track-record, and traders use them to identify continuation or reversal signals, to open positions and identify price targets.
7 Ways to Avoid Forex Scams
The forex industry is recently seeing more and more scams. Here are 7 ways to avoid losing your money in such scams: Forex scams are becoming frequent. Michael Greenberg reports on luxurious expenses, including a submarine bought from the money taken from forex traders. Here’s another report of a forex fraud. So, how can we avoid falling in such forex scams?
What Are the 10 Fatal Mistakes Traders Make
Trading is exciting. Trading is hard. Trading is extremely hard. Some say that it takes more than 10,000 hours to master. Others believe that trading is the way to quick riches. They might be both wrong. What is important to know that no matter how experienced you are, mistakes will be part of the trading process.
The challenge: Timing the market and trader psychology
Successful trading often comes down to timing – entering and exiting trades at the right moments. Yet timing the market is notoriously difficult, largely because human psychology can derail even the best plans. Two powerful emotions in particular – fear and greed – tend to drive trading decisions off course.