One of the many rewards of being an instructor at Online Trading Academy is the interaction received from students, both in the classroom and via email.  The questions and challenges are what keeps you sharp as a trader.  By constantly recalling my knowledge and seeing trading concepts through the eyes of new traders, it prevents me from becoming stale and makes me a better trader.

While teaching and trading live in the Extended Learning Track (XLT), this morning, a topic that kept coming up was on candle shape and the importance of price arrival to a supply or demand zone.  This reminded me of an old email I received from a student.

“I want you to tell me the importance of how a price comes back to a level?  What is the significance of how it arrives, if it comes in like a glider plane or a lead balloon?  I think what is important is how it leaves but the arrival is an odd’s enhancer.  I am a ‘why’ guy.  So why is arrival so important?”

This is a great question and the answer highlights the true market forces behind price movement, fear and greed.  I want you to think about a flagpole.  If I climbed to the top of that pole it would hold my weight.  However, as more and more people climbed up to the top of that same pole, eventually it would bend and break from the added weight.  Prices are similar.  Stock prices rise because of demand.  The demand being greater than the supply causes buyers to outbid each other in an attempt to attract elusive supply and climb the pole.  At some point, the buyers have exhausted themselves and everyone who wanted to buy has already done so or is prevented from buying due to the high cost.

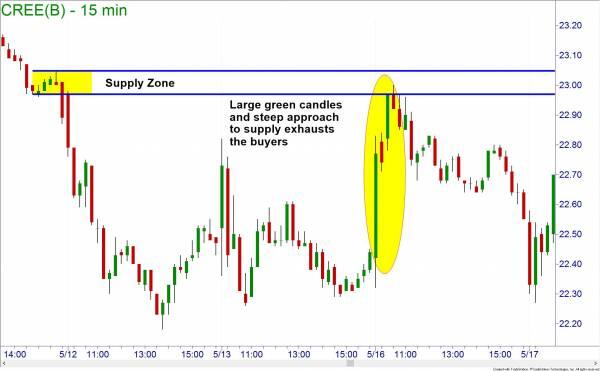
Prices start to fall as fear takes hold.  Most investors and traders will start to panic when the price starts moving against them (market reversals) or their stops will be triggered.  If there was a lot of buying pressure and large green candles going into the supply level, there will be few buyers to stop the collapse and catch the supply being dumped onto the markets from stop orders being triggered.

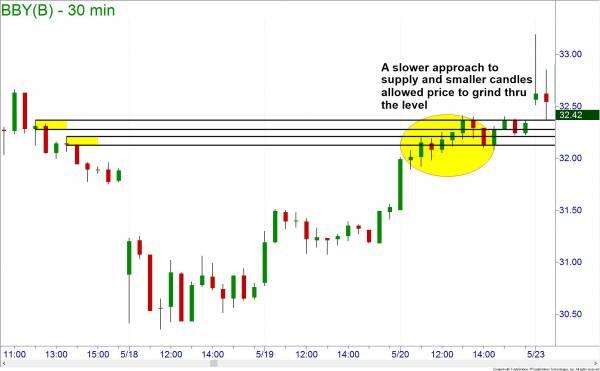
Compare this with a gradual climb that features smaller green candles and some small pullbacks to shake out weak traders.  As prices fall away from a supply level in this scenario, they will be met with less stop orders and more buying pressure as the demand was not exhausted on the way up.

Stocks

When the approach to the supply level is slower and had smaller candles, price is more likely to break through the level rather than respect it.

Stocks

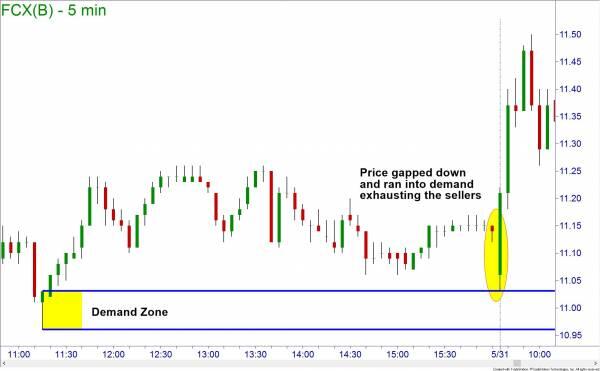
Arrival to demand zones are also important.  If you arrive to the demand with large red candles signaling panic and fear, you are likely to have a bigger and better bounce.  The large red candles signal that everyone who wanted to sell has now exited the stock.  When buyers step in they must raise their bids quickly to attract a seller who may still be around.

Stocks

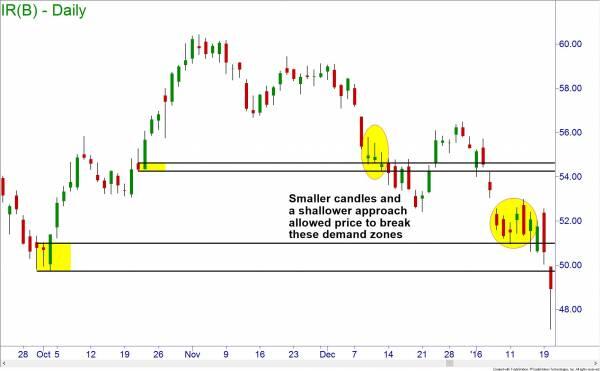
If the arrival to the demand zone is quiet, there are still many worried holders of the stock who are looking to sell at a smaller loss when the bounce occurs.  This added supply will mute the bounce of price from the demand level.

Stocks

So one of the important odds enhancers for analyzing our trades is how price arrives to test the supply or demand level.  To learn all of the other odds enhancers, be sure to visit your local Online Trading Academy Center and enroll for one of our trading courses.  Until next time, trade safe and trade well!

Learn to Trade Now


Neither Freedom Management Partners nor any of its personnel are registered broker-dealers or investment advisers. I will mention that I consider certain securities or positions to be good candidates for the types of strategies we are discussing or illustrating. Because I consider the securities or positions appropriate to the discussion or for illustration purposes does not mean that I am telling you to trade the strategies or securities. Keep in mind that we are not providing you with recommendations or personalized advice about your trading activities. The information we are providing is not tailored to any individual. Any mention of a particular security is not a recommendation to buy, sell, or hold that or any other security or a suggestion that it is suitable for any specific person. Keep in mind that all trading involves a risk of loss, and this will always be the situation, regardless of whether we are discussing strategies that are intended to limit risk. Also, Freedom Management Partners’ personnel are not subject to trading restrictions. I and others at Freedom Management Partners could have a position in a security or initiate a position in a security at any time.

Editors’ Picks

EUR/USD drops to daily lows near 1.1630

EUR/USD drops to daily lows near 1.1630

EUR/USD now loses some traction and slips back to the area of daily lows around 1.1630 on the back of a mild bounce in the US Dollar. Fresh US data, including the September PCE inflation numbers and the latest read on December consumer sentiment, didn’t really move the needle, so the pair is still on course to finish the week with a respectable gain.

GBP/USD trims gains, recedes toward 1.3320

GBP/USD trims gains, recedes toward 1.3320

GBP/USD is struggling to keep its daily advance, coming under fresh pressure and retreating to the 1.3320 zone following a mild bullish attempt in the Greenback. Even though US consumer sentiment surprised to the upside, the US Dollar isn’t getting much love, as traders are far more interested in what the Fed will say next week.

Japanese Yen refreshes three-week high vs USD; seems poised to appreciate further

Japanese Yen refreshes three-week high vs USD; seems poised to appreciate further

The Japanese Yen retains bullish bias as BoJ rate hike bets offset dismal Household Spending data. Dovish Fed expectations fail to assist the USD in attracting buyers and keep a lid on the USD/JPY pair. Traders keenly await the US PCE Price Index for Fed rate-cut cues and a fresh directional impetus.


Editors’ Picks

EUR/USD drops to daily lows near 1.1630

EUR/USD drops to daily lows near 1.1630

EUR/USD now loses some traction and slips back to the area of daily lows around 1.1630 on the back of a mild bounce in the US Dollar. Fresh US data, including the September PCE inflation numbers and the latest read on December consumer sentiment, didn’t really move the needle, so the pair is still on course to finish the week with a respectable gain.

GBP/USD trims gains, recedes toward 1.3320

GBP/USD trims gains, recedes toward 1.3320

GBP/USD is struggling to keep its daily advance, coming under fresh pressure and retreating to the 1.3320 zone following a mild bullish attempt in the Greenback. Even though US consumer sentiment surprised to the upside, the US Dollar isn’t getting much love, as traders are far more interested in what the Fed will say next week.

Gold makes a U-turn, back to $4,200

Gold makes a U-turn, back to $4,200

Gold is now losing the grip and receding to the key $4,200 region per troy ounce following some signs of life in the Greenback and a marked bounce in US Treasury yields across the board. The positive outlook for the precious metal, however, remains underpinned by steady bets for extra easing by the Fed.

Crypto Today: Bitcoin, Ethereum, XRP pare gains despite increasing hopes of upcoming Fed rate cut

Crypto Today: Bitcoin, Ethereum, XRP pare gains despite increasing hopes of upcoming Fed rate cut

Bitcoin is steadying above $91,000 at the time of writing on Friday. Ethereum remains above $3,100, reflecting positive sentiment ahead of the Federal Reserve's (Fed) monetary policy meeting on December 10.

Week ahead – Rate cut or market shock? The Fed decides

Week ahead – Rate cut or market shock? The Fed decides

Fed rate cut widely expected; dot plot and overall meeting rhetoric also matter. Risk appetite is supported by Fed rate cut expectations; cryptos show signs of life. RBA, BoC and SNB also meet; chances of surprises are relatively low.

RECOMMENDED LESSONS

5 Forex News Events You Need To Know

In the fast moving world of currency markets where huge moves can seemingly come from nowhere, it is extremely important for new traders to learn about the various economic indicators and forex news events and releases that shape the markets. Indeed, quickly getting a handle on which data to look out for, what it means, and how to trade it can see new traders quickly become far more profitable and sets up the road to long term success.

Top 10 Chart Patterns Every Trader Should Know

Chart patterns are one of the most effective trading tools for a trader. They are pure price-action, and form on the basis of underlying buying and selling pressure. Chart patterns have a proven track-record, and traders use them to identify continuation or reversal signals, to open positions and identify price targets.

7 Ways to Avoid Forex Scams

The forex industry is recently seeing more and more scams. Here are 7 ways to avoid losing your money in such scams: Forex scams are becoming frequent. Michael Greenberg reports on luxurious expenses, including a submarine bought from the money taken from forex traders. Here’s another report of a forex fraud. So, how can we avoid falling in such forex scams?

What Are the 10 Fatal Mistakes Traders Make

Trading is exciting. Trading is hard. Trading is extremely hard. Some say that it takes more than 10,000 hours to master. Others believe that trading is the way to quick riches. They might be both wrong. What is important to know that no matter how experienced you are, mistakes will be part of the trading process.

Strategy

Money Management

Psychology

Best Brokers of 2025