![]() Brandon Wendell, CMT
Brandon Wendell, CMT
Brandon Wendell
There are a lot of “experts” attempting to predict the future market direction and advising you on what to do with your 401k and other retirement money. One of the biggest problems with the conventional wisdom is that financial advisors love to tell you when to get into the markets but fail to tell you when to exit. They often profit from your money staying fully invested in mutual funds and annuities and would rather have you suffer and stress during market turndowns rather than helping you protect your money and increase returns with market timing.
There are simple techniques, such as spread ratio, that you can use to help you identify major shifts in the market sentiment. While this won’t offer you exact timing on when to buy or when to sell, it can make you aware of when to start looking into safe haven investments and when to look for aggressive gain securities. You can then apply Online Trading Academy’s Core Strategy to enter and exit the markets properly.
Traders and investors will often anticipate the potential direction of the economy and adjust their positions accordingly. If you monitor the performance of the sectors they are putting money into, you can start to see which is leading. Certain sectors outperform the others when the markets are bullish and others will outperform in bearish markets.
The sectors that usually represent the bullish and bearish extremes of the equity markets are the Consumer Discretionary and Consumer Staples. According to Investopedia, the Consumer Discretionary Sector is, “A sector of the economy that consists of businesses that sell nonessential goods and services. Companies in this sector include retailers, media companies, consumer services companies, consumer durables and apparel companies, and automobiles and components companies.” They define Consumer Staples as, “The industries that manufacture and sell food/beverages, tobacco, prescription drugs and household products.”
When markets are poised for a strong rise, investors and traders would buy the discretionary companies and that sector would outperform the staples. During times of economic bust, one would expect the discretionary companies to underperform staples as investors would not buy companies facing slow or no growth.
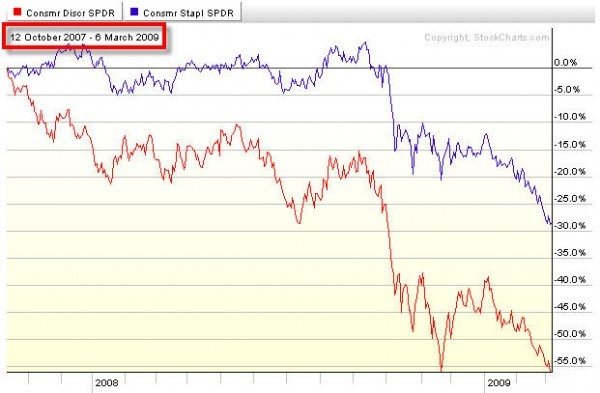
We saw this exhibited during the 2008 financial crisis. While both sectors dropped, the staples did maintain more value while the discretionary dove.
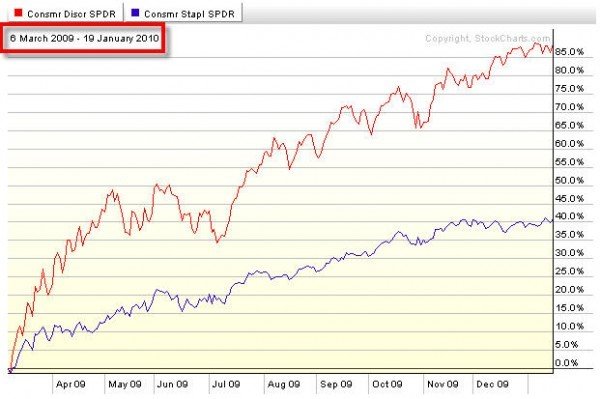
When the markets turned bullish in 2009, the opposite occurred.
As a chartist, there is a way to use this relationship and fine tune turning points in the market. TradeStation has a useful technical indicator called the Spread Ratio. This tool allows the trader to see a visual representation of the price of one security divided by another. By using trend lines, a trader can observe changes in the performance of two securities and make decisions about the broad markets.
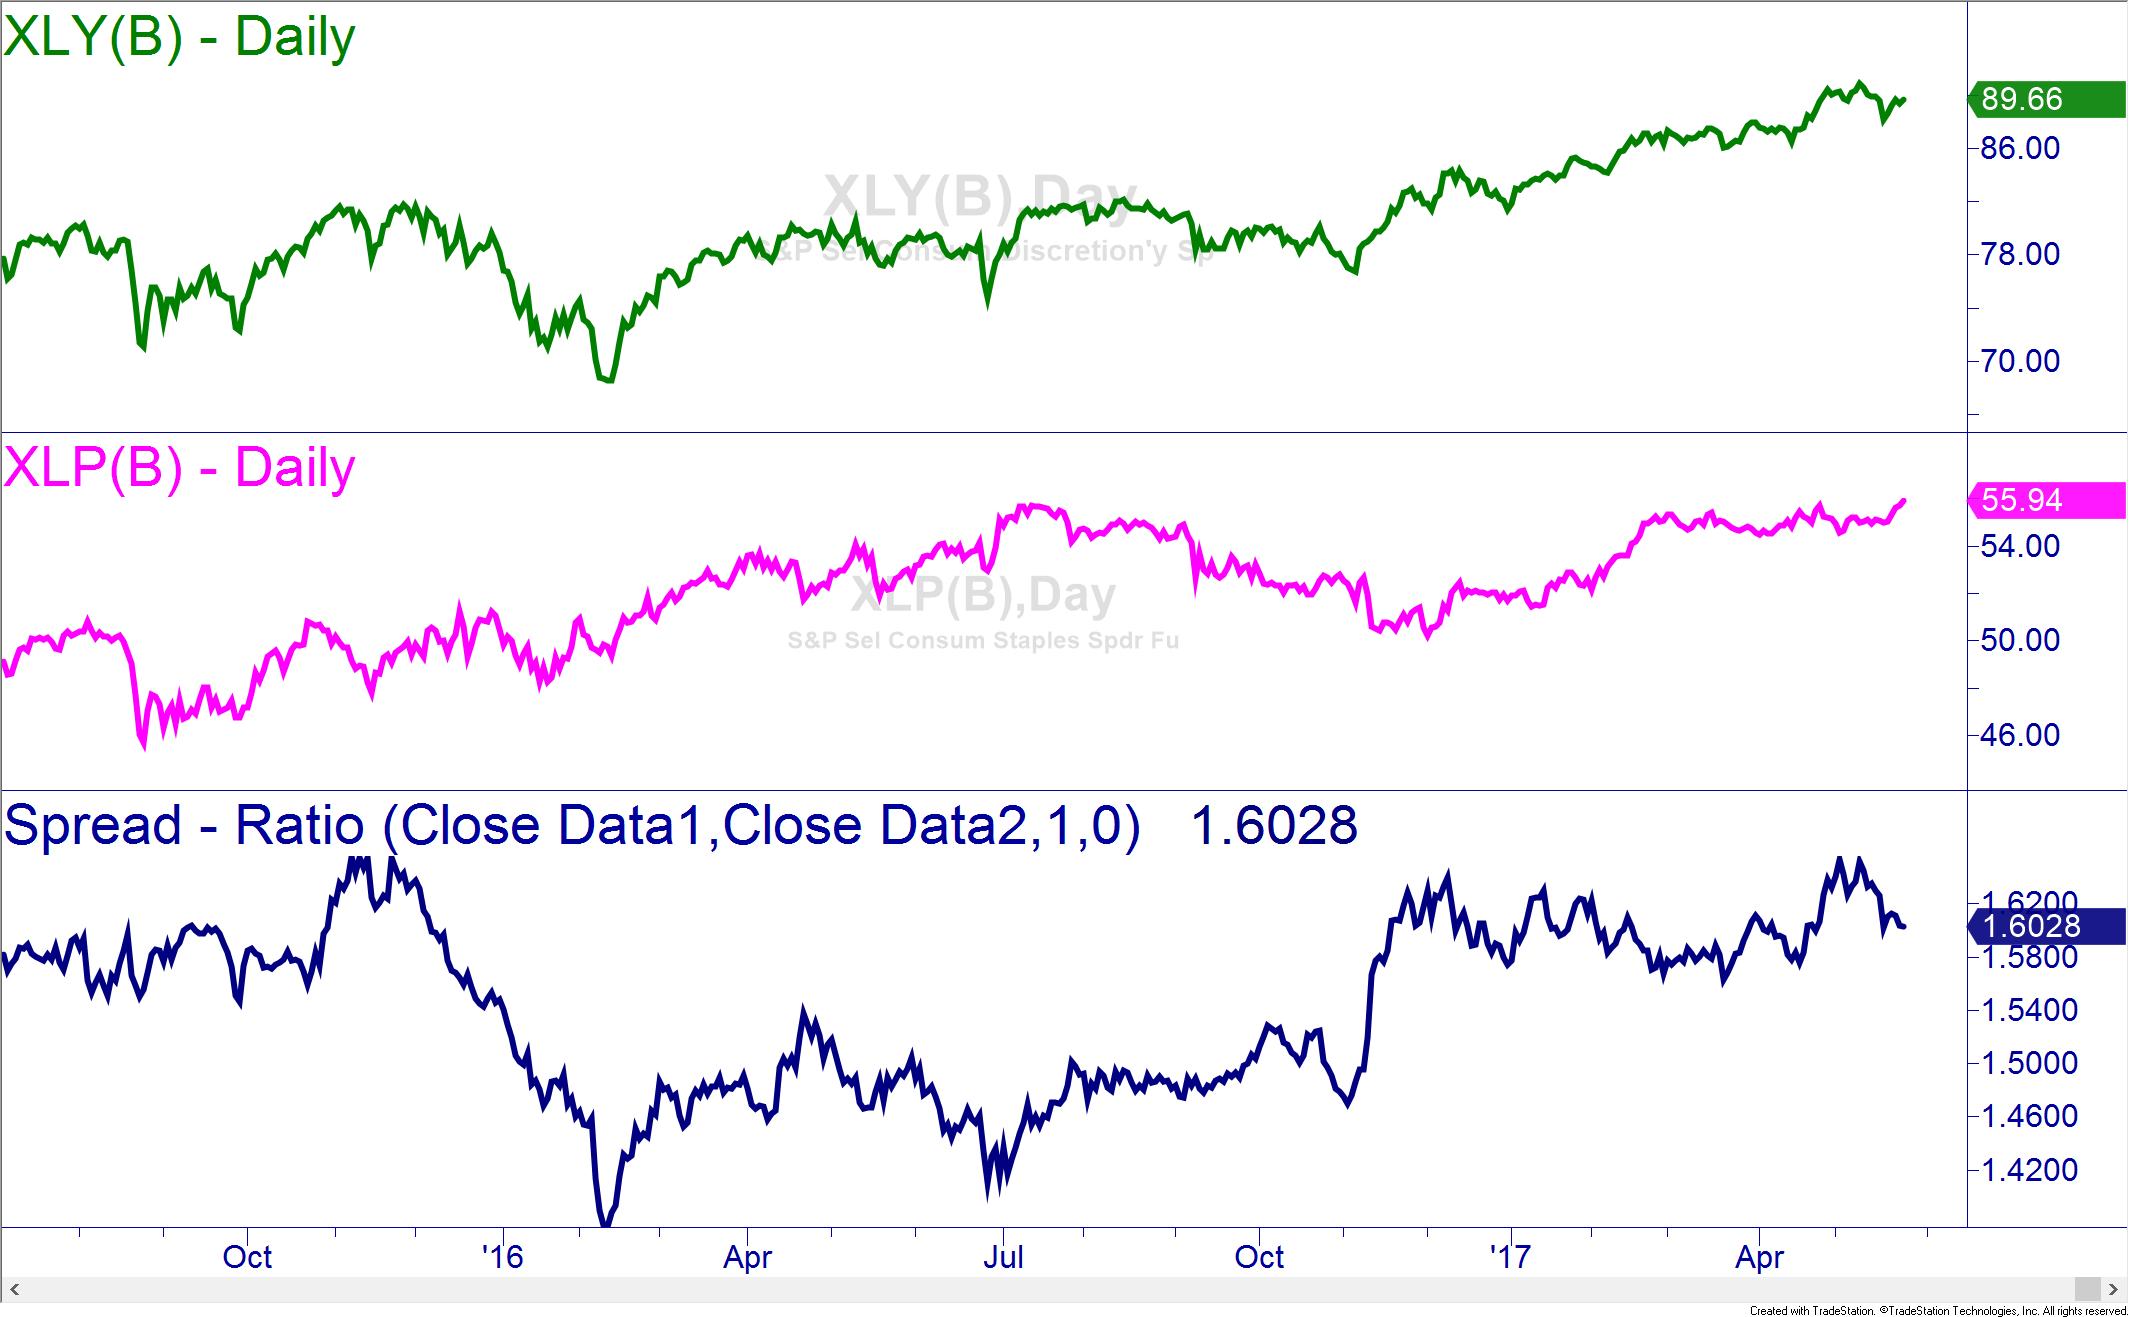
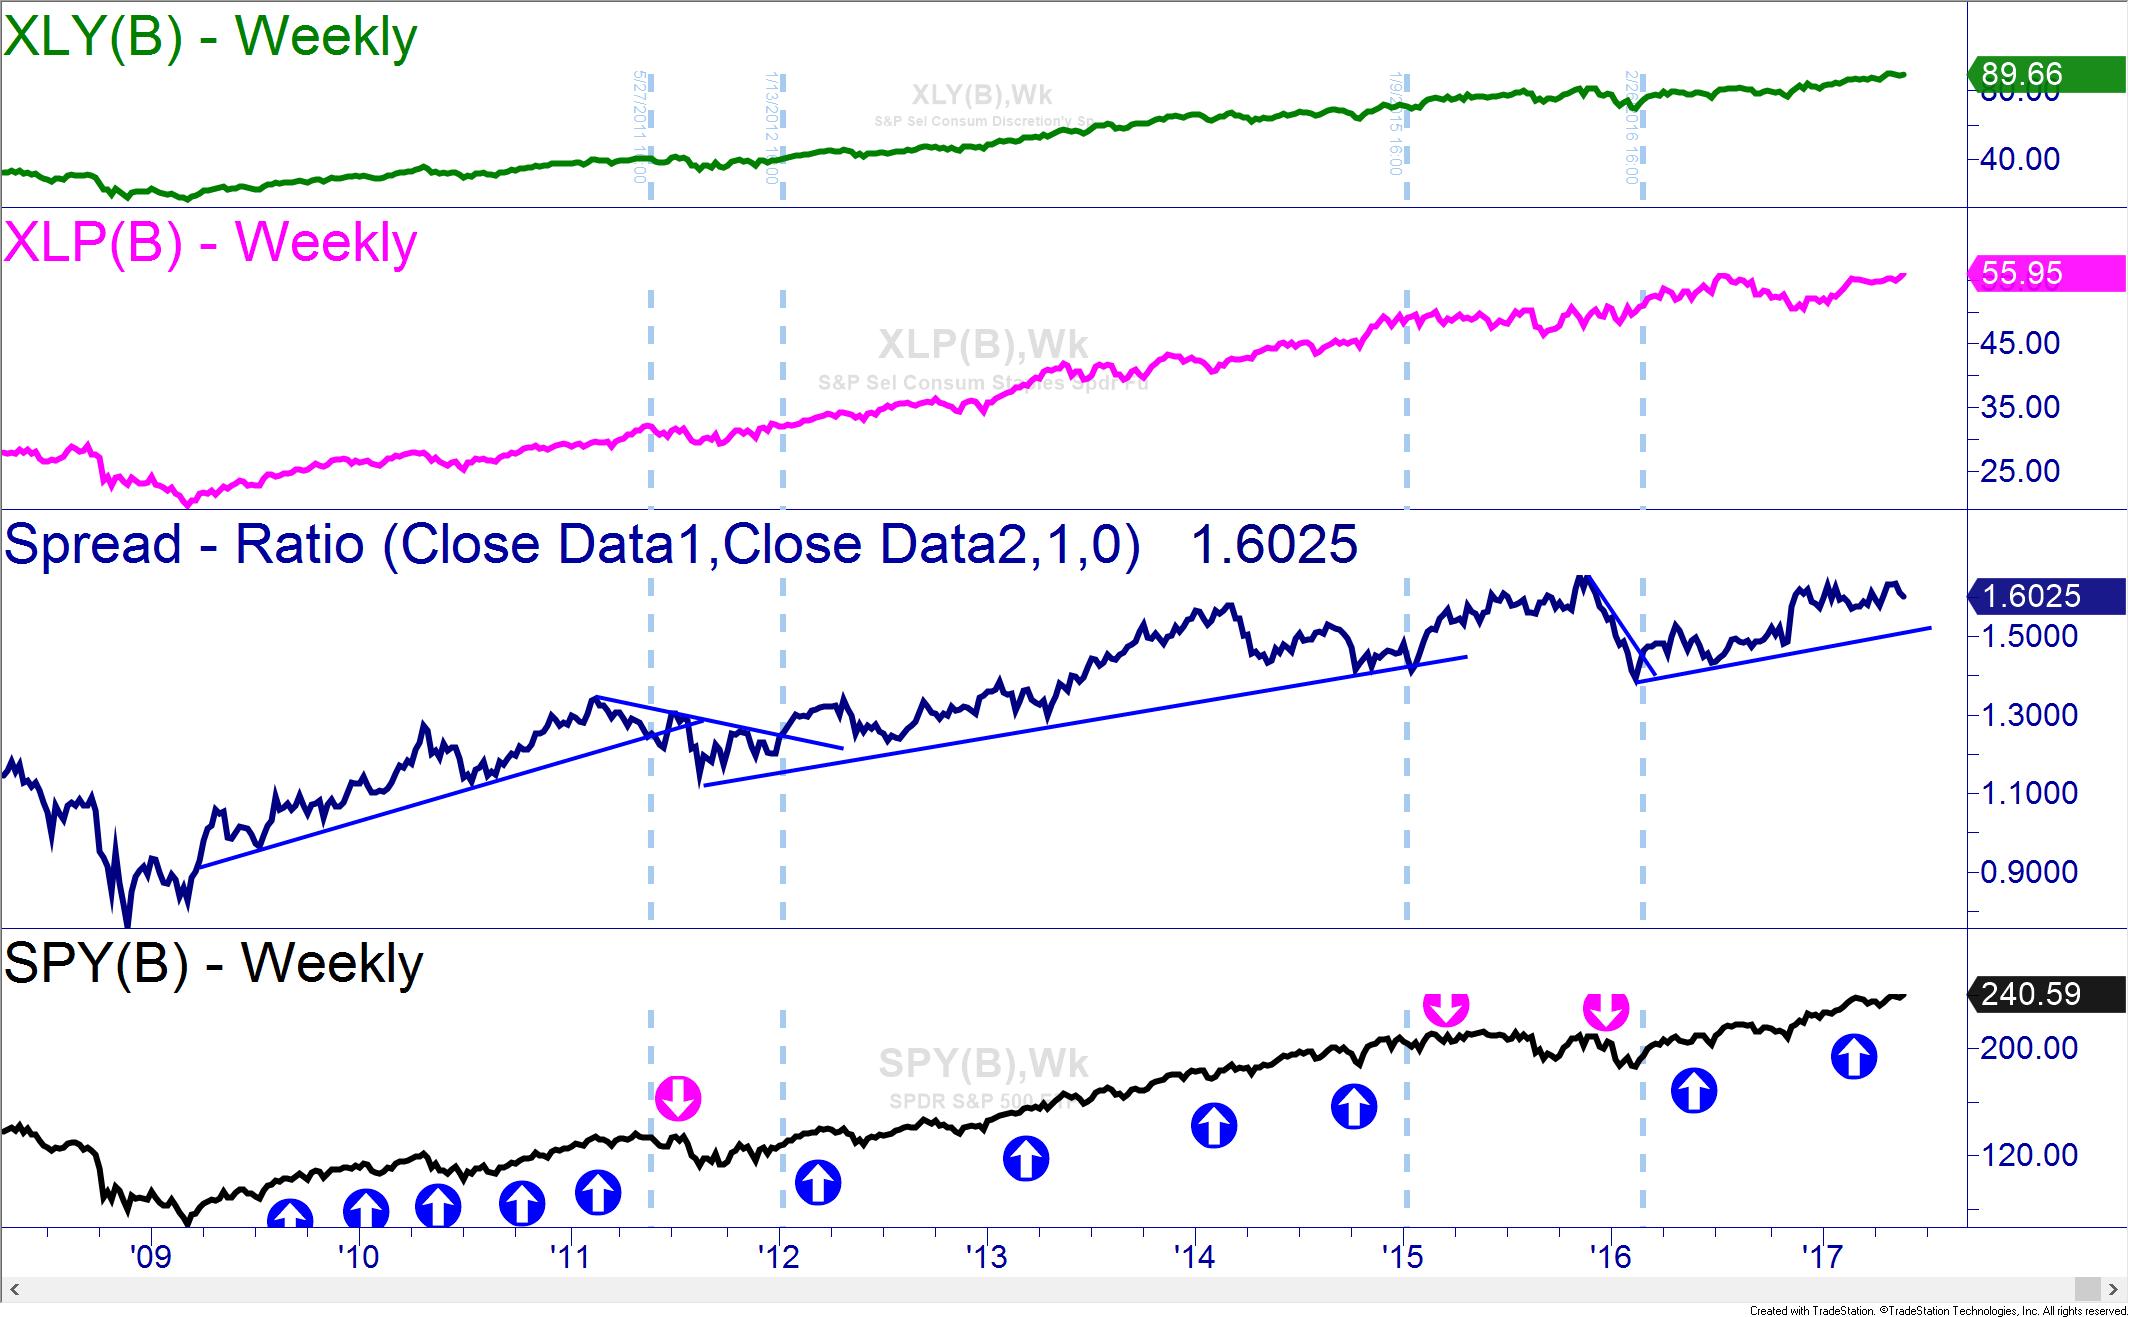
To see changes in the overall market, I use a spread ratio that divides the closing price of the XLY, the consumer discretionary ETF, by the closing price of the XLP, the consumer staples ETF. If the ratio line is rising, the discretionary are outperforming the staples and we are in a bullish trend. Should the trend break and the ratio line decline, we are experiencing a bearish move and trend in the markets. Support and resistance work the same on the ratio as they would on a stock.
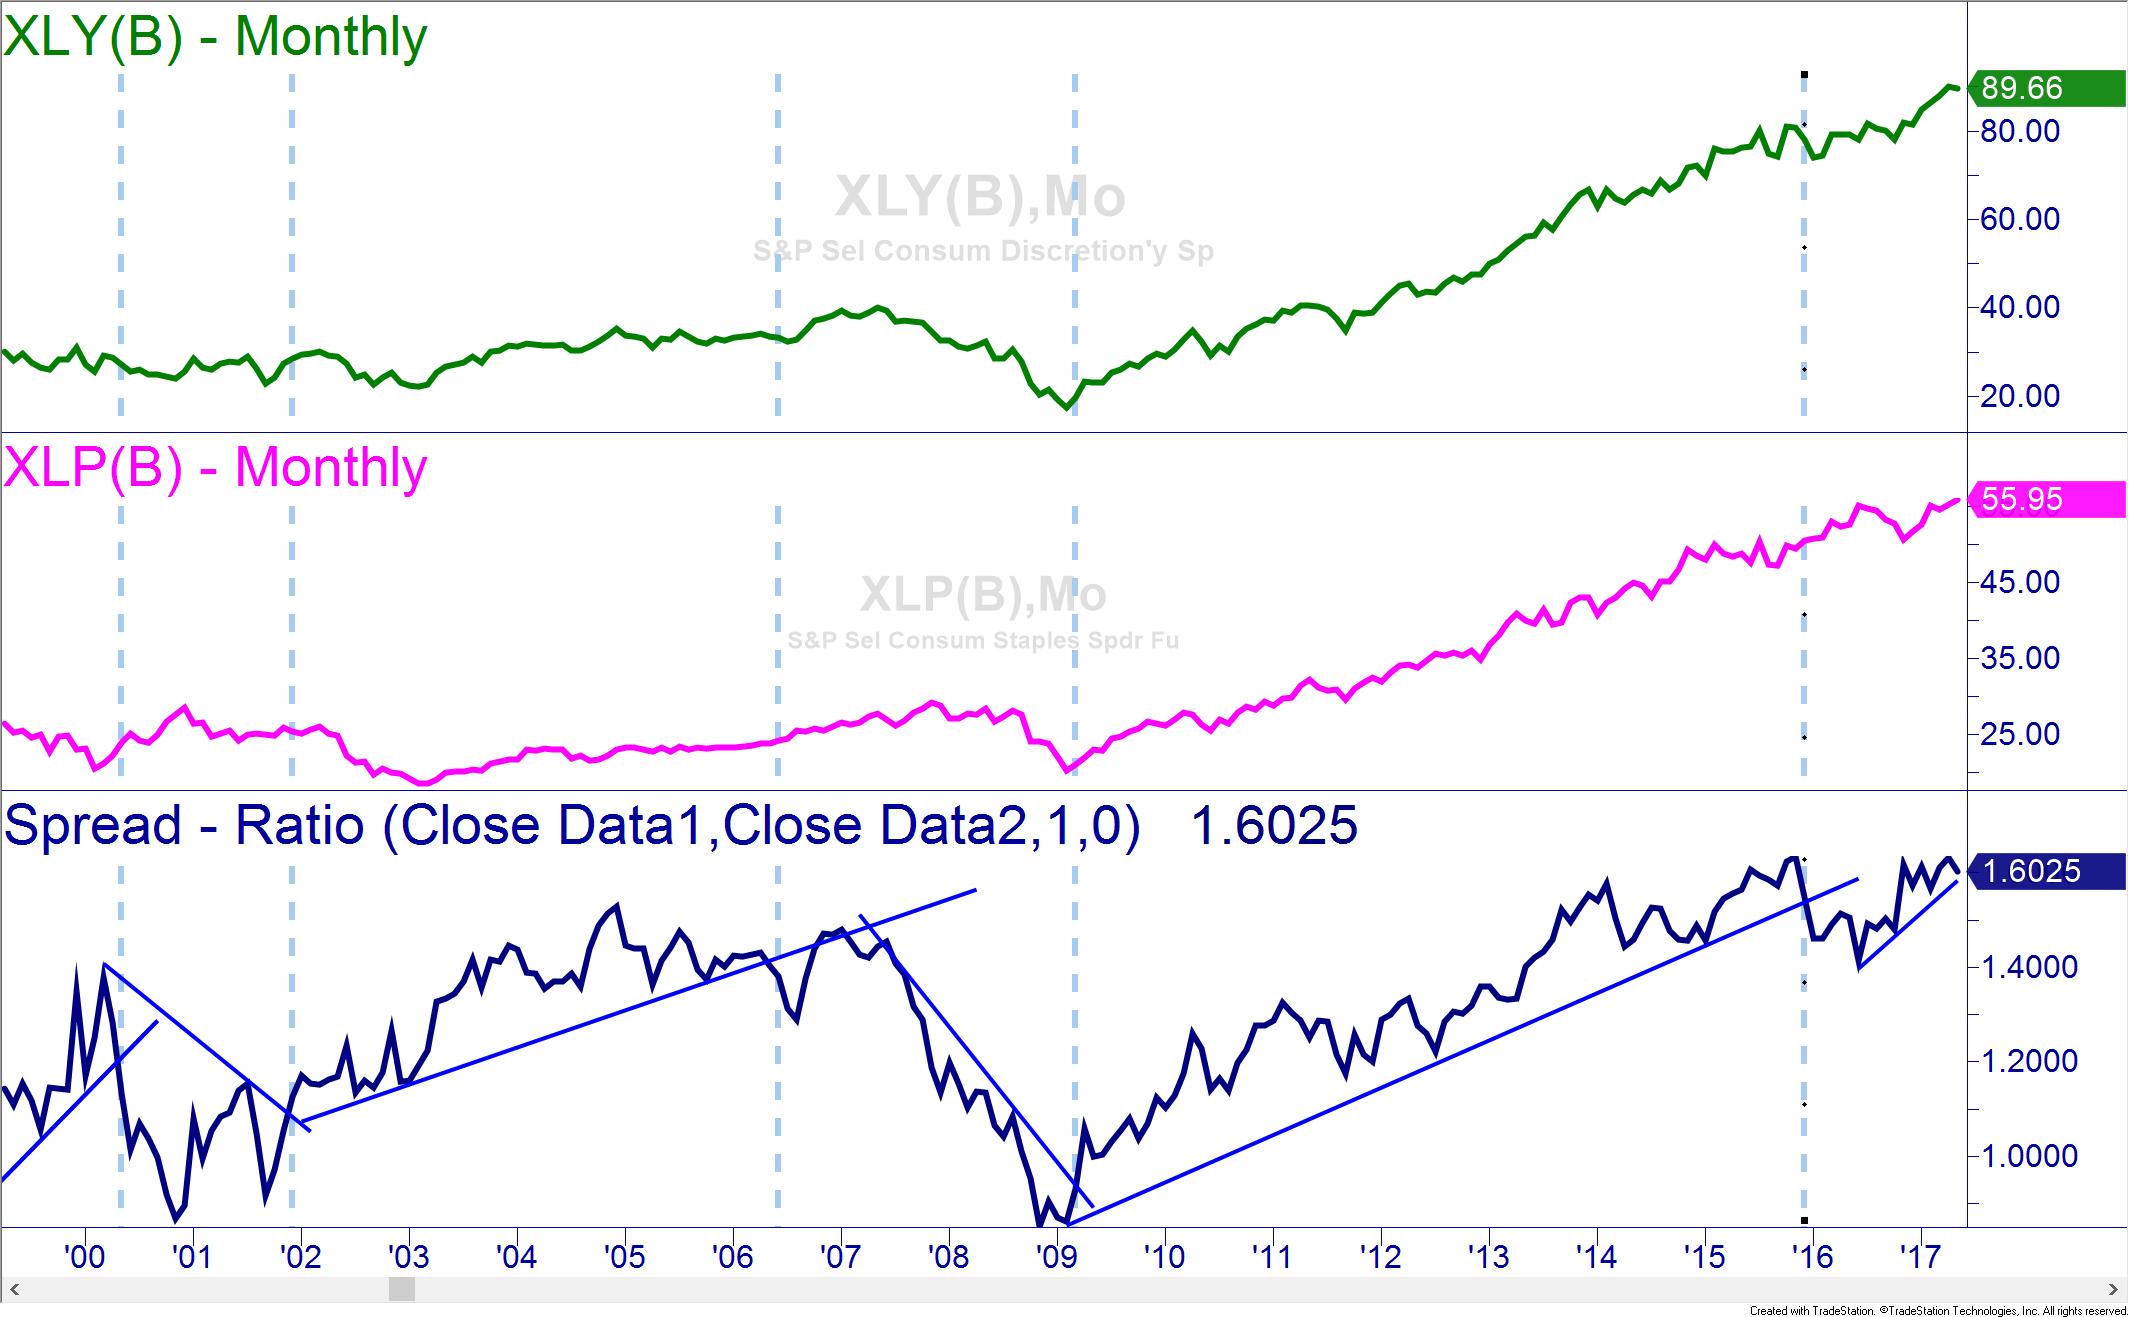
Notice the monthly charts of the XLY and XLP with the spread ratio. The breaks in trend correctly identified the shifts from bullish to bearish markets. Although this technique will not give you exact tops and bottoms, it will alert you to major changes in the markets.
The larger timeframes on charts show us the major trends, and we can adjust our biases accordingly. However, as traders we often want to look at shorter timeframes to see smaller tradable trends. This ratio analysis will also help with that. Simply adjust the chart’s timeframe to your needs but keep in mind that the larger timeframe trends always dominate over the shorter.
By looking at the rotation between staples and discretionary using the spread ratio, traders can gain additional insight as to the future direction of the markets. Until next time, trade safe and trade well!
Neither Freedom Management Partners nor any of its personnel are registered broker-dealers or investment advisers. I will mention that I consider certain securities or positions to be good candidates for the types of strategies we are discussing or illustrating. Because I consider the securities or positions appropriate to the discussion or for illustration purposes does not mean that I am telling you to trade the strategies or securities. Keep in mind that we are not providing you with recommendations or personalized advice about your trading activities. The information we are providing is not tailored to any individual. Any mention of a particular security is not a recommendation to buy, sell, or hold that or any other security or a suggestion that it is suitable for any specific person. Keep in mind that all trading involves a risk of loss, and this will always be the situation, regardless of whether we are discussing strategies that are intended to limit risk. Also, Freedom Management Partners’ personnel are not subject to trading restrictions. I and others at Freedom Management Partners could have a position in a security or initiate a position in a security at any time.
Editors’ Picks

EUR/USD extends its optimism past 1.1900
EUR/USD retains a firm underlying bid, surpassing the 1.1900 mark as the NA session draws to a close on Monday. The pair’s persistent uptrend comes as the US Dollar remains on the defensive, with traders staying cautious ahead of upcoming US NFP prints and CPI data.

GBP/USD hits three-day peaks, targets 1.3700
GBP/USD is clocking decent gains at the start of the week, advancing to three-day highs near 1.3670 and building on Friday’s solid performance. The better tone in the British Pound comes on the back of the intense sekk-off in the Greenback and despite re-emerging signs of a fresh government crisis in the UK.

USD/JPY bounces off lows, back above 156.00
USD/JPY is starting the week markedly on the defensive, sliding back toward the 155.50 area where it has met some decent contention for now. The move lower in spot follows FX intervention chatter after PM S. Takaichi scored a landslide win in Sunday’s election..
Editors’ Picks

AUD/USD gets ready to punch through 0.7100
The intense sell-off in the Greenback underpins the solid performance of the Aussie Dollar on Monday, motivating AUD/USD to add to recent gains while challenging the key 0.7100 barrier, or fresh YTD highs, at the same time.
EUR/USD extends its optimism past 1.1900
EUR/USD retains a firm underlying bid, surpassing the 1.1900 mark as the NA session draws to a close on Monday. The pair’s persistent uptrend comes as the US Dollar remains on the defensive, with traders staying cautious ahead of upcoming US NFP prints and CPI data.

Gold picks up pace, retargets $5,100
Gold gathers fresh steam, challenging daily highs en route to the $5,100 mark per troy ounce in the latter part of Monday’s session. The precious metal finds support from fresh signs of continued buying by the PBoC, while expectations that the Fed could lean more dovish also collaborate with the uptick.

XRP struggles around $1.40 despite institutional inflows
Ripple (XRP) is extending its intraday decline to around $1.40 at the time of writing on Monday amid growing pressure from the retail market and risk-off sentiment that continues to keep investors on the sidelines.

Japanese PM Takaichi nabs unprecedented victory – US data eyed this week
I do not think I would be exaggerating to say that Japanese Prime Minister Sanae Takaichi’s snap general election gamble paid off over the weekend – and then some. This secured the Liberal Democratic Party (LDP) an unprecedented mandate just three months into her tenure.
RECOMMENDED LESSONS
Making money in forex is easy if you know how the bankers trade!
I’m often mystified in my educational forex articles why so many traders struggle to make consistent money out of forex trading. The answer has more to do with what they don’t know than what they do know. After working in investment banks for 20 years many of which were as a Chief trader its second knowledge how to extract cash out of the market.
5 Forex News Events You Need To Know
In the fast moving world of currency markets where huge moves can seemingly come from nowhere, it is extremely important for new traders to learn about the various economic indicators and forex news events and releases that shape the markets. Indeed, quickly getting a handle on which data to look out for, what it means, and how to trade it can see new traders quickly become far more profitable and sets up the road to long term success.
Top 10 Chart Patterns Every Trader Should Know
Chart patterns are one of the most effective trading tools for a trader. They are pure price-action, and form on the basis of underlying buying and selling pressure. Chart patterns have a proven track-record, and traders use them to identify continuation or reversal signals, to open positions and identify price targets.
7 Ways to Avoid Forex Scams
The forex industry is recently seeing more and more scams. Here are 7 ways to avoid losing your money in such scams: Forex scams are becoming frequent. Michael Greenberg reports on luxurious expenses, including a submarine bought from the money taken from forex traders. Here’s another report of a forex fraud. So, how can we avoid falling in such forex scams?
What Are the 10 Fatal Mistakes Traders Make
Trading is exciting. Trading is hard. Trading is extremely hard. Some say that it takes more than 10,000 hours to master. Others believe that trading is the way to quick riches. They might be both wrong. What is important to know that no matter how experienced you are, mistakes will be part of the trading process.
The challenge: Timing the market and trader psychology
Successful trading often comes down to timing – entering and exiting trades at the right moments. Yet timing the market is notoriously difficult, largely because human psychology can derail even the best plans. Two powerful emotions in particular – fear and greed – tend to drive trading decisions off course.