![]() Gabe Velázquez
Gabe Velázquez
Online Trading Academy
Two weeks after the beginning of every quarter (January, March, June, September) starts a period where public companies (those traded on the major exchanges) must report their earnings results to the public at large.
During this period, an army of Wall Street analysts spend most of their time trying to figure out what earnings the companies will report, or if they are not profitable, what type of revenues they’ve generated. Once they’ve concluded their analysis, they will write a report and issue it to their clients with a recommendation to either buy, sell, or hold a stock.
Since there are many analysts dissecting the same stock, a general consensus forms as to what the most likely earnings scenario will be for each company. Then, on the day the company releases their earnings report, traders will react to the actual numbers. If a stock misses the estimate, the knee-jerk reaction is to sell the shares en masse. If the earnings exceed expectations then the opposite occurs. This ritual happens every earnings season on Wall Street.
If you are a futures trader involved in trading one of the broad indexes such as the S&P 500, Nasdaq 100, Dow 30, or Russell 2000, it is vitally important that you understand the influence of some of these big bellwether stocks on the movement of the underlying index. This is especially true during earnings seasons as the reaction immediately following the release of an earnings report will cause a spike in volatility.
This spike could be perceived as added risk or offer great opportunity, depending on your level of skill and discipline.
In the last couple of weeks, many of these high profile stocks have reported earnings, and indeed have added additional volatility to the underlying indexes.
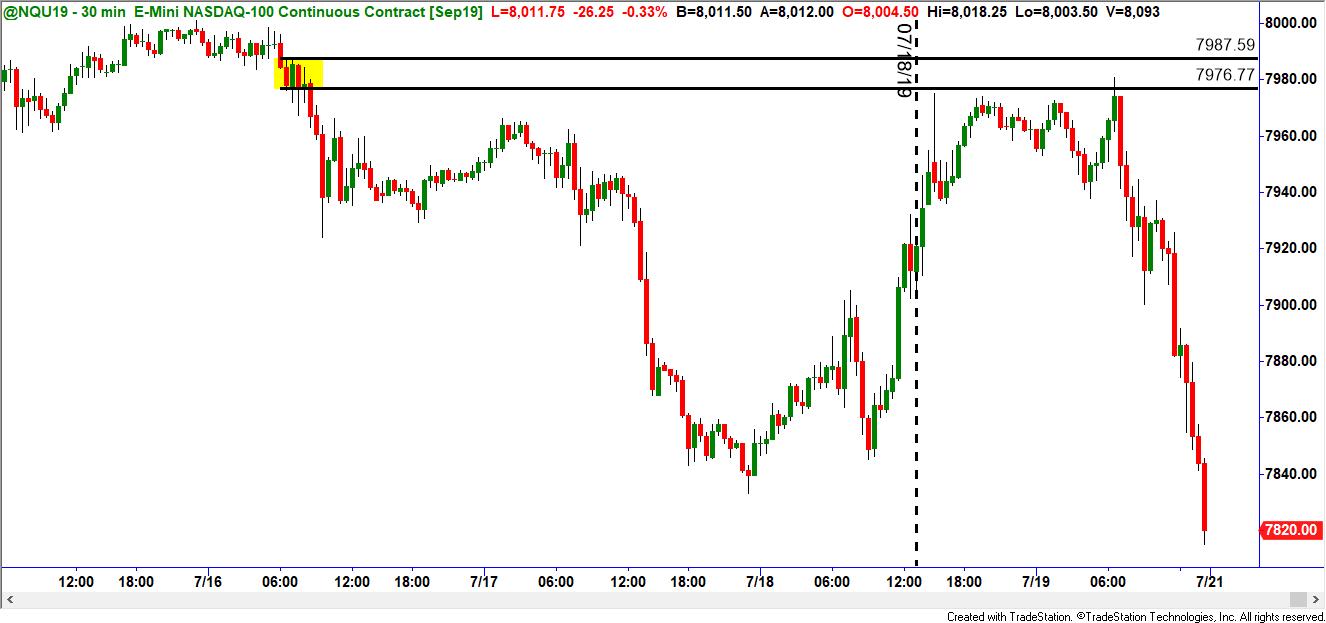
One such example was in the Nasdaq 100 E-mini futures contract. On Thursday, July 18th, soon after the stock market closed in New York (4:00 pm EST) Microsoft (a big bellwether stock) reported strong earnings (above the consensus). As a result, the stock rallied sharply in after-hours trading causing the Nasdaq E-mini futures contract to follow suit. As seen in the chart below.

For many traders this seems like a like a very bullish development, however, for those traders that possess an edge, this actually presented a low-risk opportunity to short the Nasdaq E-mini futures contract.
As we can see from the chart below, the Microsoft rally actually pushed the NQ futures into a high quality supply zone, an area where there were unfilled sell orders, which is a high probability shorting opportunity.

What ensued was a big drop (as seen in the chart below) in the Nasdaq E-mini futures. In trading, there are never any guarantees so this could have also stopped out, but because it had all the attributes we look for in a trade (low risk, high probability, and high profit potential) this one happened to work very well.
The takeaway here is that this trade opportunity was only made possible by the initial reaction to the Microsoft earnings report. Microsoft, because of its market cap, is very influential in the price movement of the Nasdaq 100 and thus should be monitored after its earnings report is release.
Stocks like Apple, Facebook, Amazon and Alphabet (Google) are also big influences in the Nasdaq and should also be closely watched for their earnings report releases. If you aren’t comfortable trading during high volatility, being aware of when these companies release their earnings reports will allow you to exit the market. Otherwise, these releases give traders a chance to look for trading opportunities. I hope this helps.
Read the original article here - Earnings Reports and Their Influence on Index Stock Futures
This content is intended to provide educational information only. This information should not be construed as individual or customized legal, tax, financial or investment services. As each individual's situation is unique, a qualified professional should be consulted before making legal, tax, financial and investment decisions. The educational information provided in this article does not comprise any course or a part of any course that may be used as an educational credit for any certification purpose and will not prepare any User to be accredited for any licenses in any industry and will not prepare any User to get a job. Reproduced by permission from OTAcademy.com click here for Terms of Use: https://www.otacademy.com/about/terms
Editors’ Picks

EUR/USD treads water above 1.1850 amid thin trading
EUR/USD stays defensive but holds 1.1850 amid quiet markets in the European hours on Monday. The US Dollar is struggling for direction due to thin liquidity conditions as US markets are closed in observance of Presidents' Day.

GBP/USD flat lines as traders await key UK and US macro data
GBP/USD kicks off a new week on a subdued note and oscillates in a narrow range near 1.365 in Monday's European trading. The mixed fundamental backdrop warrants some caution for aggressive traders as the market focus now shifts to this week's important releases from the UK and the US.

USD/JPY extends Japan's weak Q4 GDP-inspired recovery to 153.25 area
The USD/JPY pair once again shows some resilience below the 200-day Exponential Moving Average on Monday and rebounds from the vicinity of the 38.2% Fibonacci retracement level of the April 2025 to January 2026 strong move up. The disappointing release of Japan's Q4 GDP print, along with a positive risk tone, undermines the safe-haven Japanese Yen.
Editors’ Picks
EUR/USD treads water above 1.1850 amid thin trading
EUR/USD stays defensive but holds 1.1850 amid quiet markets in the European hours on Monday. The US Dollar is struggling for direction due to thin liquidity conditions as US markets are closed in observance of Presidents' Day.
GBP/USD flat lines as traders await key UK and US macro data
GBP/USD kicks off a new week on a subdued note and oscillates in a narrow range near 1.365 in Monday's European trading. The mixed fundamental backdrop warrants some caution for aggressive traders as the market focus now shifts to this week's important releases from the UK and the US.

Gold slides below $5,000 amid USD uptick and positive risk tone; downside seems limited
Gold attracts fresh sellers at the start of a new week and reverses a part of Friday's strong move up of over $150 from sub-$4,900 levels. The commodity slides back below the $5,000 psychological mark during the Asian session, though the downside potential seems limited amid a combination of supporting factors.

Bitcoin, Ethereum and Ripple consolidate within key ranges as selling pressure eases
Bitcoin and Ethereum prices have been trading sideways within key ranges following the massive correction. Meanwhile, XRP recovers slightly, breaking above the key resistance zone. The top three cryptocurrencies hint at a potential short-term recovery, with momentum indicators showing fading bearish signs.
Global inflation watch: Signs of cooling services inflation
Realized inflation landed close to expectations in January, as negative base effects weighed on the annual rates. Remaining sticky inflation is largely explained by services, while tariff-driven goods inflation remains limited even in the US.
RECOMMENDED LESSONS
Making money in forex is easy if you know how the bankers trade!
I’m often mystified in my educational forex articles why so many traders struggle to make consistent money out of forex trading. The answer has more to do with what they don’t know than what they do know. After working in investment banks for 20 years many of which were as a Chief trader its second knowledge how to extract cash out of the market.
5 Forex News Events You Need To Know
In the fast moving world of currency markets where huge moves can seemingly come from nowhere, it is extremely important for new traders to learn about the various economic indicators and forex news events and releases that shape the markets. Indeed, quickly getting a handle on which data to look out for, what it means, and how to trade it can see new traders quickly become far more profitable and sets up the road to long term success.
Top 10 Chart Patterns Every Trader Should Know
Chart patterns are one of the most effective trading tools for a trader. They are pure price-action, and form on the basis of underlying buying and selling pressure. Chart patterns have a proven track-record, and traders use them to identify continuation or reversal signals, to open positions and identify price targets.
7 Ways to Avoid Forex Scams
The forex industry is recently seeing more and more scams. Here are 7 ways to avoid losing your money in such scams: Forex scams are becoming frequent. Michael Greenberg reports on luxurious expenses, including a submarine bought from the money taken from forex traders. Here’s another report of a forex fraud. So, how can we avoid falling in such forex scams?
What Are the 10 Fatal Mistakes Traders Make
Trading is exciting. Trading is hard. Trading is extremely hard. Some say that it takes more than 10,000 hours to master. Others believe that trading is the way to quick riches. They might be both wrong. What is important to know that no matter how experienced you are, mistakes will be part of the trading process.
The challenge: Timing the market and trader psychology
Successful trading often comes down to timing – entering and exiting trades at the right moments. Yet timing the market is notoriously difficult, largely because human psychology can derail even the best plans. Two powerful emotions in particular – fear and greed – tend to drive trading decisions off course.