Don't be fooled by low interest rates

It is a prevalent notion that low interest rates imply money is loose and high interest rates imply money is tight. In theory, it makes sense, because it allows investors to borrow at cheaper rates, which frees up more cash that would otherwise be spent servicing debt payments on loans with higher rates. The less you have to pay back, the more you are inclined to borrow. The more you borrow, the more spending power you have, which is likely to find its way into the real economy. So, on paper, low rates certainly feel like stimulus. But, let’s take a closer look.
If cutting interest rates provides stimulus to the economy, how long would we have to wait for the economy to actually be stimulated? One year? Two years? Three years? How about thirteen years? We are on year number thirteen since the Global Financial Crisis, and still, we live in a deflationary environment. How could that be? There have been multiple rounds of Quantitative Easing (QE), trillions of newly “printed” dollars, all the while, we are stuck in a low interest rate environment. Certainly after thirteen years of on-and-off stimulus, accompanied by low rates, inflation and economic growth would have prevailed by now, right? Perhaps, low rates mean money is tight, not loose, like mainstream economics suggest.
During the Great Depression, which was a significant period of deflation, rates fell to near zero and stayed there until after WWII. During the inflationary 1970’s, when money was extremely loose, rates ran up into the high double digits, alongside inflation. This period was followed by the disinflation of the 1980’s, when rates fell roughly 70% from their peak in 1981. Now, here we are post-2008, in another deflationary environment, with low rates. If these periods of time aren’t proof that low rates mean money is tight and high rates mean money is loose, then I don’t know what is. Yet, it is still the mainstream consensus that low rates equals stimulus.
When money is loose, borrowing and spending picks up, and we see growth in the economy. As this happens, risk premiums rise. If I’m an investor and risk premiums are rising, then rates on safe investments need to rise too. If I am going to loan money by purchasing a bond, I demand a higher rate of return due to the opportunity cost of not investing in a riskier asset, otherwise I won’t be willing to lend. The opposite holds true during periods of flat or sluggish growth (like the one we’re currently in). Risk premiums are low, so there is no opportunity cost. I am willing to accept a lower rate when I lend money in this environment.
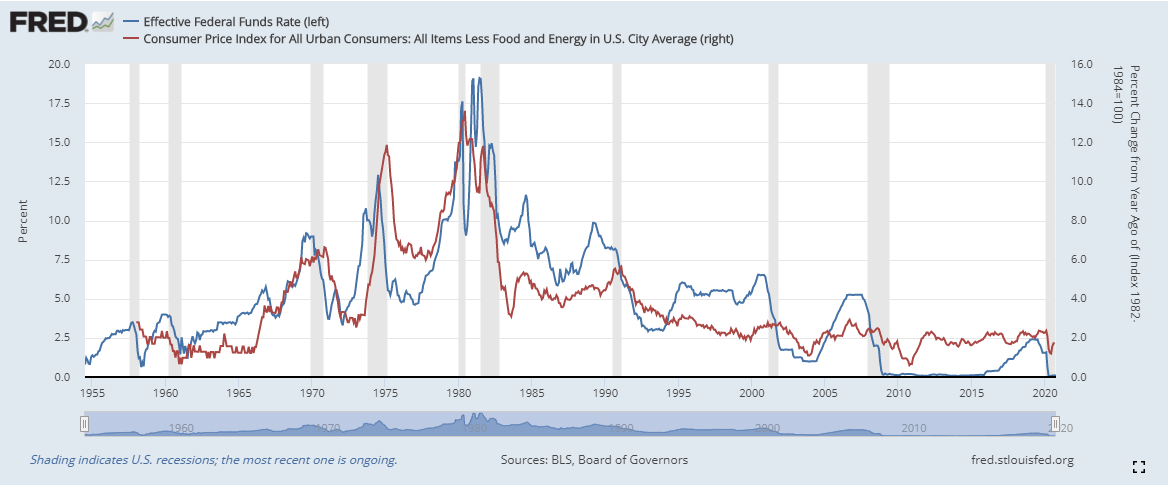
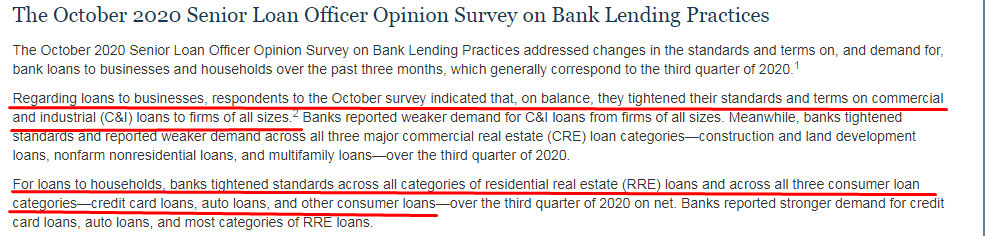
If you look below at EFF (effective federal funds rate) and CPI (consumer price index), you can clearly see the positive correlation that exists between interest rates and inflation. As rates rise, inflation rises and as rates fall, inflation falls. The late 70s, early 80s was the end of the inflationary period and rates and inflation hit nearly 20%. How could it be that inflation was so high during a time of high interest rates? Now compare post-2008 to today, interest rates are near zero and inflation is very low by historical standards. In the second picture below I have the Senior Loan Officer Opinion Survey on Bank Lending Practices which was released on Monday, by the Fed. Here we are in a low interest rate environment and banks are tightening up their lending standards, further indicating money is tight. In our current environment, banks are willing to accept a low rate on their lending, but are only willing to let the most creditworthy borrowers, borrow. So, despite interest rates being low, money is hard to get your hands on, which is why banks hoard safe, liquid assets like US Treasuries during these times. Mainstream economics tells us that the phenomena I am suggesting isn’t possible because high rates mean money is tight and low rates mean money is loose. But all of the evidence points to the contrary.
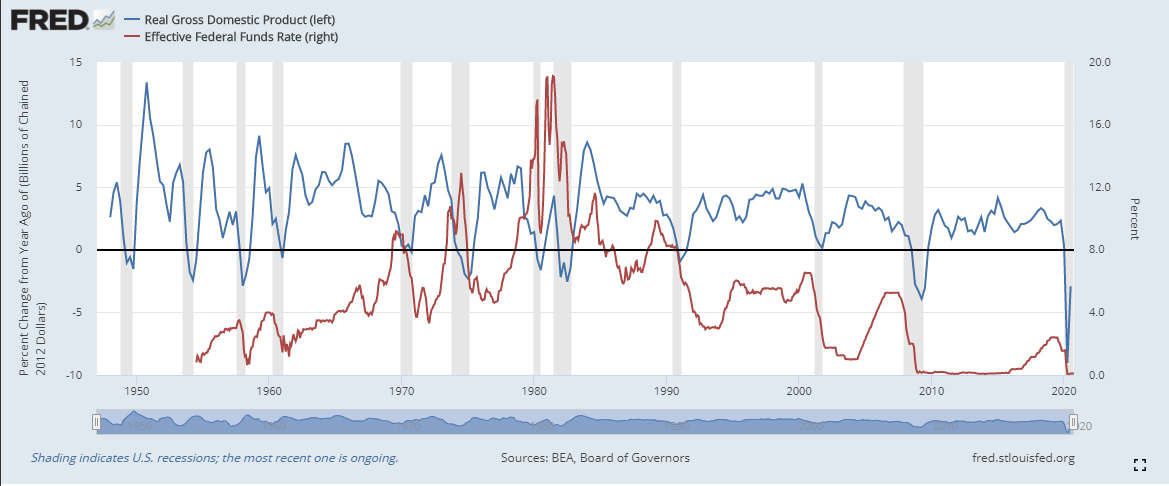
Now, let’s take a look (below) at the relationship between rates and growth. I used the percent change from one year ago on the Real GDP so you can see on a more granular level the relationship between GDP and interest rates. Again, similar to inflation, there is a very strong positive correlation between growth and rising rates. When money is tight (indicated by low rates), GDP will often decline or flatten out.
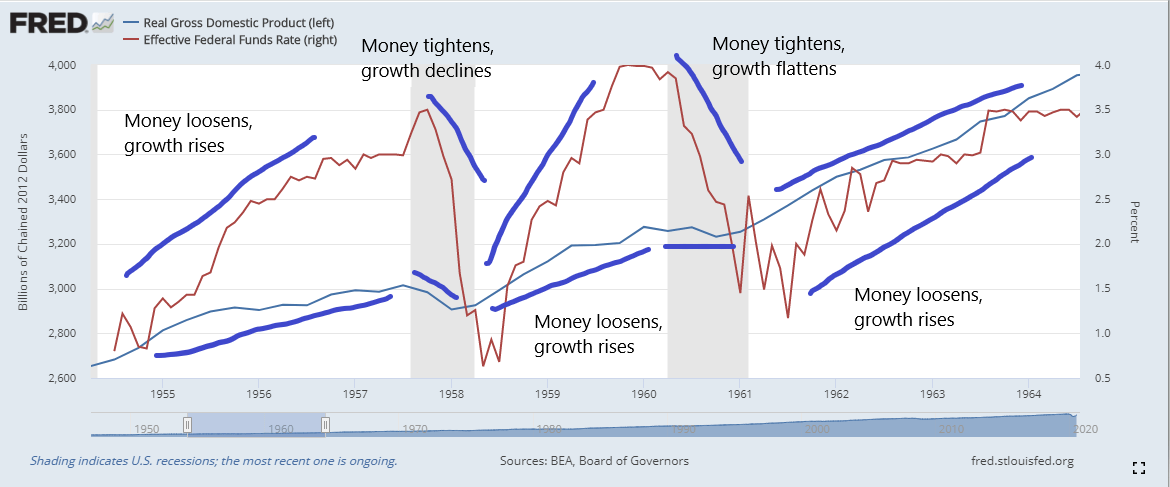
See below, I have four charts going back to the 1950s that show when money is loose (rising rates), we see positive GDP growth. When money is tight (falling rates) we see negative or flat GDP growth.
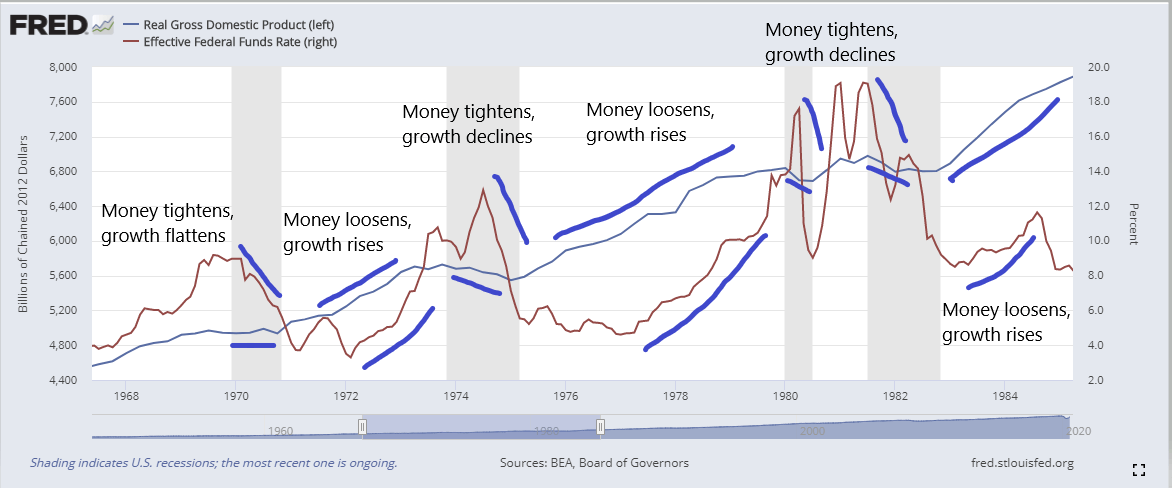
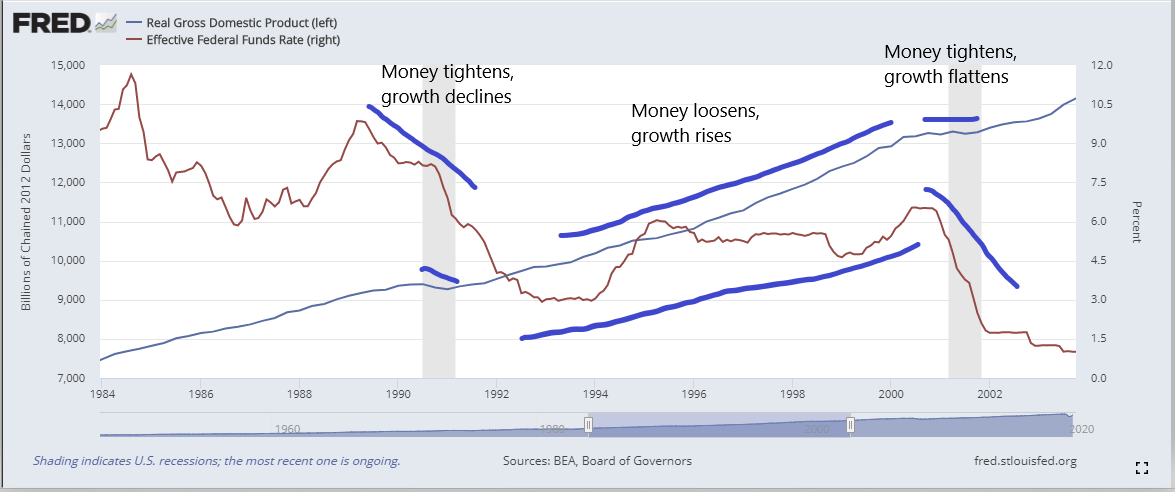
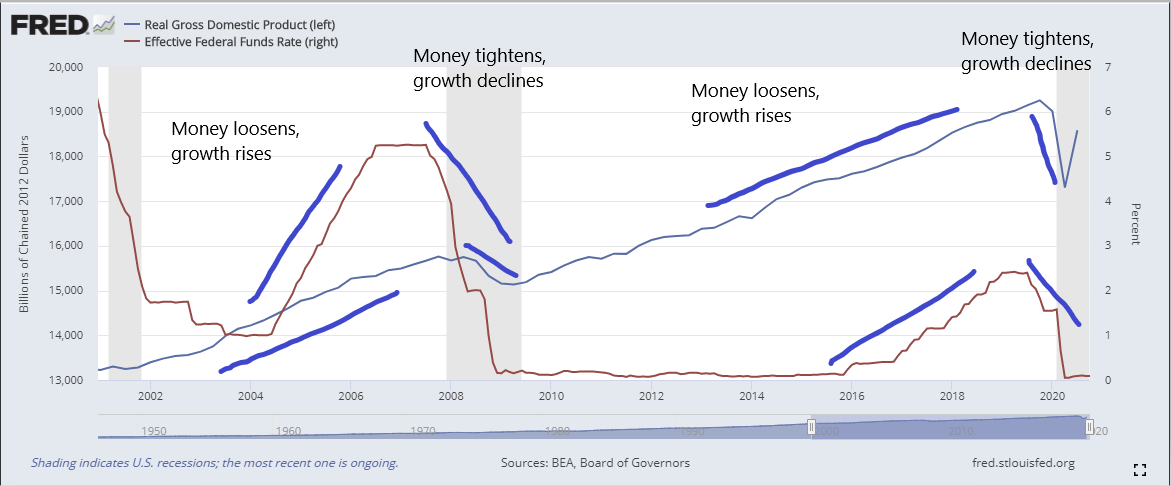
When money is tight, we do not see positive growth. We see growth when money is loose, which just so happens to be in a high or rising interest rate environment. When money is loose, investors and banks don’t want or need to hold on to safe, liquid assets because capital is easy to get their hands on. In such cases, investors and banks put their money into riskier assets and lending in search of higher rates of return. So, don’t be fooled when central bankers talk about rates staying low for the foreseeable future, because what that means is money is tight, there is no inflation or growth on the horizon, and whether they realize that or not, I’m not sure. Low rates may “stimulate” the economy for a very short time period, but once the illusion of ‘low rates equals stimulus’ wears off, everything rolls back over. Milton Friedman said it best, so, I will leave you with a quote of his: “after the U.S. experience during the Great Depression, and after inflation and rising interest rates in the 1970s and disinflation and falling interest rates in the 1980s, I thought the fallacy of identifying tight money with high interest rates and easy money with low interest rates was dead. Apparently, old fallacies never die.”
Author

Ryan Miller
Ryan Miller Trading Economics
Ryan Miller received a Bachelors Degree in History from William Paterson University. Through his studies of U.S. history, he developed an interest in the implications the financial markets have on the economy.
















