![]() Russ Allen
Russ Allen
Online Trading Academy
What Is a Target Date Bond ETF?
Unlike a conventional bond fund, where there is frequent turnover of the bonds in the fund to keep it adjusted to its target average maturity, a target-date bond fund holds a portfolio of bonds that all mature in the same year. Instead of turning over the bonds frequently, the fund holds the bonds until they mature, then collects the principal from the bonds and pays out the full amount collected as a final distribution. Meanwhile, in the years before maturity of the bonds, the bond fund pays out the interest it collects on the bonds as monthly distributions to the fund shareholders.
These target-date funds are exchange-traded funds that trade on the stock exchange like any other ETF. They can be purchased and sold at any time in any regular stock brokerage account – there is no need to have an account with the bond fund itself.
Benefits of Targeted Date Bond ETFs
These funds are designed to give the advantages of holding bonds to maturity – predictable future results, lack of price risk, assured income stream – together with the advantages of exchange-traded funds – convenience, instant liquidity, and a low per-share price of around $20-25 that allows any investor to create a diversified bond portfolio no matter the size of their personal portfolio.
Common Questions about Target Date Bond ETFs
In our Strategic Investor program, we track several portfolios which contain shares of these target-date bond funds as part of their steady-income allocation.
There are some frequently asked questions about these funds, encapsulated pretty well by a letter we received recently which asks:
Q: What are the calculations for the interest and final balance of a bond fund ETF?
A: Example:
$20,000 in Bond Fund ETFs
Yield to maturity = 2.09%
Distribution Yield= 2.61%
Maturity two years
Current fund price per share $21.26
Shares held = 20,000 / $21.26 = 940 shares with $15.60 cash left over
Q: You mentioned in the Strategic Investor class that the amount received as the final distribution when the fund matures may be higher or lower than the amount paid for the shares.
I understand that the fund publishes a Yield to Maturity figure for each fund, and also an annual Distribution Rate. From these it should be possible to calculate the final payout per share.
How can I calculate the amount of the final payout, so that I know how much to expect at the end?
How can I calculate the interest and final balance?
A: Below is a screenshot of a worksheet that calculates the estimated payout at liquidation for this example, and also several other selected target-date bond ETFs.
These are estimates only, and things could change. If the fund grows and needs to purchase more bonds to meet investor demand, then the bonds purchased later might have different yields and premium/discount characteristics from the existing bonds in the fund. But assuming that the composition of the fund doesn’t change too much, we can make a pretty good estimate of the results using the numbers published by the vendor.
The approach is to calculate the future value (FV) of the cash flows implied by the published numbers.
There is an Excel function called FV (Future Value of a bond) that can do the job.
To use the formula, for any fund you can type: = FV(Rate, nPer, Pmt, PV)
Where:
Rate equals the vendor’s published Yield to Maturity, times .01 to change it to a decimal value as required by the formula. In the writer’s example, this would be 2.07 * .01 or .0207.
nPer (number of periods) is the number of years until the fund’s maturity. Since this analysis is being made in December of 2019 when the December interest payments have already been made, the number of years left is simply the bond fund’s maturity year minus 2019. For the 2020 fund, the number of periods is 1, for 2021 it’s 2 years, etc. If we weren’t in December, we’d have to round the partial years to a decimal indicating the nearest month. For example, if the time to maturity was one year and 4 months, you’d use 1.333 as nPer. For a year and three months it would be 1.25, etc.In the writer’s example, nPer would be 2 (2 years).
Pmt (interest payment amount) equals the Distribution Rate published by the vendor, times .01 times the Current Price of the fund. For the writer’s example, if the current price of the fund was $21.26, and the distribution rate was 2.61%, then the annual interest payment would be 21.26 * .261 = $.55486 per share per year. Note that the fund would pay 1/12 of this amount every month (these funds pay their interest monthly).
PV(Present Value) is the current price of the fund, in this case $21.26.
In the illustration below, the information from the bond fund’s site is shown in columns C through I.
Each row of the table represents a different one of the vendor’s bond funds. Each fund has a portfolio of bonds that all mature near the end of the year shown for the fund in column D (Maturity Date). Row 2 shows the fund for BSCL, covered in this example, which matures in two years.
Column E Shows the Yield to Maturity of the fund. This is the average total return per year, considering both the interest paid and the eventual gain or loss on the price of the fund shares, when the shares are redeemed at maturity.
Note that this yield to maturity is before the fund deducts their fees, which are clearly stated for each fund. For the funds shown below, the annual fee is 1/10 of 1%. So a published Yield to Maturity of 2.07% would net out to 1.97%. In my opinion 1/10 of a percent is a reasonable fee for the funds’ services of packaging up these bond portfolios in a very user-friendly form.
The reason for the gain or loss at maturity is that the eventual share price at redemption is not the same as the current price. The bonds which the fund owns were bought at various times at varying prices above or below the par value of the bonds. When the bond issuers pay off the bonds, they will pay the fund the par value of the bonds. This will be the amount that the fund then pays to the bond fund holders. This will not be the same amount that the fund paid for the bonds. However, that par value amount is known by the fund, and they include this effect in the Yield to Maturity calculation. Unfortunately, the fund does not publish the estimated payout amount (probably because it is subject to some change in the composition of the fund changes if it grows), so that’s what we need to calculate here.
In the screenshot below, the formula bar at the top (in the red box) shows the formula for the estimated payout for BSCL (second row in the table). The calculation for each of the other funds is the same, with just the substitution of the correct number of years to maturity in the nPer term for each one. The purple boxes show which elements are included in the formula.
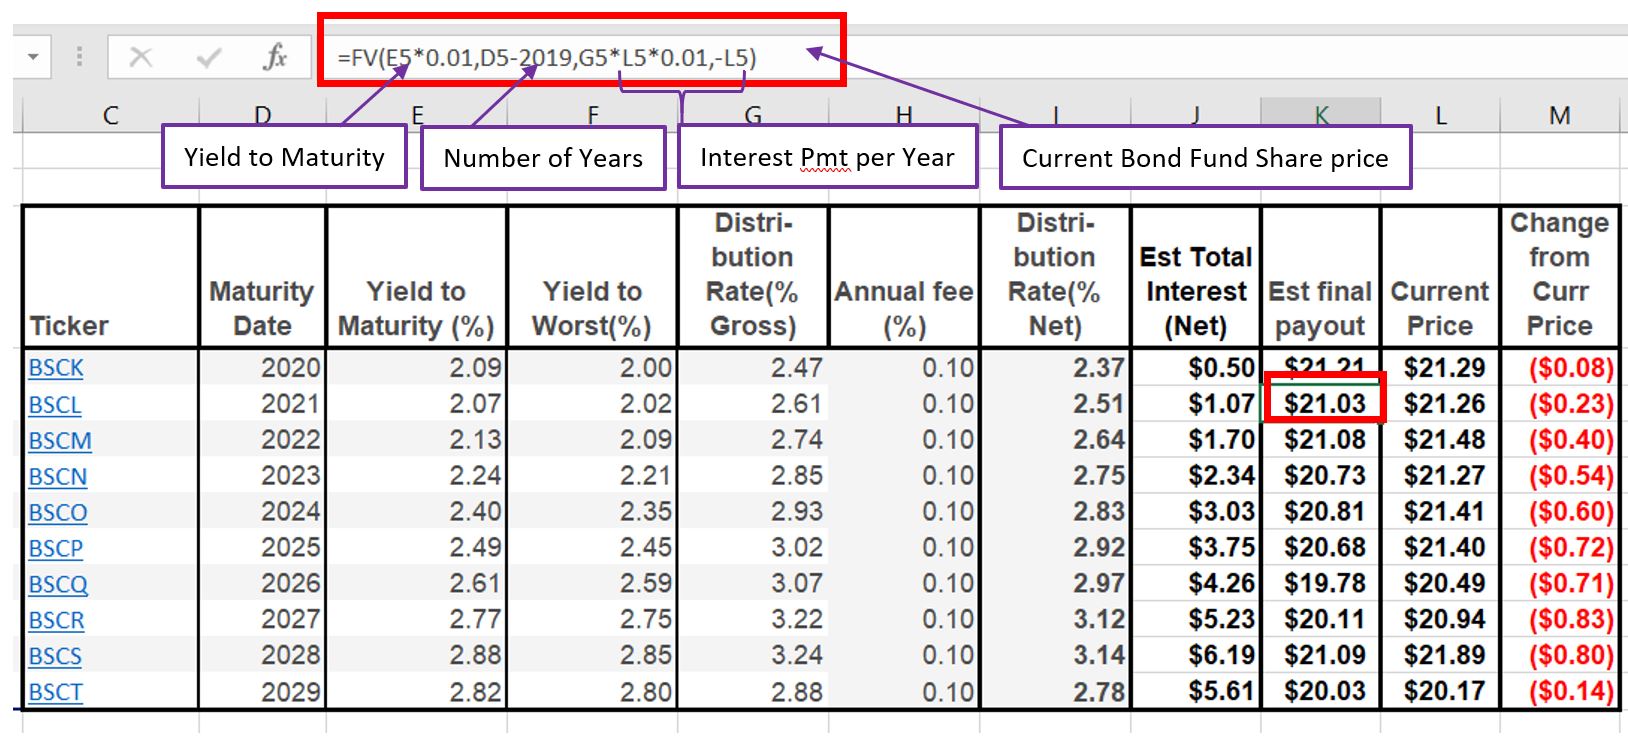
Column K gives the estimated final payout, calculated using the FV formula as above.
Column M shows the estimated difference in the per-share amount of the final payout vs. today’s per-share price.
I’ve also calculated the total interest estimated to be received over the lifetime of the fund. This is shown in column J, and is net of the fund’s fees, or expense ratio of 1/10 of one percent. The total interest is calculated simply as Distribution Rate * Current Share Price * Years until maturity.
So finally, for the writer’s example, the results are:
$20,000 in Bond Fund ETF
Yield to maturity = 2.07%
Distribution Yield= 2.61%
Maturity two years
Current fund price per share $21.26
Shares held = 20,000 / $21.26 = 940 shares with $15.60 cash left over
Final Payout = $21.03 * 940 shares = $19,766 + $15.60 cash = $19,791.60
Total Interest received = $1.07 * 940 shares = $1,005.90
Total Proceeds (principal plus interest) = $20,797.50
Less initial investment: $20,000.00
Net dollar return on investment (2 years) $ 797.50
Net percentage return on investment (2 years) 3.99%
Average percentage return on investment (2 years) 1.99%
This average percentage return of 1.99% agrees well with the fund’s figure of a 2.07% Yield to maturity, after deducting .10% for fees, which would be a net of 1.97%. Our estimate is a tiny bit different because just dividing 3.99% by two to get an average return ignores one year of compounding, but it is very close.
I hope you find this information useful. The target date bond funds are an alternative that you should investigate if you have a portion of your funds for which you want steady predicable income at better rates than you could get on bank interest.
This is just one of many investment types that we cover in our Strategic Investor course. For more information, I encourage you to sign up for our free introductory class.
This content is intended to provide educational information only. This information should not be construed as individual or customized legal, tax, financial or investment services. As each individual's situation is unique, a qualified professional should be consulted before making legal, tax, financial and investment decisions. The educational information provided in this article does not comprise any course or a part of any course that may be used as an educational credit for any certification purpose and will not prepare any User to be accredited for any licenses in any industry and will not prepare any User to get a job. Reproduced by permission from OTAcademy.com click here for Terms of Use: https://www.otacademy.com/about/terms
Editors’ Picks

EUR/USD: US Dollar to remain pressured until uncertainty fog dissipates
Unimpressive European Central Bank left monetary policy unchanged for the fifth consecutive meeting. The United States first-tier employment and inflation data is scheduled for the second week of February. EUR/USD battles to remain afloat above 1.1800, sellers moving to the sidelines.

GBP/USD reclaims 1.3600 and above
GBP/USD reverses two straight days of losses, surpassing the key 1.3600 yardstick on Friday. Cable’s rebound comes as the Greenback slips away from two-week highs in response to some profit-taking mood and speculation of Fed rate cuts. In addition, hawkish comments from the BoE’s Pill are also collaborating with the quid’s improvement.

USD/JPY gathers strength to near 157.50 as Takaichi’s party wins snap elections
The USD/JPY pair attracts some buyers to around 157.45 during the early Asian session on Monday. The Japanese Yen weakens against the US Dollar after Japan’s ruling Liberal Democratic Party won an outright majority in Sunday’s lower house election, opening the door to more fiscal stimulus by Prime Minister Sanae Takaichi.
Editors’ Picks
USD/JPY gathers strength to near 157.50 as Takaichi’s party wins snap elections
The USD/JPY pair attracts some buyers to around 157.45 during the early Asian session on Monday. The Japanese Yen weakens against the US Dollar after Japan’s ruling Liberal Democratic Party won an outright majority in Sunday’s lower house election, opening the door to more fiscal stimulus by Prime Minister Sanae Takaichi.

Gold: Volatility persists in commodity space
After losing more than 8% to end the previous week, Gold remained under heavy selling pressure on Monday and dropped toward $4,400. Although XAU/USD staged a decisive rebound afterward, it failed to stabilize above $5,000. The US economic calendar will feature Nonfarm Payrolls and Consumer Price Index data for January, which could influence the market pricing of the Federal Reserve’s policy outlook and impact Gold’s performance.

AUD/USD eyes 0.7050 hurdle amid supportive fundamental backdrop
AUD/USD builds on Friday's goodish rebound from sub-0.6900 levels and kicks off the new week on a positive note, with bulls awaiting a sustained move and acceptance above mid-0.7000s before placing fresh bets. The widening RBA-Fed divergence, along with the upbeat market mood, acts as a tailwind for the risk-sensitive Aussie amid some follow-through US Dollar selling for the second straight day.

Week ahead: US NFP and CPI data to shake Fed cut bets, Japan election looms
US NFP and CPI data awaited after Warsh’s nomination as Fed chief. Yen traders lock gaze on Sunday’s snap election. UK and Eurozone Q4 GDP data also on the agenda. China CPI and PPI could reveal more weakness in domestic demand.

Three scenarios for Japanese Yen ahead of snap election Premium
The latest polls point to a dominant win for the ruling bloc at the upcoming Japanese snap election. The larger Sanae Takaichi’s mandate, the more investors fear faster implementation of tax cuts and spending plans.
RECOMMENDED LESSONS
Making money in forex is easy if you know how the bankers trade!
I’m often mystified in my educational forex articles why so many traders struggle to make consistent money out of forex trading. The answer has more to do with what they don’t know than what they do know. After working in investment banks for 20 years many of which were as a Chief trader its second knowledge how to extract cash out of the market.
5 Forex News Events You Need To Know
In the fast moving world of currency markets where huge moves can seemingly come from nowhere, it is extremely important for new traders to learn about the various economic indicators and forex news events and releases that shape the markets. Indeed, quickly getting a handle on which data to look out for, what it means, and how to trade it can see new traders quickly become far more profitable and sets up the road to long term success.
Top 10 Chart Patterns Every Trader Should Know
Chart patterns are one of the most effective trading tools for a trader. They are pure price-action, and form on the basis of underlying buying and selling pressure. Chart patterns have a proven track-record, and traders use them to identify continuation or reversal signals, to open positions and identify price targets.
7 Ways to Avoid Forex Scams
The forex industry is recently seeing more and more scams. Here are 7 ways to avoid losing your money in such scams: Forex scams are becoming frequent. Michael Greenberg reports on luxurious expenses, including a submarine bought from the money taken from forex traders. Here’s another report of a forex fraud. So, how can we avoid falling in such forex scams?
What Are the 10 Fatal Mistakes Traders Make
Trading is exciting. Trading is hard. Trading is extremely hard. Some say that it takes more than 10,000 hours to master. Others believe that trading is the way to quick riches. They might be both wrong. What is important to know that no matter how experienced you are, mistakes will be part of the trading process.
The challenge: Timing the market and trader psychology
Successful trading often comes down to timing – entering and exiting trades at the right moments. Yet timing the market is notoriously difficult, largely because human psychology can derail even the best plans. Two powerful emotions in particular – fear and greed – tend to drive trading decisions off course.