Bitcoin Analysis- After a dip to 9,000, Bitcoin is again on the rise

Dear traders,
Our analysis from lat time was quite productive. We managed to get into a long trade, but then our stop-loss was set to a small profit and it was triggered when the bitcoin flash crash happened. We still managed to get out of this unharmed.
We are currently seeing two daily long-legged dojis which are a sign of strong hesitance. As we have expected, the 10,000 level is a barrier that is harder to break than a lot of traders thought before.
We are currently looking at the 4 hour timeframe and are spotting a couple of interesting candlestick formations.
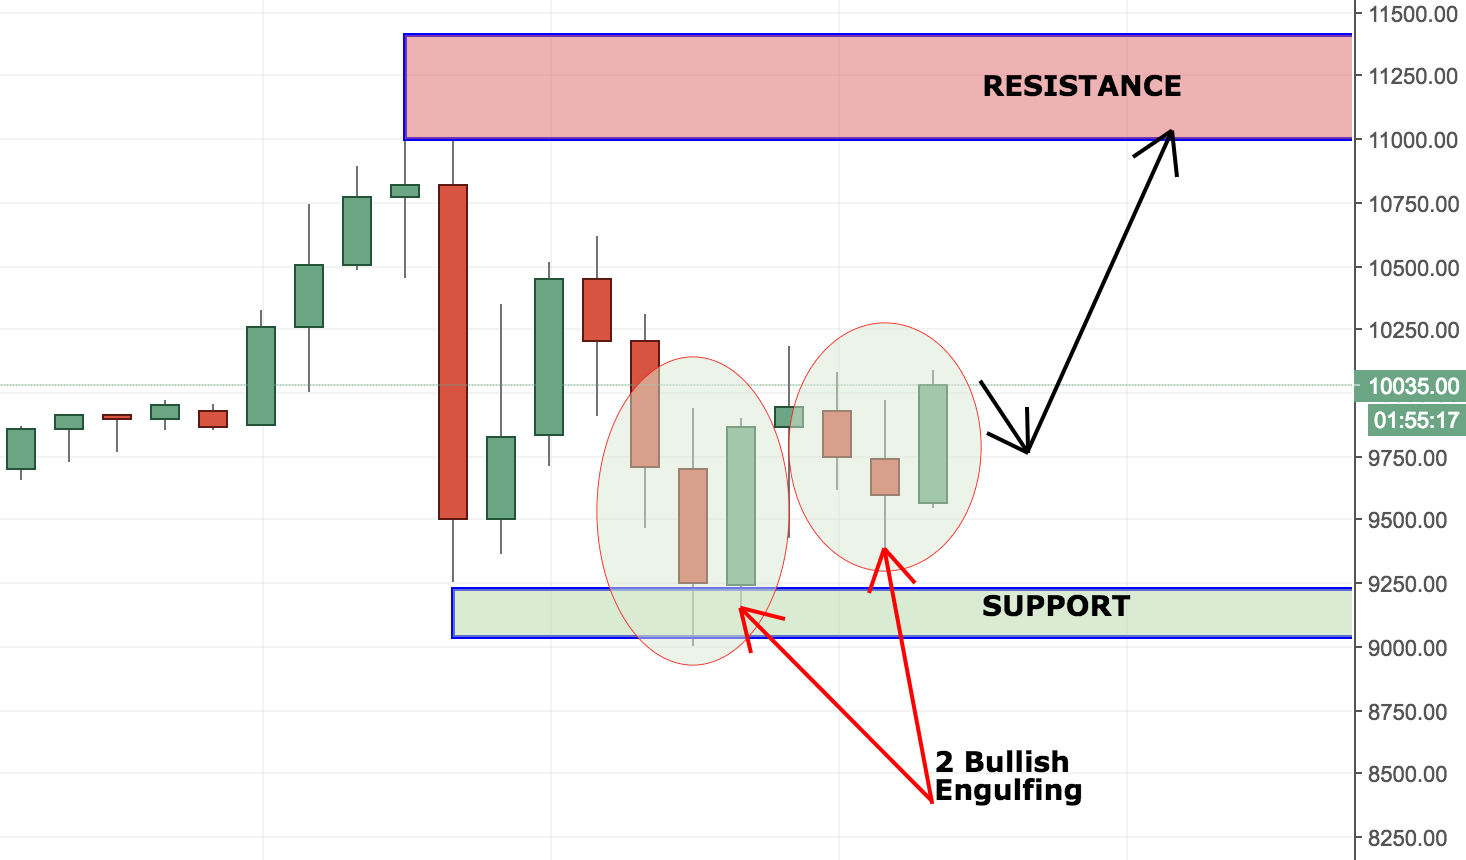
Let’s have a look at the chart above once again. Price went down to the level of 9,000 and then formed a small base.
There were an inside bar initially. It was then followed by two bullish engulfing patterns as shown on the image above.
These are all bullish signals. As long as we don’t see a second rejection of the 11,000 level, we are prone to think that price might continue the rise.
For now, we are looking for a small retracement and then a possible long trade. Our hypothetical target is the level of 11,000. Then, it depends on price action.
Happy Trading,
BBB
Author

Ben Hooda
Best Online Bitcoin Brokers
I have worked as a prop trader in two of the leading prop trading houses in London. Currently an avid crypto trader, blogger and a mentor. Helping others achieve their goals is one of my top priorities!


