![]() Elliott Wave Forecast Team
Elliott Wave Forecast Team
ElliottWave-Forecast.com
What are Penny Stocks?
Penny stocks, occasionally referred to as “micro-cap” or “nano-cap” stocks are low-value stocks representing smaller companies traded on the stock market. Usually, they’re offered by companies that are either still in a developmental stage or companies that just offer one or two different products.
As the name suggests, these stocks are often priced under $ 5 per share — making them much more accessible to new penny stock investors or those with less capital. There is less regulation in the penny stock market. Unlike the big national exchanges where there’s a high amount of regulation, penny stocks aren’t held to the same standards.
Because of this, there can be a lot of fraudulent information out there about these stocks, so it can be hard to discern what’s true and what is not when it comes to these companies and their offerings. Largely due to these factors, penny stocks are extremely volatile. The market can swing up or down very quickly.
Why invest in Penny stocks?
There are benefits to trading penny stocks, which are:
- Since penny stocks are priced on the low end, they’re accessible to traders with small accounts.
- Investors can start with very low capital.
- One of the biggest advantages of trading penny stocks is that it’s extremely easy to get started.
- Diligence can be rewarded. If investors can do their own research on the companies to evaluate whether or not they’re good investments, then you might be rewarded for your studies.
- Potential profit on the way up or down. With penny stocks, investors can potentially profit as stocks go up or down in value. While many of the companies offering penny stocks will fail, this can actually provide an opportunity for traders to sell short.
Penny stocks risks
- A primary risk of penny stocks is the potential for a lack of reliable, readily available information.
- Also, many penny stocks are issued by newly formed companies with little or no track record. Without enough information, you may not be able to fully evaluate the company.
- Less stringent disclosure requirements can make penny stocks particularly susceptible to illegal “pump-and-dump” schemes. Unscrupulous investors buy the stock, and actively promote only its virtues to artificially inflate the price. And when the stock price appreciates, they sell it at an artificially inflated price.
- Penny stocks have low liquidity. Many penny stocks are thinly traded. When buying or selling a stock that has low trading volume, investors may not be able to do so at their desired price or time, and that can be costly.
Tips for trading penny stocks
Trading penny stocks can be risky due to their potential for high volatility and low liquidity. Therefore, investors should proceed with caution and measure. Here are some tips to consider:
- Invest money which is not a part of your regular expenditure. Never invest money you can’t afford to lose. It also may be best to avoid penny stocks if you have a short investment time horizon.
- Pay close attention to market trends to make informed decisions.
- Use technical analysis, charts, and watch patterns to predict future price movements. Penny stocks can provide significant returns but come with a lot of risk.
Here is the list of the best Penny Stocks to buy Right now:
|
Sr |
Company Name |
Symbol |
Stock Price |
Market Cap |
|
1 |
Savara |
SVRA |
$ 3.64 |
$ 598.32 million |
|
2 |
Navitas Semiconductor |
NVTS |
||
|
3 |
Archer Aviation Inc. |
ACHR |
||
|
4 |
Pitney Bowes |
PBI |
||
|
5 |
Taboola |
TBLA |
$ 3.52 |
$ 1.14 billion |
Savara
Savara is a clinical-stage biopharmaceutical company developing treatments for rare respiratory diseases. Its lead product candidate is an immunostimulator called molgramostim. Molgramostim is in phase 3 clinical trials to treat autoimmune pulmonary alveolar proteinosis, or aPAP.
Molgramostim has received an FDA orphan drug designation — given to drugs targeting rare diseases — for treating aPAP. It has also received a similar designation from the European Medicines Agency and a breakthrough therapy and fast-track designation by the FDA.
Savara expects data from its pivotal phase 3 trial of molgramostim by mid-2024. The company also said it has enough cash to fund operations into 2026.
Breakthrough therapy and fast-track designations suggest the FDA is facilitating molgramostim’s approval process. The biopharma company has reported enough cash to fund operations into 2026. Moreover, the Phase 3 trial data on molgramostim is imminent. However, there is a risk that the molgramostim trial data disappoints. Also, it may take a while for Savara to commercialize molgramostim and turn a profit. Given aPAP is an extremely rare disease, molgramostim’s market size may be limited.
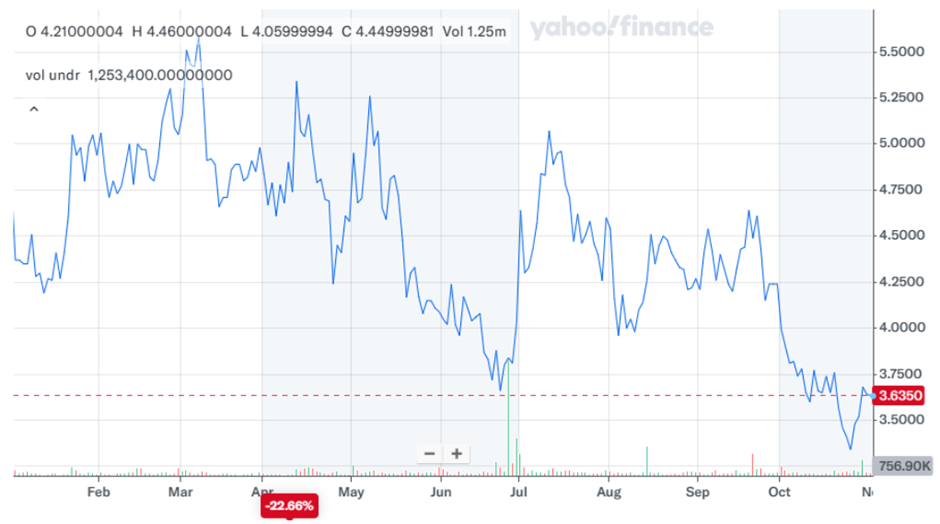
The chart below shows the performance of Savara Stock in the past year. The stock started the year 2024 at a price of $ 4.65. After a small decline in the initial month, the stock picked up pace and went as high as $ 5.59 in March. Then the stock started to decline and continued to do so in the next few months. The stock went as low as $ 3.66. Then again, the stock went up and touched $ 5.07, and eventually the stock last closed at $ 3.63. The stock remained volatile throughout the year with a 22 % decline during the year.
Navitas Semiconductor
Navitas Semiconductor develops ultra-efficient gallium nitride (GaN) semiconductors. The company hopes to help transition the semiconductor industry from silicon chips to GaN for power applications. Those applications include consumer electronics, fast mobile chargers, and data centers.
Navitas has reported impressive growth in recent quarters. The company also said customers have responded positively to its new technology, including GaNSlim products. Unfortunately, the company is not consistently profitable and has required periodic capital infusions.
The market of Navitas is a massive high-growth market. The company is reported acquiring new contracts among AI-based data center customers. And its customers are reportedly increasing at a very high rate. However, there have been liquidity issues for the company, where cash in hand has been problematic. Moreover, the future of good profitability is still unclear.
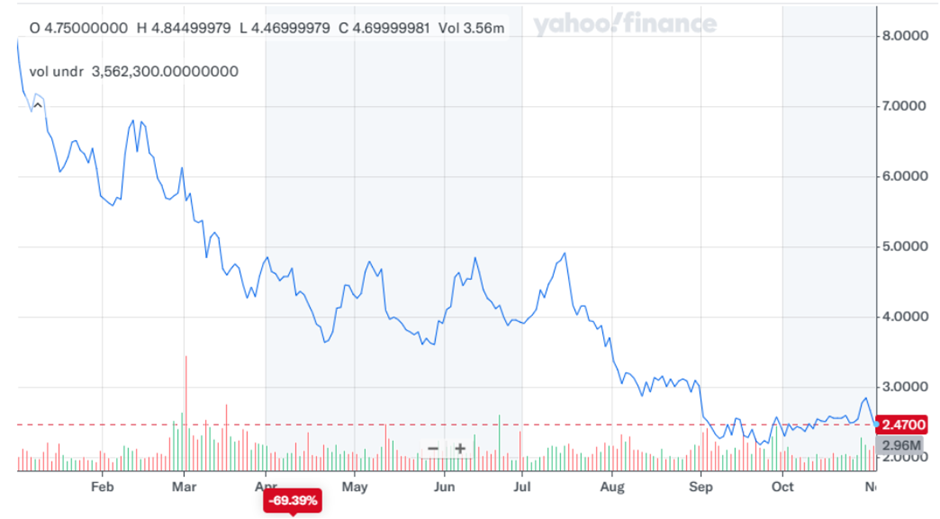
The below chart shows the performance of Navita’s stock during the current year. The stock started the year 2024 at a price of $ 7.92. The stock remained bullish throughout the year and went as low as $ 2.18. The stock last closed at $ 2.47, representing a 68 % decline to date.
Archer Aviation Inc.
Archer Aviation develops and produces electric vertical takeoff and landing, or eVTOL, aircraft. Archer’s Midnight aircraft is a piloted, four-passenger eVTOL. The Midnight is designed to perform several short, back-to-back flights with minimal charge times between flights. Archer hopes the Midnight could eventually cut 60 to 90-minute urban commutes to 10 to 20-minute electric air taxi flights.
In June 2024, Archer announced the Federal Aviation Administration granted the company certification to operate a commercial airline. Archer also recently announced a large deal with the Abu Dhabi Investment Office. The agreement would accelerate the development of commercial air taxi operations in the United Arab Emirates. Archer has yet to be profitable but has maintained good cash liquidity.
Recently Archer Aviation received FAA certification to operate a commercial airline. Its two-pronged approach to direct aircraft sales and air taxi services is different from mainstream aviation companies. And it has started to expand its partnership with other major airlines which include United Airlines and Stellantis. However, the company’s business model is still very vague and not publicly understood. And the high price of tickets, the company is offering is a big downside towards its expansion and profitability. One of its unique offerings the “electric vertical takeoff and landing” is no doubt unique, and has a very small market that may take many years to mature.
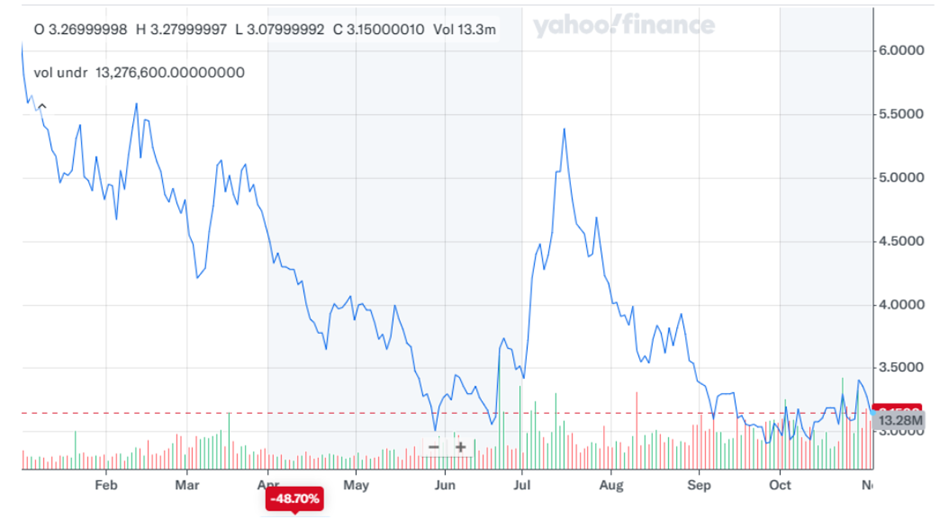
The chart below shows the performance of Archer Aviation stock during the current year. The stock kicked off the year at a price of $ 6.02 with a bearish stance. This bearish performance continued for many months and the stock went as low as $ 3 in May. From here the stock recovered and went as high as $ 5.39. Then again, the stock started to decline and was seen last closing at $ 3.15. Overall, the stock’s year-to-date performance shows a 48 % decline.
Pitney Bowes
Pitney Bowes Inc., a shipping and mailing company, provides technology, logistics, and financial services to small and medium-sized businesses, large enterprises, retailers, and government clients in the United States and internationally.
It operates through:
- Global E-commerce – The Global E-commerce segment provides domestic parcel services, cross-border solutions, and digital delivery services
- Presort Services – The Presort Services segment offers mail sortation services, which allow clients to qualify volumes of first-class mail, marketing mail, marketing mail flats, and bound printed matter for postal work sharing discounts.
- SendTech Solutions segments – The SendTech Solutions segment provides physical and digital mailing and shipping technology solutions, and other applications for sending, tracking, and receiving letters, parcels, and flats as well as financing alternatives to finance equipment and product purchases.
It markets its products, solutions, and services through direct and inside sales forces, global and regional partner channels, direct mailings, and digital channels.
Shares of shipping company Pitney Bowes have lost about half their value since the beginning of 2021, with the company weighed down by some poor decisions and investments in its global e-commerce (GEC) segment. In May, Pitney Bowes announced plans to cut upward of $100 million in annual costs as part of a broader push to overhaul the business. Pitney Bowes has agreed to liquidate much of its money-losing e-commerce business with the help of Hilco Global.
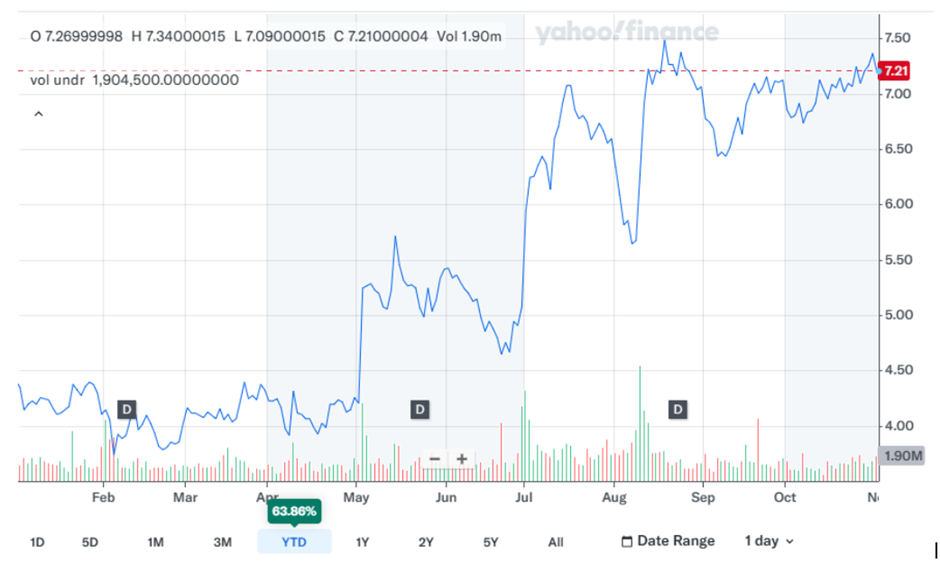
The below chart shows the stock performance of Pitney Bowes during the current year. The stock started the year 2024 at a price of $ 4.4. During the initial months, the stock maintained its stock price. In May, the stock kicked off with a bullish stance and remained bullish throughout the year. The stock went as high as $ 7.5 and was seen last closing at $ 7.21. Overall, the year-to-date performance shows a 64 % appreciation to date.
Taboola
Taboola.com is an online advertising and content company. It provides a two-sided marketplace that connects digital property owners with advertisers. Taboola focuses on the open web market, which refers to digital properties outside closed-off platforms such as Facebook, Google, and Amazon.com. Taboola estimates that the open web content market is worth over $80 billion. Its recommendation engine incorporates artificial intelligence and deep learning technology. The company works with a vast network of advertisers to reach millions of daily users.
Taboola’s partnership with Yahoo is a significant source of revenue. Its revenue growth has been pretty high in recent quarters. Additionally, its AI bidding technology suite Maximize Conversions generates significant revenue for the company. However, Taboola should be vigilant about its AI machine learning and algorithms which should remain competitive. And a huge reliance on revenue from a single source, that is Yahoo, can be risky in unforeseen circumstances.
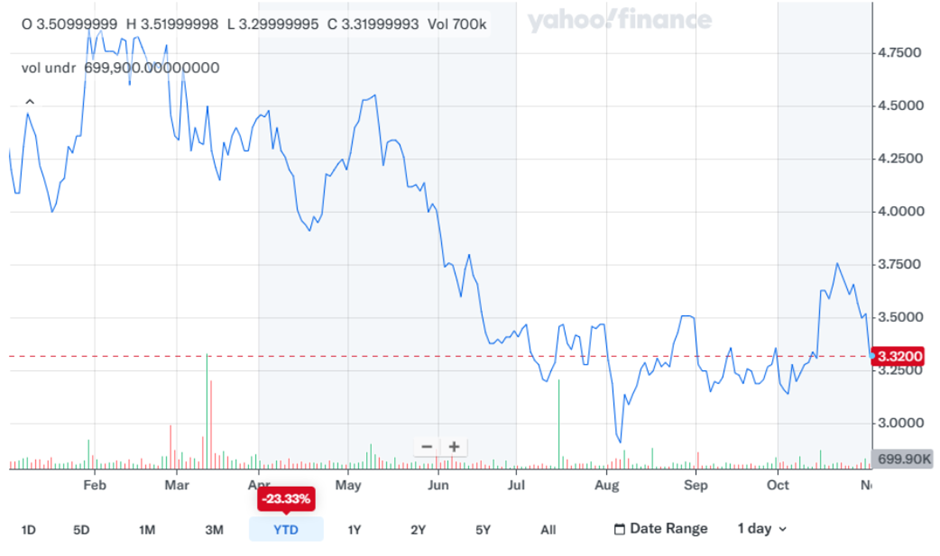
The chart below of Taboola stock shows the performance for the current year. The stock kicked off the year 2024 at a price of $ 4.3. After an initial hike in price, where the price reached the peak of $ 4.86, the stock reversed its course and went bearish. This bearish trend continued for a major part of the year and the stock went as low as $ 2.8752 in August. From here on the stock recovered a bit and eventually closed at $ 3.32. Overall, the stock declined by 22.8 % during the year.
FURTHER DISCLOSURES AND DISCLAIMER CONCERNING RISK, RESPONSIBILITY AND LIABILITY Trading in the Foreign Exchange market is a challenging opportunity where above average returns are available for educated and experienced investors who are willing to take above average risk. However, before deciding to participate in Foreign Exchange (FX) trading, you should carefully consider your investment objectives, level of xperience and risk appetite. Do not invest or trade capital you cannot afford to lose. EME PROCESSING AND CONSULTING, LLC, THEIR REPRESENTATIVES, AND ANYONE WORKING FOR OR WITHIN WWW.ELLIOTTWAVE- FORECAST.COM is not responsible for any loss from any form of distributed advice, signal, analysis, or content. Again, we fully DISCLOSE to the Subscriber base that the Service as a whole, the individual Parties, Representatives, or owners shall not be liable to any and all Subscribers for any losses or damages as a result of any action taken by the Subscriber from any trade idea or signal posted on the website(s) distributed through any form of social-media, email, the website, and/or any other electronic, written, verbal, or future form of communication . All analysis, trading signals, trading recommendations, all charts, communicated interpretations of the wave counts, and all content from any media form produced by www.Elliottwave-forecast.com and/or the Representatives are solely the opinions and best efforts of the respective author(s). In general Forex instruments are highly leveraged, and traders can lose some or all of their initial margin funds. All content provided by www.Elliottwave-forecast.com is expressed in good faith and is intended to help Subscribers succeed in the marketplace, but it is never guaranteed. There is no “holy grail” to trading or forecasting the market and we are wrong sometimes like everyone else. Please understand and accept the risk involved when making any trading and/or investment decision. UNDERSTAND that all the content we provide is protected through copyright of EME PROCESSING AND CONSULTING, LLC. It is illegal to disseminate in any form of communication any part or all of our proprietary information without specific authorization. UNDERSTAND that you also agree to not allow persons that are not PAID SUBSCRIBERS to view any of the content not released publicly. IF YOU ARE FOUND TO BE IN VIOLATION OF THESE RESTRICTIONS you or your firm (as the Subscriber) will be charged fully with no discount for one year subscription to our Premium Plus Plan at $1,799.88 for EACH person or firm who received any of our content illegally through the respected intermediary’s (Subscriber in violation of terms) channel(s) of communication.
Editors’ Picks

EUR/USD weakens to four-week lows near 1.1750
EUR/USD’s selling pressure is gathering pace now, approaching the area of multi-week troughs in the mid-1.1700s on Thursday. The pair’s intense decline comes on the back of another day of solid gains in the US Dollar, particulalry exacerbated following firm prints from the weekly US labour market.

GBP/USD drops further, hovers around 1.3460
In line with the rest of its risk-linked peers, GBP/USD faces increasing selling pressure and recedes toward the 1.3460 region, or four-week lows, on Thursday. Cable’s persistent pullback comes in response to the continuation of the recovery in the Greenback amid a solid US data and a divided FOMC when it comes to the Fed’s rate path.

Japanese Yen hangs near one-week low vs. USD amid worries about Japan’s fiscal health
The USD/JPY pair gains positive traction for the second straight day – also marking the third day of a move up in the previous four – and climbs to over a one-week high, around the 155.35 area, on Thursday. Spot prices, however, retreat a few pips during the early European session and currently trade just above the 155.00 psychological mark, up nearly 0.20% for the day.
Editors’ Picks
EUR/USD weakens to four-week lows near 1.1750
EUR/USD’s selling pressure is gathering pace now, approaching the area of multi-week troughs in the mid-1.1700s on Thursday. The pair’s intense decline comes on the back of another day of solid gains in the US Dollar, particulalry exacerbated following firm prints from the weekly US labour market.
GBP/USD drops further, hovers around 1.3460
In line with the rest of its risk-linked peers, GBP/USD faces increasing selling pressure and recedes toward the 1.3460 region, or four-week lows, on Thursday. Cable’s persistent pullback comes in response to the continuation of the recovery in the Greenback amid a solid US data and a divided FOMC when it comes to the Fed’s rate path.

Gold clings to daily gains near $5,000
Gold struggles for direction and clings to its daily gains around the key $5,000 mark per troy ounce on Thursday. The precious metal sticks to the bid bias amid reignited geopolitical tensions in the Middle East and despite marked gains in the US Dollar and rising US Treasury yields across the curve.

Ripple slips toward $1.40 despite SG-FORGE tapping protocol for EUR CoinVertible
XRP extends its decline, nearing $1.40 support, as risk appetite fades in the broader market. SG-FORGE’s EUR CoinVertible launches on the XRP Ledger, leveraging the blockchain’s scalability, speed, security, and decentralization.

Hawkish Fed minutes and a market finding its footing
It was green across the board for US Stock market indexes at the close on Wednesday, with most S&P 500 names ending higher, adding 38 points (0.6%) to 6,881 overall. At the GICS sector level, energy led gains, followed by technology and consumer discretionary, while utilities and real estate posted the largest losses.
RECOMMENDED LESSONS
Making money in forex is easy if you know how the bankers trade!
I’m often mystified in my educational forex articles why so many traders struggle to make consistent money out of forex trading. The answer has more to do with what they don’t know than what they do know. After working in investment banks for 20 years many of which were as a Chief trader its second knowledge how to extract cash out of the market.
5 Forex News Events You Need To Know
In the fast moving world of currency markets where huge moves can seemingly come from nowhere, it is extremely important for new traders to learn about the various economic indicators and forex news events and releases that shape the markets. Indeed, quickly getting a handle on which data to look out for, what it means, and how to trade it can see new traders quickly become far more profitable and sets up the road to long term success.
Top 10 Chart Patterns Every Trader Should Know
Chart patterns are one of the most effective trading tools for a trader. They are pure price-action, and form on the basis of underlying buying and selling pressure. Chart patterns have a proven track-record, and traders use them to identify continuation or reversal signals, to open positions and identify price targets.
7 Ways to Avoid Forex Scams
The forex industry is recently seeing more and more scams. Here are 7 ways to avoid losing your money in such scams: Forex scams are becoming frequent. Michael Greenberg reports on luxurious expenses, including a submarine bought from the money taken from forex traders. Here’s another report of a forex fraud. So, how can we avoid falling in such forex scams?
What Are the 10 Fatal Mistakes Traders Make
Trading is exciting. Trading is hard. Trading is extremely hard. Some say that it takes more than 10,000 hours to master. Others believe that trading is the way to quick riches. They might be both wrong. What is important to know that no matter how experienced you are, mistakes will be part of the trading process.
The challenge: Timing the market and trader psychology
Successful trading often comes down to timing – entering and exiting trades at the right moments. Yet timing the market is notoriously difficult, largely because human psychology can derail even the best plans. Two powerful emotions in particular – fear and greed – tend to drive trading decisions off course.