![]() Rick Wright
Rick Wright
Online Trading Academy
Hello traders! This week’s newsletter will discuss one of the most ignored (in my opinion) aspects of trading-the power of patience!
By now, hopefully you have begun to understand the power of our core strategy, that is, to buy to go long during an uptrend in quality demand zones, and to sell to go short during a downtrend in quality supply zones. However, a “problem” that many new traders (and experienced traders!) seem to have is the need to be “first” when price hits their chosen level. While occasionally price hits a level and IMMEDIATELY turns and goes your chosen direction, more often than not the prices hang out in a level for a bit before turning. Many traders will execute quick trade entries, yet this pause in action will shake their confidence in the trade causing many to take themselves out early, or even move their stop loss too early for the trade. When the trader is then out of the trade, very often the chart will then move directly to their target, yet they have no position on! Has this happened to anyone else besides me?
One thing to be aware of, especially when trading from larger time frames like daily or four hour charts, is the fact that THERE IS NO TROPHY FOR BEING FIRST TO ENTER THAT TRADE! I prefer to wait around for a couple of candles to make sure that the zone is holding before entering my trades. But how long should you wait?
My preferred technique is to look back on the chart at the last 3-5 times that my currency pair has turned to see how much time I should give before committing to a trade entry. Let’s look at a chart to see what this looks like:
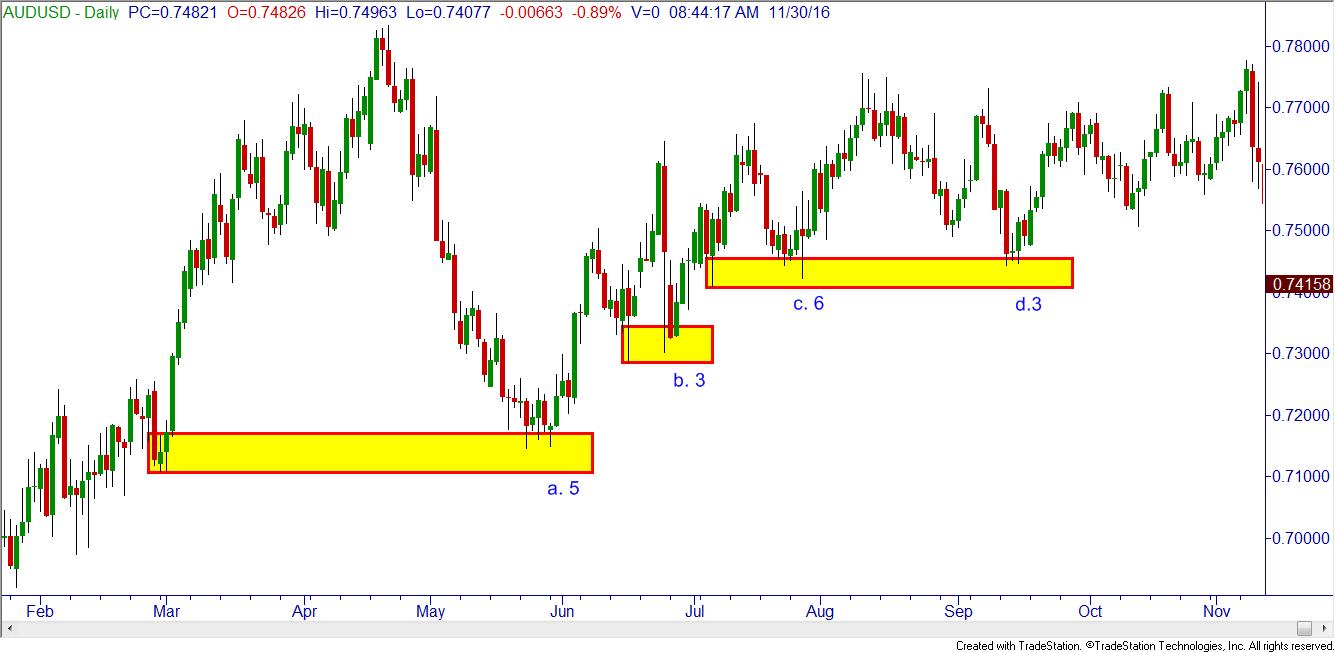
In this AUDUSD daily chart, I’ve marked in three demand zones. At point marked a. 5, the candles pull back to the demand zone from late April/early March. Notice how much time it spent at the zone before the next move up. Five trading days! (Hence the 5.) If you would have chosen a trade entry on the first candle in the zone, you would have had to be extremely patient to wait for the subsequent boring little bounces out then back into the zone before the move actually happened. What about in the demand zone marked b. 3? From my point of view, it took 3 candles of hanging out around the zone before price finally left.
How about the areas marked c. 6 and d. 3? You guessed it, 6 candles before the turn and then 3 candles. Are you starting to get the idea here?
Let’s try this on the short side, with a slightly smaller time frame.
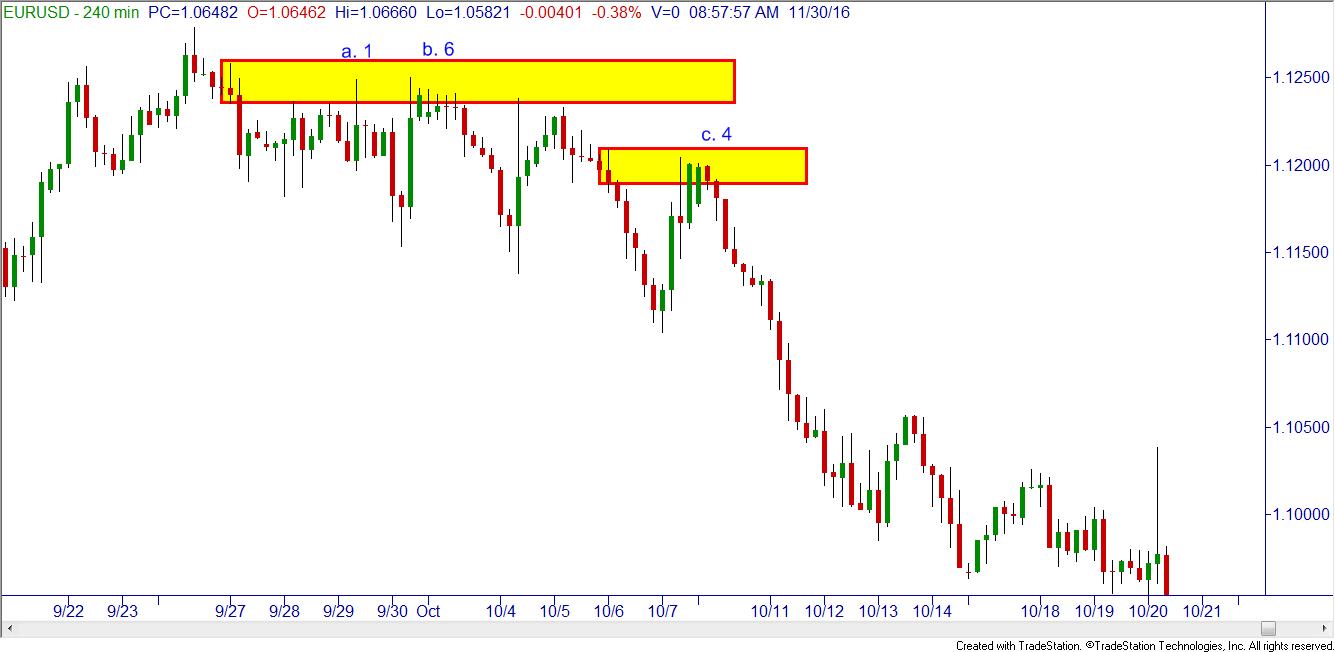
On this EURUSD chart, I’ve marked in a couple of supply zones. At point marked a. 1, there was only part of one candle before the move to the downside. At b. 6, believe it or not it took 6 candles before the turn happened. I didn’t mark the other turns at that level for clarity sake. At the point marked c. 4, even though the downtrend had clearly started it still took 4 candles before the trend resumed. There are other trade entries along the way which I didn’t mark; hopefully you can spot them by now!
So, what is the lesson in all of this? In my plan, I’ll look back the last few times that price has turned and count how many candles the turns usually take. If the turns take on average 4 candles, my trade entry won’t be until the third candle. Again, I’m not looking to be first! I can wait around without a position on for a few candles to “make sure” that the level is holding before I enter my trade. Yes, I will miss a few trades by being this patient; however, there is always another trade around the corner.
So there you have it. By being patient and entering at the zone after a bit of time has passed you will have less market risk (any time you have a trade on you are taking market risk) because you are in trades for less time, plus you will be less likely to exit too early because “the trade isn’t working yet”. Don’t rush your trade entries!
This content is intended to provide educational information only. This information should not be construed as individual or customized legal, tax, financial or investment services. As each individual's situation is unique, a qualified professional should be consulted before making legal, tax, financial and investment decisions. The educational information provided in this article does not comprise any course or a part of any course that may be used as an educational credit for any certification purpose and will not prepare any User to be accredited for any licenses in any industry and will not prepare any User to get a job. Reproduced by permission from OTAcademy.com click here for Terms of Use: https://www.otacademy.com/about/terms
Editors’ Picks

EUR/USD bounces off lows, back to 1.1860
EUR/USD now manages to regain some balance, retesting the 1.1860-1.1870 band after bottoming out near 1.1830 following the US NFP data on Wednesday. The pair, in the meantime, remains on the defensive amid fresh upside traction surrounding the US Dollar.

GBP/USD rebounds to 1.3660, USD loses momentum
GBP/USD trades with decent gains in the 1.3660 region, regaining composure following the post-NFP knee-jerk toward the 1.3600 zone on Wednesday. Cable, in the meantime, should now shift its attention to key UK data due on Thursday, including preliminary GDP gauges.

USD/JPY remains heavy around 153.00 on firmer Japanese Yen
USD/JPY is sustaining its three-day rout at around 153.00 in the European session on Wednesday, awaiting the closely-watched US NFP report. Rising bets on Fed rate cuts keep the US Dollar depressed. In contrast, expectations that PM Takaichi's policies will boost the economy and allow the BoJ to stick to its hawkish stance bolster the Japanese Yen, weighing on the pair amid intervention fears.
Editors’ Picks
EUR/USD bounces off lows, back to 1.1860
EUR/USD now manages to regain some balance, retesting the 1.1860-1.1870 band after bottoming out near 1.1830 following the US NFP data on Wednesday. The pair, in the meantime, remains on the defensive amid fresh upside traction surrounding the US Dollar.
GBP/USD rebounds to 1.3660, USD loses momentum
GBP/USD trades with decent gains in the 1.3660 region, regaining composure following the post-NFP knee-jerk toward the 1.3600 zone on Wednesday. Cable, in the meantime, should now shift its attention to key UK data due on Thursday, including preliminary GDP gauges.

Gold stays bid, still below $5,100
Gold keeps the bid tone well in place on Wednesday, retargeting the $5,100 zone per troy ounce on the back of humble gains in the US Dollar and firm US Treasury yields across the curve. Moving forward, the yellow metal’s next test will come from the release of US CPI figures on Friday.

Ripple Price Forecast: XRP sell-side pressure intensifies despite surge in addresses transacting on-chain
Ripple (XRP) is edging lower around $1.36 at the time of writing on Wednesday, weighed down by low retail interest and macroeconomic uncertainty, which is accelerating risk-off sentiment.

US jobs data surprises to the upside, boosts stocks but pushes back Fed rate cut expectations
This was an unusual payrolls report for two reasons. Firstly, because it was released on Wednesday, and secondly, because it included the 2025 revisions alongside the January NFP figure.
RECOMMENDED LESSONS
Making money in forex is easy if you know how the bankers trade!
I’m often mystified in my educational forex articles why so many traders struggle to make consistent money out of forex trading. The answer has more to do with what they don’t know than what they do know. After working in investment banks for 20 years many of which were as a Chief trader its second knowledge how to extract cash out of the market.
5 Forex News Events You Need To Know
In the fast moving world of currency markets where huge moves can seemingly come from nowhere, it is extremely important for new traders to learn about the various economic indicators and forex news events and releases that shape the markets. Indeed, quickly getting a handle on which data to look out for, what it means, and how to trade it can see new traders quickly become far more profitable and sets up the road to long term success.
Top 10 Chart Patterns Every Trader Should Know
Chart patterns are one of the most effective trading tools for a trader. They are pure price-action, and form on the basis of underlying buying and selling pressure. Chart patterns have a proven track-record, and traders use them to identify continuation or reversal signals, to open positions and identify price targets.
7 Ways to Avoid Forex Scams
The forex industry is recently seeing more and more scams. Here are 7 ways to avoid losing your money in such scams: Forex scams are becoming frequent. Michael Greenberg reports on luxurious expenses, including a submarine bought from the money taken from forex traders. Here’s another report of a forex fraud. So, how can we avoid falling in such forex scams?
What Are the 10 Fatal Mistakes Traders Make
Trading is exciting. Trading is hard. Trading is extremely hard. Some say that it takes more than 10,000 hours to master. Others believe that trading is the way to quick riches. They might be both wrong. What is important to know that no matter how experienced you are, mistakes will be part of the trading process.
The challenge: Timing the market and trader psychology
Successful trading often comes down to timing – entering and exiting trades at the right moments. Yet timing the market is notoriously difficult, largely because human psychology can derail even the best plans. Two powerful emotions in particular – fear and greed – tend to drive trading decisions off course.