![]() Sam Seiden
Sam Seiden
Independent Analyst
Can you see the Praying Mantis in the picture below? Look closely, it’s looking right at you. Had I not told you it was there, you may never have seen it. While it’s happy resting along the branches, it’s also a full-time trap for insects that crawl on the branches or fly within striking distance. To a bug, the Mantis looks like a safe and secure leaf or branch. As the bug approaches what appears to be a nice resting spot, it has no idea it’s about to become the Mantis’ next meal.
When it comes to trading and investing, the hunter and hunted relationship is no different than in the wild, only the end result typically does not lead to end of life. Make no mistake about it, there is a winner and a loser, nothing in between. There are many invitations to buy into a market. Some are opportunities that lead to low risk and high reward buying opportunities that end up being very profitable trades. Others are traps that lead to a quick decline in price and losses for the hunted (buyer) and profits for the hunter (seller).
The other day in a live trading session with our students, a classic bull trap opportunity presented itself. For today’s piece, let’s take a look at that opportunity and walk through the setup so you, too, can profit from traps, not fall for them.
The opportunity was to short the NASDAQ into a supply level. Notice the supply level on the chart, the yellow shaded area and origin of supply zone lines. This is a price level where supply exceeds demand. How do we know this? Simple, price could not stay at this level and declined away in strong fashion (among other odds enhancers). Again, it declines because supply exceeds demand at that level. We wrap two lines around that level and carry that level forward because we want to remember where supply exceeds demand as that is where price is likely to turn lower in the future when it reaches that level.
Sam Seiden Live Trading Session – 4/13/18: NASDAQ – The Setup
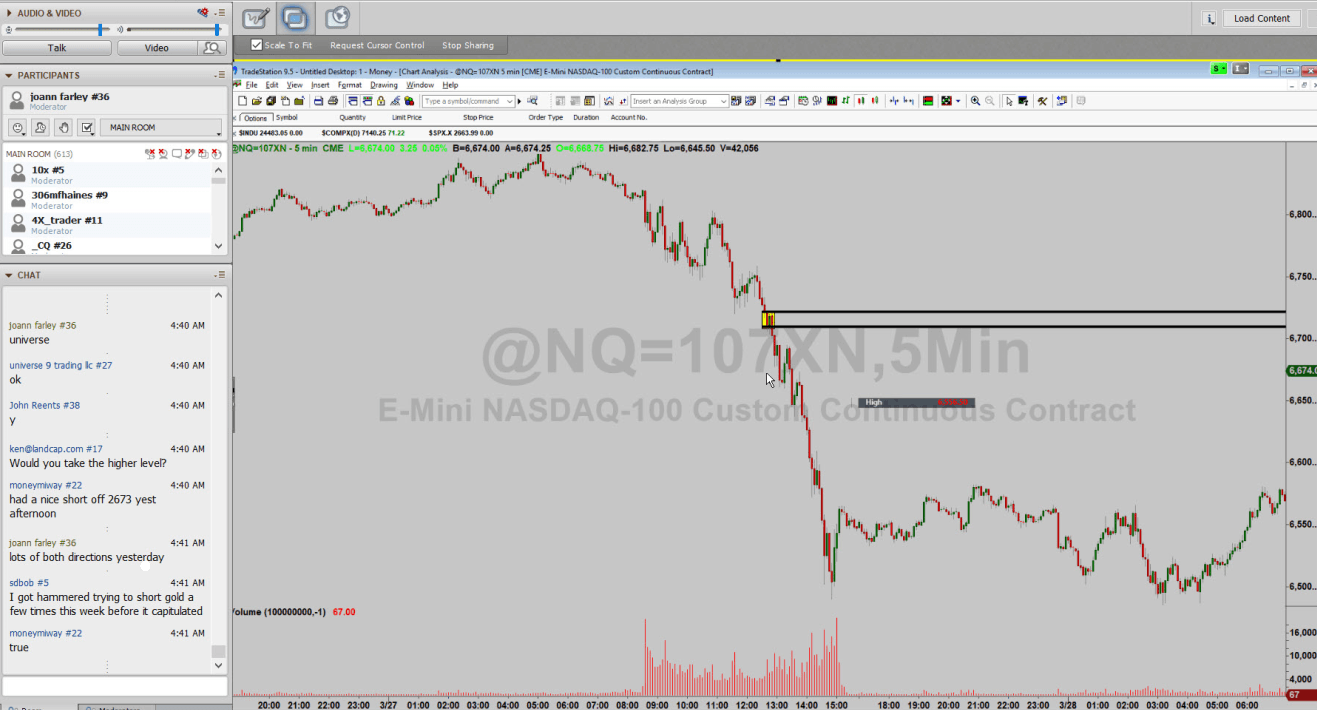
This is a bull trap shorting opportunity for the following reason, notice the circled area where price met entry for our short position and the price action that preceded it. Price was basing sideways just before the entry. Then, price breaks out to a new high (circled area). Remember, the NASDAQ is one of the biggest and most popular equity index markets in the world, which means most traders/investors are watching it. So, if and when price breaks out to new highs, this will setup bullish expectations for most who are watching this market.
Most traders are taught that when a high is broken, that is a breakout and price goes higher so it is time to buy. When there is a fresh supply level just above, like we had in that session, this bullish thinking is a bull TRAP. What we were betting on with this shorting opportunity was that when price traded above that high and into our supply level, most people would become bullish and buy right into that fresh supply level. If this happened, we would be the willing low risk and high reward seller. The market at that time also offered a huge profit zone below.
A couple hours later, price began to rally. Soon, it rallied to a new high and a rush of buying came into the market as expected. Price rallied up a bit more and reached our supply level for our shorting opportunity. That ended up being the high of the day and the NASDAQ fell 80 points from our supply to reach our profit target below (chart on the right, demand).
Sam Seiden Live Trading Session – 4/13/18: NASDAQ – The Result
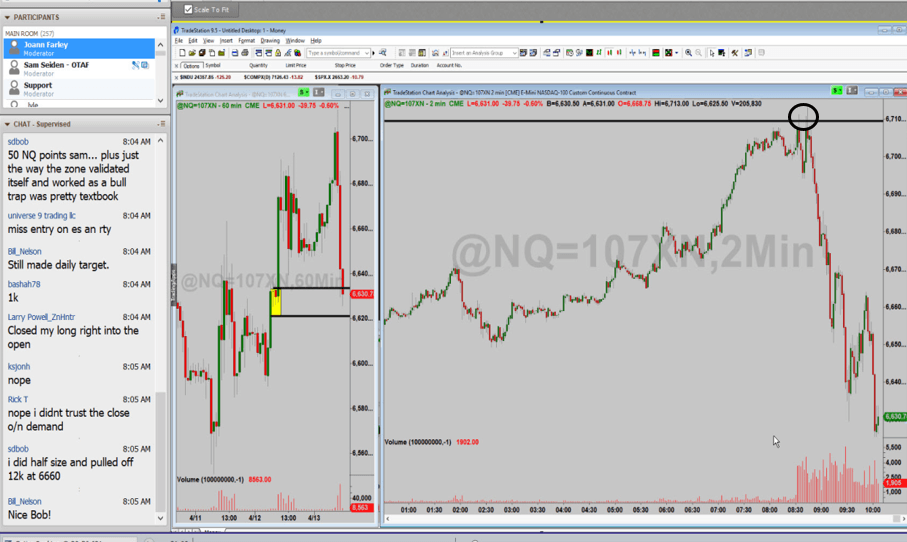
The key factor that makes this work is knowing how everyone is trained to think the markets. Most are trained to buy on a new high of the day and buy at supply (retail) levels; yes, they are trained to walk right into the bull trap. I am trained to do the opposite. When prices are at retail (supply) levels, I want to sell to the buyer who is trained to buy at retail price levels. Just like insects never see the mantis, novice traders and investors never consider the fact that they are buying after a rally in price and into a price level where supply exceeds demand.
If you’re going to compete in the game of trading, make sure you have an edge or you will lose your money to someone who does. This game is a transfer of accounts from those who fall for professional traps, into the accounts of those who can clearly identify the traps. It’s the old hunter and the hunted. Learn to spot the difference between traps and opportunities. Like the mantis, all you have to do is sit and wait for someone to fall for the trap and buy at supply, they always do…
Note: All information on this page is subject to change. The use of this website constitutes acceptance of our user agreement. Please read our privacy policy and legal disclaimer. Opinions expressed at FXstreet.com are those of the individual authors and do not necessarily represent the opinion of FXstreet.com or its management. Risk Disclosure: Trading foreign exchange on margin carries a high level of risk, and may not be suitable for all investors. The high degree of leverage can work against you as well as for you. Before deciding to invest in foreign exchange you should carefully consider your investment objectives, level of experience, and risk appetite. The possibility exists that you could sustain a loss of some or all of your initial investment and therefore you should not invest money that you cannot afford to lose. You should be aware of all the risks associated with foreign exchange trading, and seek advice from an independent financial advisor if you have any doubts.
Editors’ Picks

EUR/USD loses ground below 1.1850 ahead of FOMC Minutes
The EUR/USD pair loses traction near 1.1840 during the early European session on Wednesday, pressured by renewed US Dollar demand. Traders brace for the Federal Open Market Committee Minutes for signals on future rate cuts, which will be released later on Wednesday.

When is the UK CPI data and how could it affect GBP/USD?
The United Kingdom Consumer Price Index data for January is scheduled to be published today at 07:00 GMT. GBP/USD trades slightly lower at around 1.3556 as of writing. The 20-period Exponential Moving Average trends lower at 1.3593 and continues to cap rebounds. Price holds beneath this gauge, maintaining a short-term bearish bias.

USD/JPY is looking for direction around 153.00 with key US data in focus
USD/JPY reversal from 153.70 has been contained above 152.70 on Tuesday. Major currencies are trading within narrow ranges amid thin trading volumes. Investors await the release of the US GDP and PCE Inflation figures to make decisions.
Editors’ Picks
When is the UK CPI data and how could it affect GBP/USD?
The United Kingdom Consumer Price Index data for January is scheduled to be published today at 07:00 GMT. GBP/USD trades slightly lower at around 1.3556 as of writing. The 20-period Exponential Moving Average trends lower at 1.3593 and continues to cap rebounds. Price holds beneath this gauge, maintaining a short-term bearish bias.
EUR/USD loses ground below 1.1850 ahead of FOMC Minutes
The EUR/USD pair loses traction near 1.1840 during the early European session on Wednesday, pressured by renewed US Dollar demand. Traders brace for the Federal Open Market Committee Minutes for signals on future rate cuts, which will be released later on Wednesday.

Gold: Is the $5,000 level back in sight?
Gold snaps a two-day downtrend, as recovery gathers traction toward $5,000 on Wednesday. The US Dollar recovers from the overnight sell-off as rebalancing trades resume ahead of Fed Minutes. The 38.2% Fib support holds on the daily chart for now. What does that mean for Gold?

Pi Network rally defies market pressure ahead of its first anniversary
Pi Network is trading above $0.1900 at press time on Wednesday, extending the weekly gains by nearly 8% so far. The steady recovery is supported by a short-term pause in mainnet migration, which reduces pressure on the PI token supply for Centralized Exchanges. The technical outlook focuses on the $0.1919 resistance as bullish momentum increases.

UK jobs market weakens, bolstering rate cut hopes
In the UK, the latest jobs report made for difficult reading. Nonetheless, this represents yet another reminder for the Bank of England that they need to act swiftly given the collapse in inflation expected over the coming months.
RECOMMENDED LESSONS
Making money in forex is easy if you know how the bankers trade!
I’m often mystified in my educational forex articles why so many traders struggle to make consistent money out of forex trading. The answer has more to do with what they don’t know than what they do know. After working in investment banks for 20 years many of which were as a Chief trader its second knowledge how to extract cash out of the market.
5 Forex News Events You Need To Know
In the fast moving world of currency markets where huge moves can seemingly come from nowhere, it is extremely important for new traders to learn about the various economic indicators and forex news events and releases that shape the markets. Indeed, quickly getting a handle on which data to look out for, what it means, and how to trade it can see new traders quickly become far more profitable and sets up the road to long term success.
Top 10 Chart Patterns Every Trader Should Know
Chart patterns are one of the most effective trading tools for a trader. They are pure price-action, and form on the basis of underlying buying and selling pressure. Chart patterns have a proven track-record, and traders use them to identify continuation or reversal signals, to open positions and identify price targets.
7 Ways to Avoid Forex Scams
The forex industry is recently seeing more and more scams. Here are 7 ways to avoid losing your money in such scams: Forex scams are becoming frequent. Michael Greenberg reports on luxurious expenses, including a submarine bought from the money taken from forex traders. Here’s another report of a forex fraud. So, how can we avoid falling in such forex scams?
What Are the 10 Fatal Mistakes Traders Make
Trading is exciting. Trading is hard. Trading is extremely hard. Some say that it takes more than 10,000 hours to master. Others believe that trading is the way to quick riches. They might be both wrong. What is important to know that no matter how experienced you are, mistakes will be part of the trading process.
The challenge: Timing the market and trader psychology
Successful trading often comes down to timing – entering and exiting trades at the right moments. Yet timing the market is notoriously difficult, largely because human psychology can derail even the best plans. Two powerful emotions in particular – fear and greed – tend to drive trading decisions off course.