AI in the science of capital allocation – Optimizing position size in FX, commodities, and crypto

In modern trading and investment strategy, success is not only about identifying the right market opportunities. It’s also about knowing how much capital to allocate to each position. This fundamental decision how much to risk on a given trade or investment is what separates disciplined professionals from reckless speculators. It’s not just a matter of strategy; it’s a science.
At the heart of this science lies position sizing, the methodical determination of how large a trade should be, relative to risk tolerance, volatility, and portfolio objectives. In recent years, Artificial Intelligence (AI), particularly through machine learning and reinforcement learning, has added a revolutionary layer to this discipline. Instead of relying solely on fixed rules or static models, AI allows traders to dynamically adjust their exposure in response to real-time market conditions, volatility regimes, and behavioral patterns.
Why position sizing matters
Position sizing is the cornerstone of robust portfolio management. Even the most accurate market prediction can result in losses if the position is too large and volatility spikes. Conversely, even a moderate edge in the market can lead to compounding gains if size is optimized intelligently.
Poor position sizing often results in:
-
Overexposure during high-volatility periods, leading to sharp drawdowns.
-
Underexposure during high-confidence setups, resulting in missed opportunities.
-
Inconsistent capital deployment across trades, reducing the portfolio’s risk-adjusted return.
Traditional approaches to position sizing
Classical position sizing methods include:
-
Fixed fractional method: Risking a constant percentage of total capital per trade (e.g., 1%-2%).
-
Kelly criterion: Maximizing long-term growth by sizing proportionally to the edge and variance.
-
Volatility targeting: Adjusting position size to achieve a desired volatility exposure.
-
Risk-reward ratio sizing: Allocating size based on expected profit relative to potential loss.
These methods offer structure but are often limited by assumptions:
-
They treat all market environments the same.
-
They fail to adapt to regime shifts (e.g., transitioning from low-volatility to high-volatility periods).
-
They rely heavily on historical or static metrics.
This is where AI-powered position sizing redefines the game.
The AI advantage in position sizing
AI introduces a dynamic, context-aware, and data-driven approach to capital allocation. Using machine learning algorithms, systems can assess not just volatility, but the quality of signals, correlations, liquidity shifts, behavioral sentiment, and macroeconomic cues all in real time.
AI-powered systems can:
-
Continuously learn from new market data to refine optimal size.
-
Anticipate volatility clusters and reduce position size preemptively.
-
Adjust leverage in accordance with confidence in model predictions.
-
Factor in cross-asset contagion risk and reallocate capital accordingly.
-
Incorporate portfolio-level optimization constraints across instruments.
By transforming static sizing rules into dynamic feedback loops, AI offers a level of precision and adaptability previously unattainable.
A practical framework of applying AI to the position sizing model
Let’s illustrate the process using a real-world trading setup.
Step 1: Define risk per trade
Instead of manually setting a fixed risk level (e.g., 1% of capital), AI systems evaluate the confidence level in a trade signal. If confidence is high and volatility is moderate, it may permit a higher exposure; if confidence drops or volatility spikes, it scales down.
Example: In a long EUR/USD trade, the system sees a confluence of strong macro data, dovish Fed tone, and positive sentiment. Confidence score = 87/100 → risk allocation = 1.75% of capital.
If headline risk or sentiment divergence arises mid-trade, it auto-adjusts size downward.
Step 2: Determine stop-loss threshold using AI volatility forecasts
AI models forecast expected volatility using GARCH, LSTM, or transformer-based volatility prediction models. These forecasts are used to set adaptive stop-loss thresholds that reflect the real, forward-looking risk of the instrument.
Example: In a Brent crude trade, volatility surges due to Middle East tensions. The AI forecasts 1.8x normal range → tighter stop, smaller position.
Step 3: Calculate optimal position size
Based on capital at risk, stop-loss width, and asset volatility, the system calculates position size:
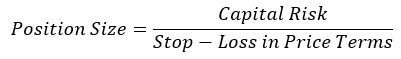
AI enhances this by layering in additional variables:
-
Signal confidence.
-
Macro conditions.
-
Market regime classification (e.g., trending, mean-reverting, chaotic).
-
Correlation with other open positions.
It dynamically rebalances as market conditions evolve.
Step 4: Continuous learning and adaptation
Each trade outcome feeds back into the model. Reinforcement learning adjusts the sizing algorithm over time, rewarding size increases after consistent model accuracy and penalizing aggressive sizing in failed trades. Over time, the AI “learns” your edge, the best environments for your strategy, and the optimal capital to allocate when conditions align.
Real-world examples
Case study one: Crypto market volatility
During the 2021 bull run, an AI-enhanced crypto trading desk used real-time volatility clustering and Twitter sentiment to modulate exposure across altcoins. When sentiment surged but historical volatility signaled a pullback, position sizes were reduced preemptively limiting drawdowns while maintaining trend exposure.
Case study two: FX trading during rate shocks
Ahead of the ECB’s unexpected hawkish pivot in mid-2022, an AI model flagged regime shift risk due to macro tone analysis. It decreased EUR/USD long position sizes to half, protecting the portfolio from the spike in EUR volatility post-announcement.
Portfolio-wide capital allocation
AI also operates at the portfolio level, not just at the trade level.
Allocation is adjusted based on:
-
Cross-asset correlations (to prevent concentration risk).
-
Tail-risk scenarios (e.g., Black Swan detection).
-
Risk budgeting across strategy buckets (e.g., momentum, mean reversion, macro).
-
Liquidity-adjusted sizing based on market depth and slippage estimates.
A neural network could, for instance, learn that adding another high-beta asset increases portfolio variance disproportionately and adjust size downward accordingly, something traditional methods can’t do in real time.
Beyond human limits: AI + trader synergy
AI doesn’t replace the trader, it augments them. While AI determines the mathematically optimal size based on market data and predictive models, the trader brings strategic context:
-
Adjusting sizing for geopolitical risks that AI hasn’t fully captured.
-
Overriding models when structural breaks (like regime change or regulation) occur.
-
Aligning AI output with institutional mandates and client objectives.
This synergy results in smarter risk exposure, not just based on data, but on wisdom.
Dynamic risk efficiency is the new discipline
Position sizing is no longer a rigid rulebook. With AI, it becomes a living system capable of reacting, learning, and evolving with the market. It transforms position sizing from a fixed percentage or formula into a fluid; intelligent function embedded into the very fabric of trading strategy.
Key takeaway
AI-powered position sizing is not just a risk management tool. It’s a return-enhancing, drawdown-reducing, decision-clarifying edge in an increasingly complex and fast-moving world.
As volatility becomes less predictable, as market narratives change in real time, and as information outpaces intuition, it is those who adopt intelligent capital allocation that will shape the future of performance.
Author

Nikolaos Akkizidis
Independent Analyst
Nikolaos Akkizidis is an Independent Financial Writer, Economist, Author, and Speaker with more than two decades of experience in financial services, capital markets, investment advisory, portfolio management, trading, risk manage


