The Average True Range indicator is really rather simple, as the name suggest it is simply the average of the True Range of the past X bars. Ok, so then what is the True Range?
Well instead of just the range of a session which is simply the high – the low the True Range is actually calculated slightly differently (although some basic ATR indicators get this wrong).
In most cases it will be the same as the high – low but actually there are 3 potential ways of calculating a day’s true range depending on the circumstances.
I don’t want to go into details about the variances but the three methods for reference are:
- High – Low
- High – previous Close
- Low – previous Close
Most commonly used ATR setting is for 14 periods and more frequently 14 days, however personally I use the 20 period (and more specifically 20 day) ATR in all of my trading.
Why is this?
Well it’s because I know my statistics for my currency pairs and I know that just under 80% of the time price will stay within a range that is defined by the 20 day ATR.
In the chart below you can see how the ATR is normally plotted. Here I have used my 20 period ATR.
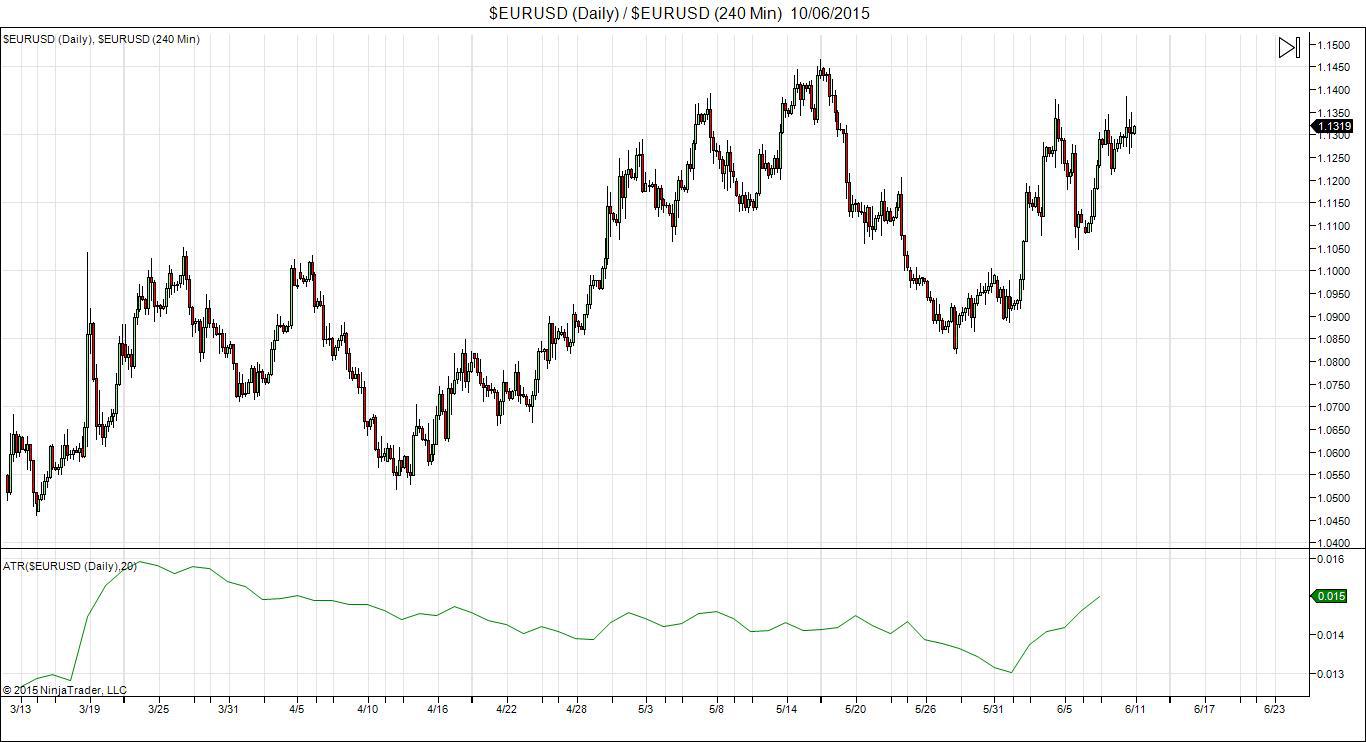
As you can see typically the indicator shows the ATR in a Pip value, in the example above the ATR reading is showing an Average True Range of 150 pips.
So how do people use the ATR?
Well a lot of people use the ATR as a good indication for profit targets. For instance if I know that my ATR is 100 pips and I am taking an intraday trade, then setting targets at the 100 pips could be a stretch so on a daily basis I might target the 80 pip mark instead. If I know we have a non-news day and price has already moved 100 pips on an ATR value of 110 pips, then I know realistically price is unlikely to move much past this (that isn’t to say it won’t it is simply a lower probability)
To make the ATR a little easier to use and more visually accessible for spotting trade setups, we came up with an indicator which is a slight tweak on the ATR.
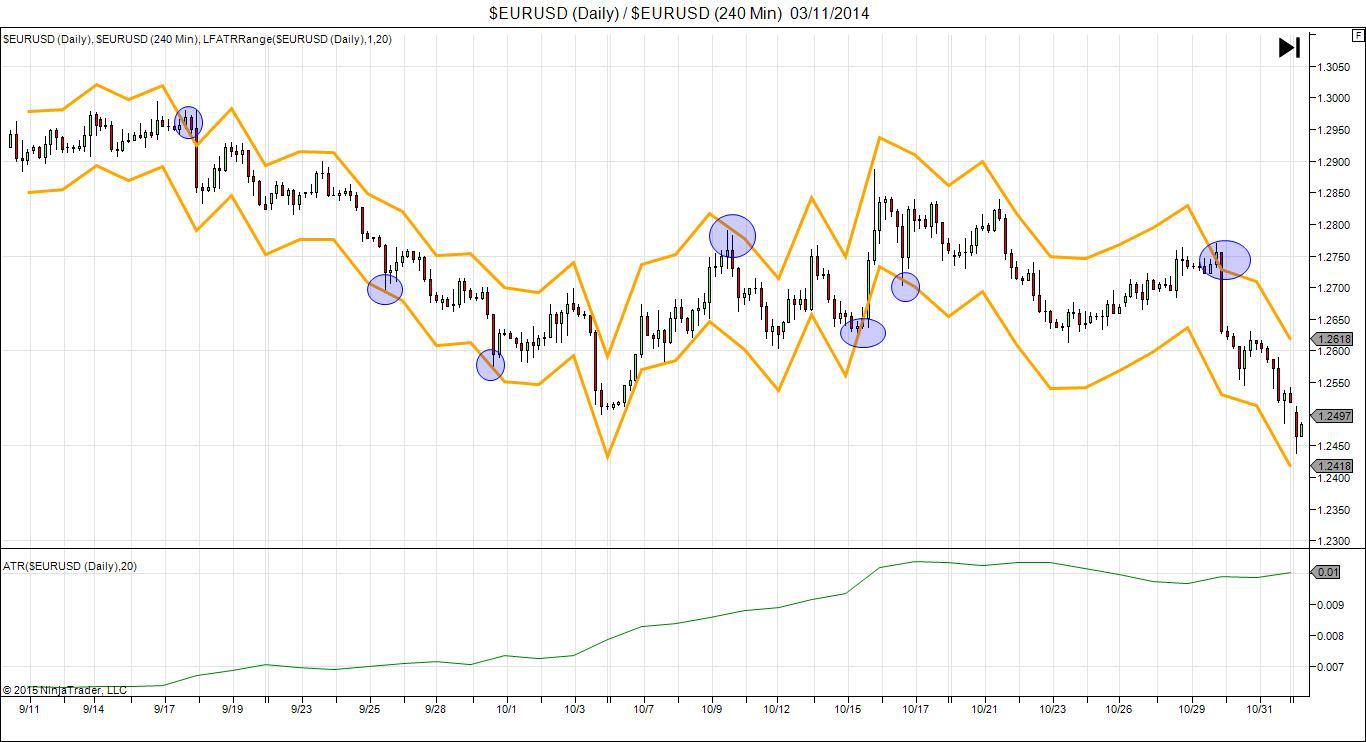
Introducing ATR Boundaries
The key to this chart for today is the orange lines surrounding price; these are my Daily ATR price boundaries created by Adding and Subtracting the Daily ATR over a 20 period from the previous days Close price.
I use these ATR Boundaries to give me clues to potential reversal areas, price breaching these lines is likely to pull back to find better value; combine these with some order book information and you have a really simple but extremely powerful strategy for trading 4hr charts.
A really simple strategy that works nicely is to look for pin bars at a test of the ATR boundaries.
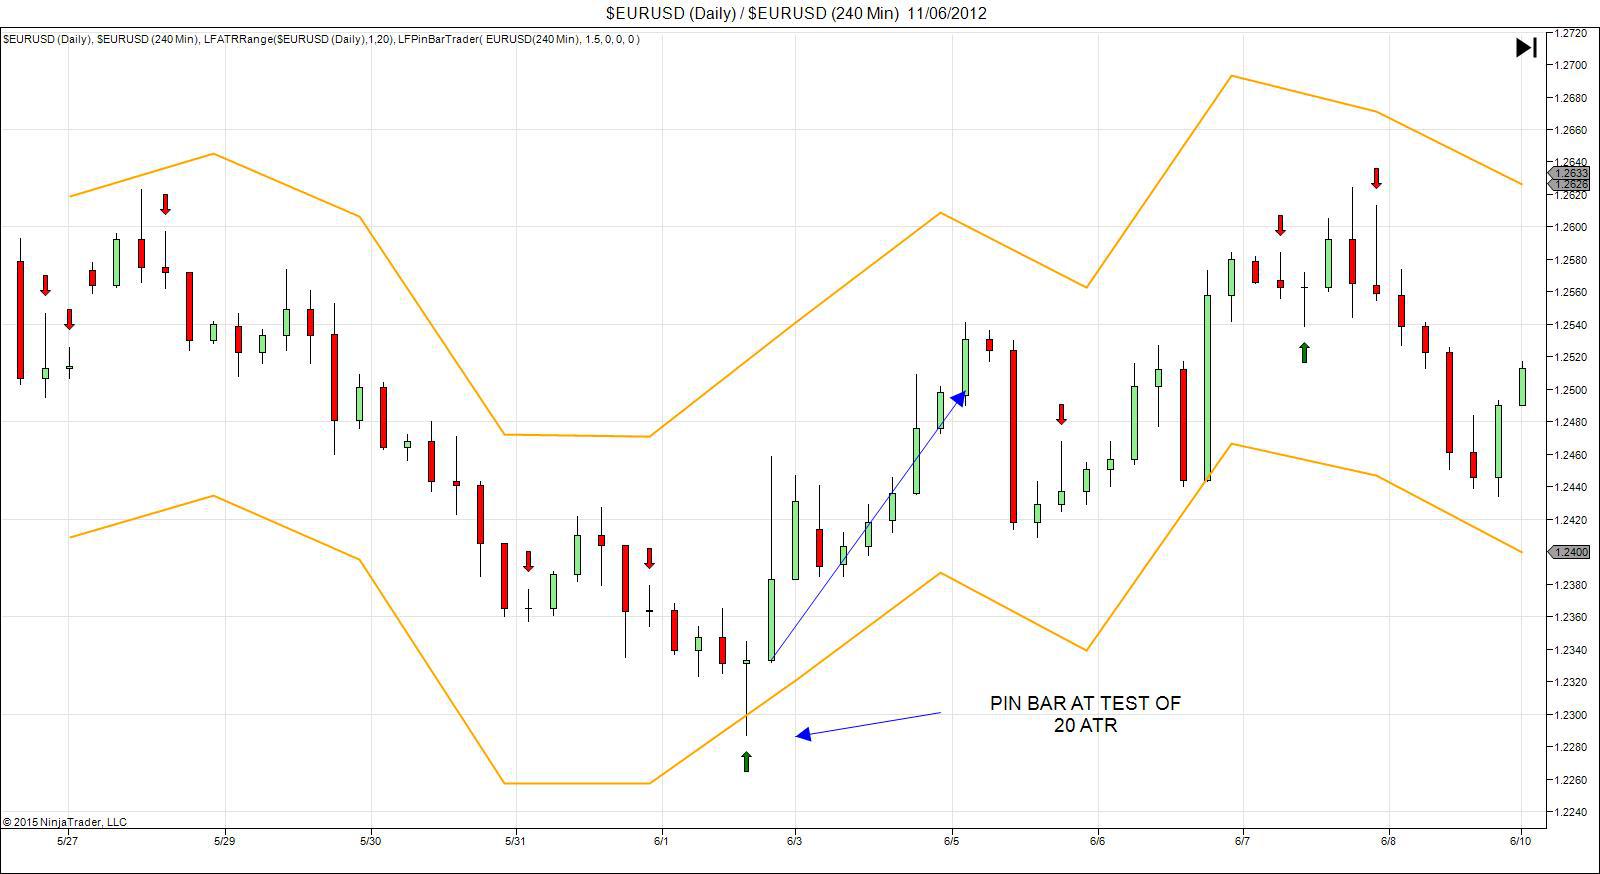
On the chart above I’ve overlayed the 20 Day ATR on a 4hour chart and loaded up the Pin Bar indicator which automatically highlights pin bars. With nice clear signals this a great swing trading strategy for you to try. Pin Bar indicator will also automatically suggest a stop loss, entry point and target levels on your charts for you so all you have to do is set the orders at those levels.
In fact using these bands along with any traditional indicators, it is possible to quickly get a decent strategy together. A really effective way of using them is to overlay the Daily Order Flow Trader signals onto the H4 chart. We want to see price moving in the direction of the Daily OFT signal and then we wait for pullbacks into the ATR boundary levels to trade for a resumption of the trend, as seen below .
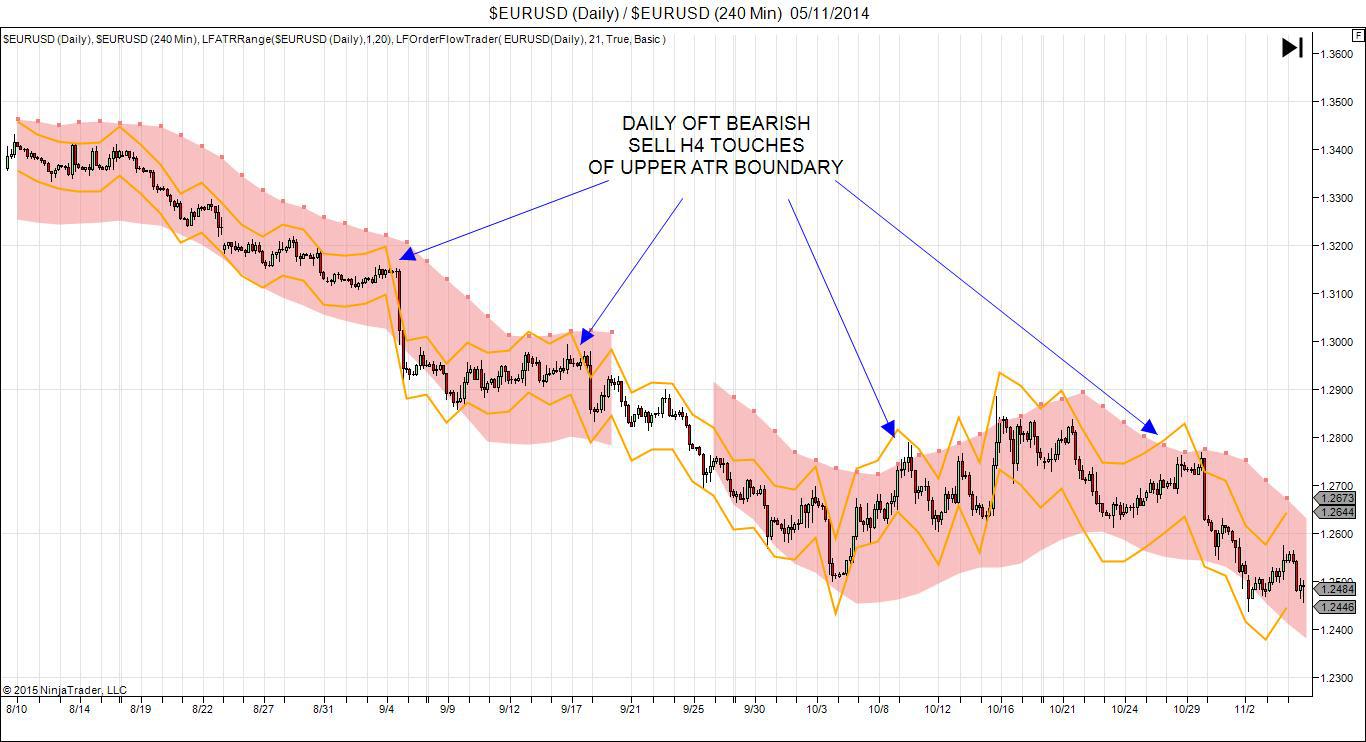
The red band around price comes from the Daily OFT signal which is showing volume flowing into a bearish trend so as we see price pullback into the upper boundary we can fade the move with a low risk trade looking for price to continue lower.
This market forecast is for general information only. It is not an investment advice or a solution to buy or sell securities.
Authors' opinions do not represent the ones of Orbex and its associates. Terms and Conditions and the Privacy Policy apply.
Trading foreign exchange on margin carries a high level of risk, and may not be suitable for all investors. Before deciding to trade foreign exchange, you should carefully consider your investment objectives, level of experience, and risk appetite. There is a possibility that you may sustain a loss of some or all of your investment and therefore you should not invest money that you cannot afford to lose. You should be aware of all the risks associated with foreign exchange trading, and seek advice from an independent financial advisor if you have any doubts.
Editors’ Picks

EUR/USD looks offered below 1.1900
EUR/USD keeps its bearish tone unchanged ahead of the opening bell in Asia, returning to the sub-1.1900 region following a firmer tone in the US Dollar. Indeed, the pair reverses two consecutive daily gains amid steady caution ahead of Wednesday’s key US Nonfarm Payrolls release.

GBP/USD slips back to daily lows near 1.3640
GBP/USD drops to daily lows near 1.3640 as sellers push harder and the Greenback extends its rebound in the latter part of Tuesday’s session. Looking ahead, the combination of key US releases, including NFP and CPI, alongside important UK data, should keep the pound firmly in focus over the coming days.

USD/JPY drops toward 155.00 as focus shifts to US data
USD/JPY meets fresh supply and inches closer toward 155.00 in the Asian session on Tuesday. The Japanese Yen holds the upper hand over the US Dollar after Japanese Prime Minister Sanae Takaichi led the ruling Liberal Democratic Party to a historic landslide win and on intervention talks. Traders brace for key US economic data that could offer more clues on the Federal Reserve's monetary policy.
Editors’ Picks

AUD/USD meets initial resistance around 0.7100
A decent rebound in the US Dollar is behind the AUD/USD’s daily pullback on Tuesday. In fact, the pair comes under modest downside pressure soon after hitting fresh yearly peaks in levels just shy of 0.7100 the figure on Monday. Moving forward, investors are expected to closely follow the release of Chinese inflation data on Wednesday.
EUR/USD looks offered below 1.1900
EUR/USD keeps its bearish tone unchanged ahead of the opening bell in Asia, returning to the sub-1.1900 region following a firmer tone in the US Dollar. Indeed, the pair reverses two consecutive daily gains amid steady caution ahead of Wednesday’s key US Nonfarm Payrolls release.

Gold the battle of wills continues with bulls not ready to give up
Gold remains on the defensive and approaches the key $5,000 region per troy ounce on Tuesday, giving back part of its recent two day. The precious metal’s pullback unfolds against a firmer tone in the US Dollar, declining US Treasury yields and steady caution ahead of upcoming key US data releases.

Bitcoin's downtrend caused by ETF redemptions and AI rotation: Wintermute
Bitcoin's (BTC) fall from grace since the October 10 leverage flush has been spearheaded by sustained ETF outflows and a rotation into the AI narrative, according to Wintermute.

Dollar drops and stocks rally: The week of reckoning for US economic data
Following a sizeable move lower in US technology Stocks last week, we have witnessed a meaningful recovery unfold. The USD Index is in a concerning position; the monthly price continues to hold the south channel support.
RECOMMENDED LESSONS
Making money in forex is easy if you know how the bankers trade!
I’m often mystified in my educational forex articles why so many traders struggle to make consistent money out of forex trading. The answer has more to do with what they don’t know than what they do know. After working in investment banks for 20 years many of which were as a Chief trader its second knowledge how to extract cash out of the market.
5 Forex News Events You Need To Know
In the fast moving world of currency markets where huge moves can seemingly come from nowhere, it is extremely important for new traders to learn about the various economic indicators and forex news events and releases that shape the markets. Indeed, quickly getting a handle on which data to look out for, what it means, and how to trade it can see new traders quickly become far more profitable and sets up the road to long term success.
Top 10 Chart Patterns Every Trader Should Know
Chart patterns are one of the most effective trading tools for a trader. They are pure price-action, and form on the basis of underlying buying and selling pressure. Chart patterns have a proven track-record, and traders use them to identify continuation or reversal signals, to open positions and identify price targets.
7 Ways to Avoid Forex Scams
The forex industry is recently seeing more and more scams. Here are 7 ways to avoid losing your money in such scams: Forex scams are becoming frequent. Michael Greenberg reports on luxurious expenses, including a submarine bought from the money taken from forex traders. Here’s another report of a forex fraud. So, how can we avoid falling in such forex scams?
What Are the 10 Fatal Mistakes Traders Make
Trading is exciting. Trading is hard. Trading is extremely hard. Some say that it takes more than 10,000 hours to master. Others believe that trading is the way to quick riches. They might be both wrong. What is important to know that no matter how experienced you are, mistakes will be part of the trading process.
The challenge: Timing the market and trader psychology
Successful trading often comes down to timing – entering and exiting trades at the right moments. Yet timing the market is notoriously difficult, largely because human psychology can derail even the best plans. Two powerful emotions in particular – fear and greed – tend to drive trading decisions off course.