5 Practical Tips To Find And Realize A Good Trade

There is an old adage among traders: “you don’t need to search for a good trade, the good trade should come to you”. And that’s true considering that traders usually lack patience and can’t wait for the good setup to appear. But, you still need to know what to pay attention to. In other words, you should know what trading instruments will likely provide good opportunities in the nearest future. In this article, I will summarize a top-down analytical preparation process, which would help you find a good trade for today.
Step 1. Highlight performance leaders for the last 5 days
You can use various screeners for that purpose, there’s no need to go through charts manually. The one that I use now, for example, builds a distribution graph, which helps me very quickly visualize the best and worst performing currency pairs for the previous week:
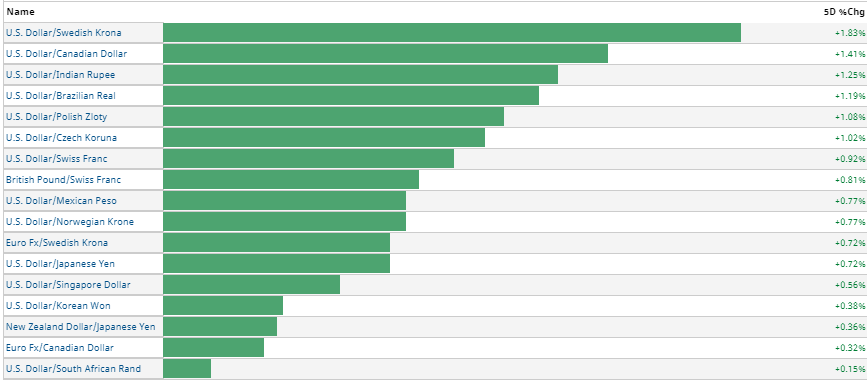
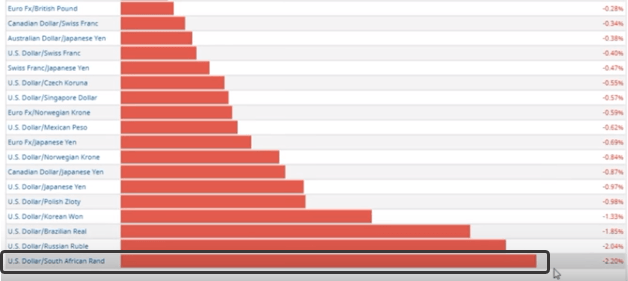
I highlight those, which showed more than 2% of grown or decline: thus, I may find a candidate for a good trend-following trade. The odds that 2%+ growth would occur overnight is relatively small, that’s why I monitor the 5-day period, which equals to one workweek. For example, when I watched the performance leaders table this Monday (February 19, 2018), there were no leaders either for decline or for growth among major currencies (for 5-day period), but there have been couple of interesting situations on emerging markets, for example, USDZAR which was showing more than 2% growth against the US dollar - a pretty notable growth for the currency, even not a major one.
Step 2. Historical volatility
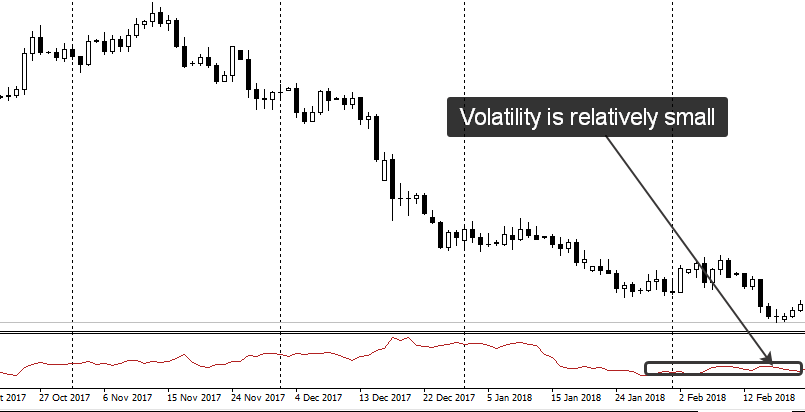
The next step, which I take, is not making a technical analysis as one might think. I examine the historical volatility. For that purpose, I use famous “Average True Range” indicator on the daily chart. In a nutshell, it shows me an actual “level of fear”. Big money doesn’t like big volatility: best opportunities are usually associated with the small daily volatility. Of course, now I’m talking not about day trading, it’s more an approach for swing or position trading. When I’m talking about “best opportunities”, I mean that I’d like to see price moving smoothly, without much intraday noise, day by day to a target. Such kind of market gives a trader some feeling of comfort: when you are not being wiped out of your position and keep it securely to the target, you have greater odds for not only survival but also success in a long run. On the picture below, you see that volatility (ATR) for USDZAR was relatively small for the moment. What does it mean in a practical sense? When I see such kind of situation, I admit that there’s not only a trend in place but also a strong trend - the one that hasn’t finished yet. Young trends are usually combined with small volatility. That’s what we need, a young trend - we don’t want to be trapped in mature or outdated trend. Following the logic above, I proceed to the next step.
Step 3. Trade location
On the third step, I want to know whether the price had already hit some important long-term extremums or not. In a latter case, it has the potential to proceed to move in the chosen direction. In the case with USDZAR, I’ve seen that the long-term extremum was not achieved yet, so the price had the potential to proceed to move in the direction of a trend, at least for a while. Below, I show you the weekly chart to better visualize the relationship between the current price and a long-term level.

Step 4. Entry point
When you finally found a potentially good opportunity, it’s time to find an entry point. It’s not enough to do the analysis: we should always keep in mind that market may behave very differently than we anticipated. It’s trading and we are dealing with probabilities and odds. So, we should find a point, where the risk is small. That’s why many traders switch to smaller time frames to pick the right moment for jumping in the market. The intraday time frame, which I use is M30. It may be H1 or M15, it doesn’t matter: the key is to find something that works for you. When you work against the correctional trend in the direction of the main trend, the best way to go is to use false breakouts. Once the price breaks the short-term trading range in the direction opposite to the main trend, a trader should monitor this move for continuation. In case, the continuation doesn’t happen, the opportunity unfolds: it’s a signal to go against the move in the way which is shown in the picture below.
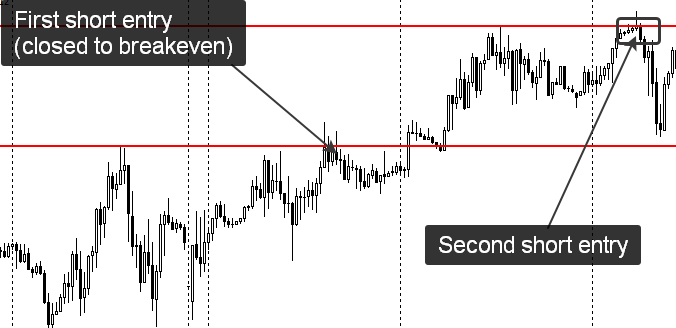
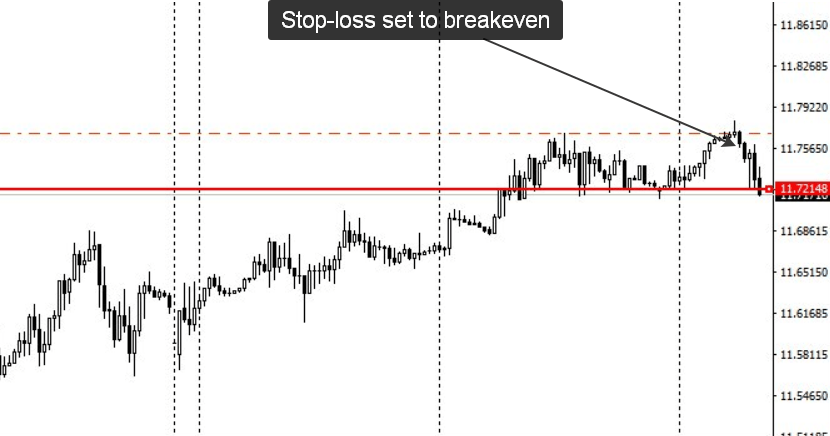
The key is to manage risks very carefully. In case a trade gives any profit, it may be protected with a stop-loss set to breakeven. In the mentioned example, the second entry worked well. I’ve protected this trade once the move developed into a notable swing:
Step 5. Position management and exit
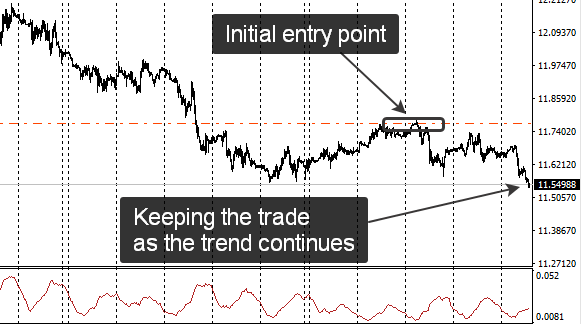
The next step is the most difficult and tricky: how to exit a trade with an adequate target. This topic deserves a separate article (if not a book). I would briefly say that the suggested exiting strategy should be defined before you enter a trade. The exiting point would depend on the type of a trade you want to make. For a short-term trade, or even a day trade the target may be pretty close, but for the trend-following trade, which I was showing you so far, a target may not be defined before. There’s an old adage for trend-following traders, which claims: “Manage risk and let the market do the rest of the job”. That’s exactly what I do: I just keep the position until I see the culmination. Will the trade work? We don’t know that yet, but we can manage what we can manage. Future is beyond our control, so we may go and do something else, letting the trade work.
See you in the next articles! Good luck and trade responsibly!
Author

Stanislav Bernuhov
Common Sense Trading
I'm an individual trader since 2004 and a trading coach since 2010.


