- Zilliqa price broke out of a bullish pennant formation and is on track to hit its target at $0.21.
- Momentum Reversal Indicator’s (MRI) breakout line at $0.19 has stopped ZIL's run-up.
- The bull rally could reverse if the $0.15 level is breached, as it would create a lower low.
Zilliqa price has seen an excellent run-up since its breakout, but now the rally could reverse if demand barriers fail.
Zilliqa price eyes a higher high
Zilliqa price rose 165% between mid-January and February, creating a flag pole. However, after this initial spike, ZIL developed a “pennant” as it formed lower highs and higher lows. Together, the setup is known as a bullish pennant.
The technical formation forecasted a 62% upswing to $0.21, determined by measuring the flag pole’s height and adding it to the breakout point at $0.13.
Since its breakout on March 11, Zilliqa price has rallied 50% and needs another spike in bullish momentum to complete its last leg up.
However, the breakout line at $0.19 has proven to be a stiff barrier that has prevented ZIL from crossing over. If buyers manage to gather steam that could shatter this supply barrier, Zilliqa price will complete its 62% rally and hit its intended target.
Supporting this outlook is the persistence of the recently flashed “buy signal” from the SuperTrend indicator. Hence, the likely course of action for ZIL is to slice through the MRI’s breakout line after a minor retracement to $0.16.
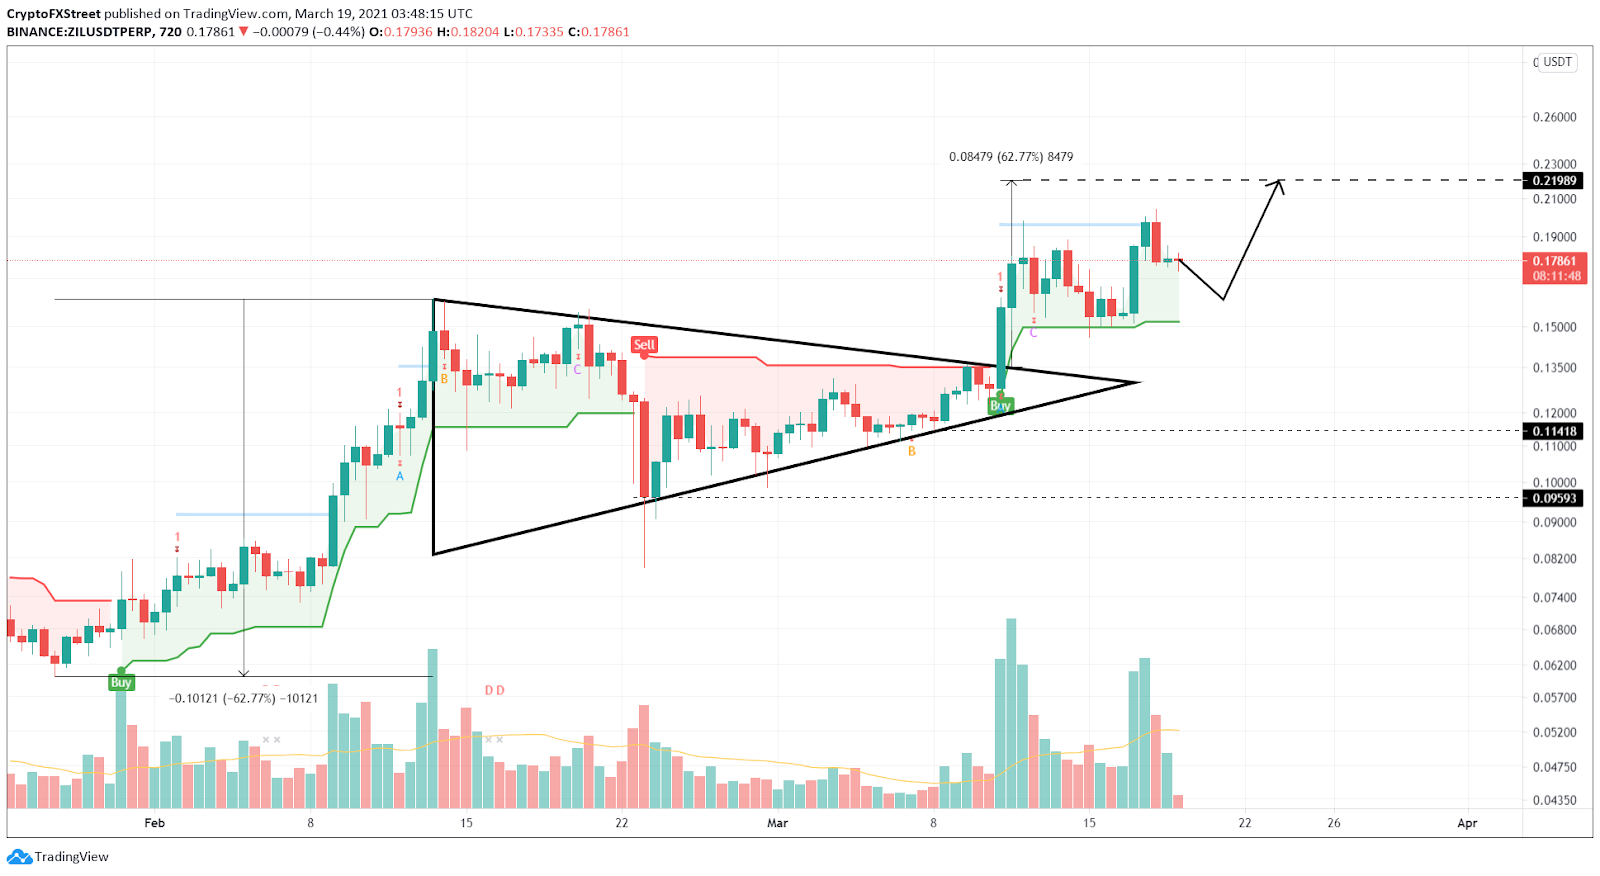
ZIL/USDT 12-hour chart
While things seem to be evolving when it comes to Zilliqa price, investors should note that a breakdown of the $0.15 level will create a lower low. In such a case, a 25% downtrend to the demand barrier at $0.11 seems likely.
A build-up in bearish momentum here might see ZIL retrace to $0.095.
Information on these pages contains forward-looking statements that involve risks and uncertainties. Markets and instruments profiled on this page are for informational purposes only and should not in any way come across as a recommendation to buy or sell in these assets. You should do your own thorough research before making any investment decisions. FXStreet does not in any way guarantee that this information is free from mistakes, errors, or material misstatements. It also does not guarantee that this information is of a timely nature. Investing in Open Markets involves a great deal of risk, including the loss of all or a portion of your investment, as well as emotional distress. All risks, losses and costs associated with investing, including total loss of principal, are your responsibility. The views and opinions expressed in this article are those of the authors and do not necessarily reflect the official policy or position of FXStreet nor its advertisers. The author will not be held responsible for information that is found at the end of links posted on this page.
If not otherwise explicitly mentioned in the body of the article, at the time of writing, the author has no position in any stock mentioned in this article and no business relationship with any company mentioned. The author has not received compensation for writing this article, other than from FXStreet.
FXStreet and the author do not provide personalized recommendations. The author makes no representations as to the accuracy, completeness, or suitability of this information. FXStreet and the author will not be liable for any errors, omissions or any losses, injuries or damages arising from this information and its display or use. Errors and omissions excepted.
The author and FXStreet are not registered investment advisors and nothing in this article is intended to be investment advice.
Recommended Content
Editors’ Picks

Cardano Price Forecast: ADA set for 20% rally as bullish bets increase
Cardano (ADA) price extends its rally on Monday after gaining more than 13% last week. On-chain metrics suggest a bullish picture as ADA’s long-to-short ratio reached the highest level in over a month.

Top 3 Price Prediction Bitcoin, Ethereum, Ripple: BTC, ETH hold steady while XRP gains momentum
Bitcoin (BTC) has been consolidating between $94,000 and $100,000 for almost two weeks. Ethereum (ETH) price follows in BTC’s footsteps and hovers around $2,680, while Ripple (XRP) shows strength and extends its gains on Monday after rallying 14% last week.

Bitcoin (BTC) vs Gold (XAU): Asset Tokenization expert weighs impact of US Inflation on 2025 price trends
Bitcoin price consolidated at $97,000 on Feb 15, down 6% within the monthly time frame, reeling under bearish headwinds from US tariff wars and rising inflation.

Dogecoin (DOGE) Price mirrors XRP rally as SEC acknowledges Grayscale ETF Filings
Dogecoin price surged 3% on Friday, extending its weekly timeframe gains to 17% as ETF speculation gains traction.

Bitcoin: BTC consolidates before a big move
Bitcoin price has been consolidating between $94,000 and $100,000 for the last ten days. US Bitcoin spot ETF data recorded a total net outflow of $650.80 million until Thursday.

The Best Brokers of the Year
SPONSORED Explore top-quality choices worldwide and locally. Compare key features like spreads, leverage, and platforms. Find the right broker for your needs, whether trading CFDs, Forex pairs like EUR/USD, or commodities like Gold.