|

Zilliqa Price Prediction: ZIL could slip even lower after key pattern breaks bearish

  • Zilliqa price confirmed a double top pattern on the 4-hour chart.
  • The digital asset broke the support neckline and had a 24% sell-off.
  • The previous support is now acting as a strong resistance level.

Zilliqa price had a massive rally towards $0.161 on February 13 and topped out at $0.157 on February 20, forming a potential double top. This pattern was confirmed on February 23 after the bears broke the support neckline at $0.12 and had a ton of follow-through down to $0.09. 

Zilliqa price faces significant rejection from key resistance level

The previous support neckline of a double top pattern will usually become a strong resistance point on the way up. Zilliqa price just got rejected from $0.121 and bear can see a lot of continuation.

zil price

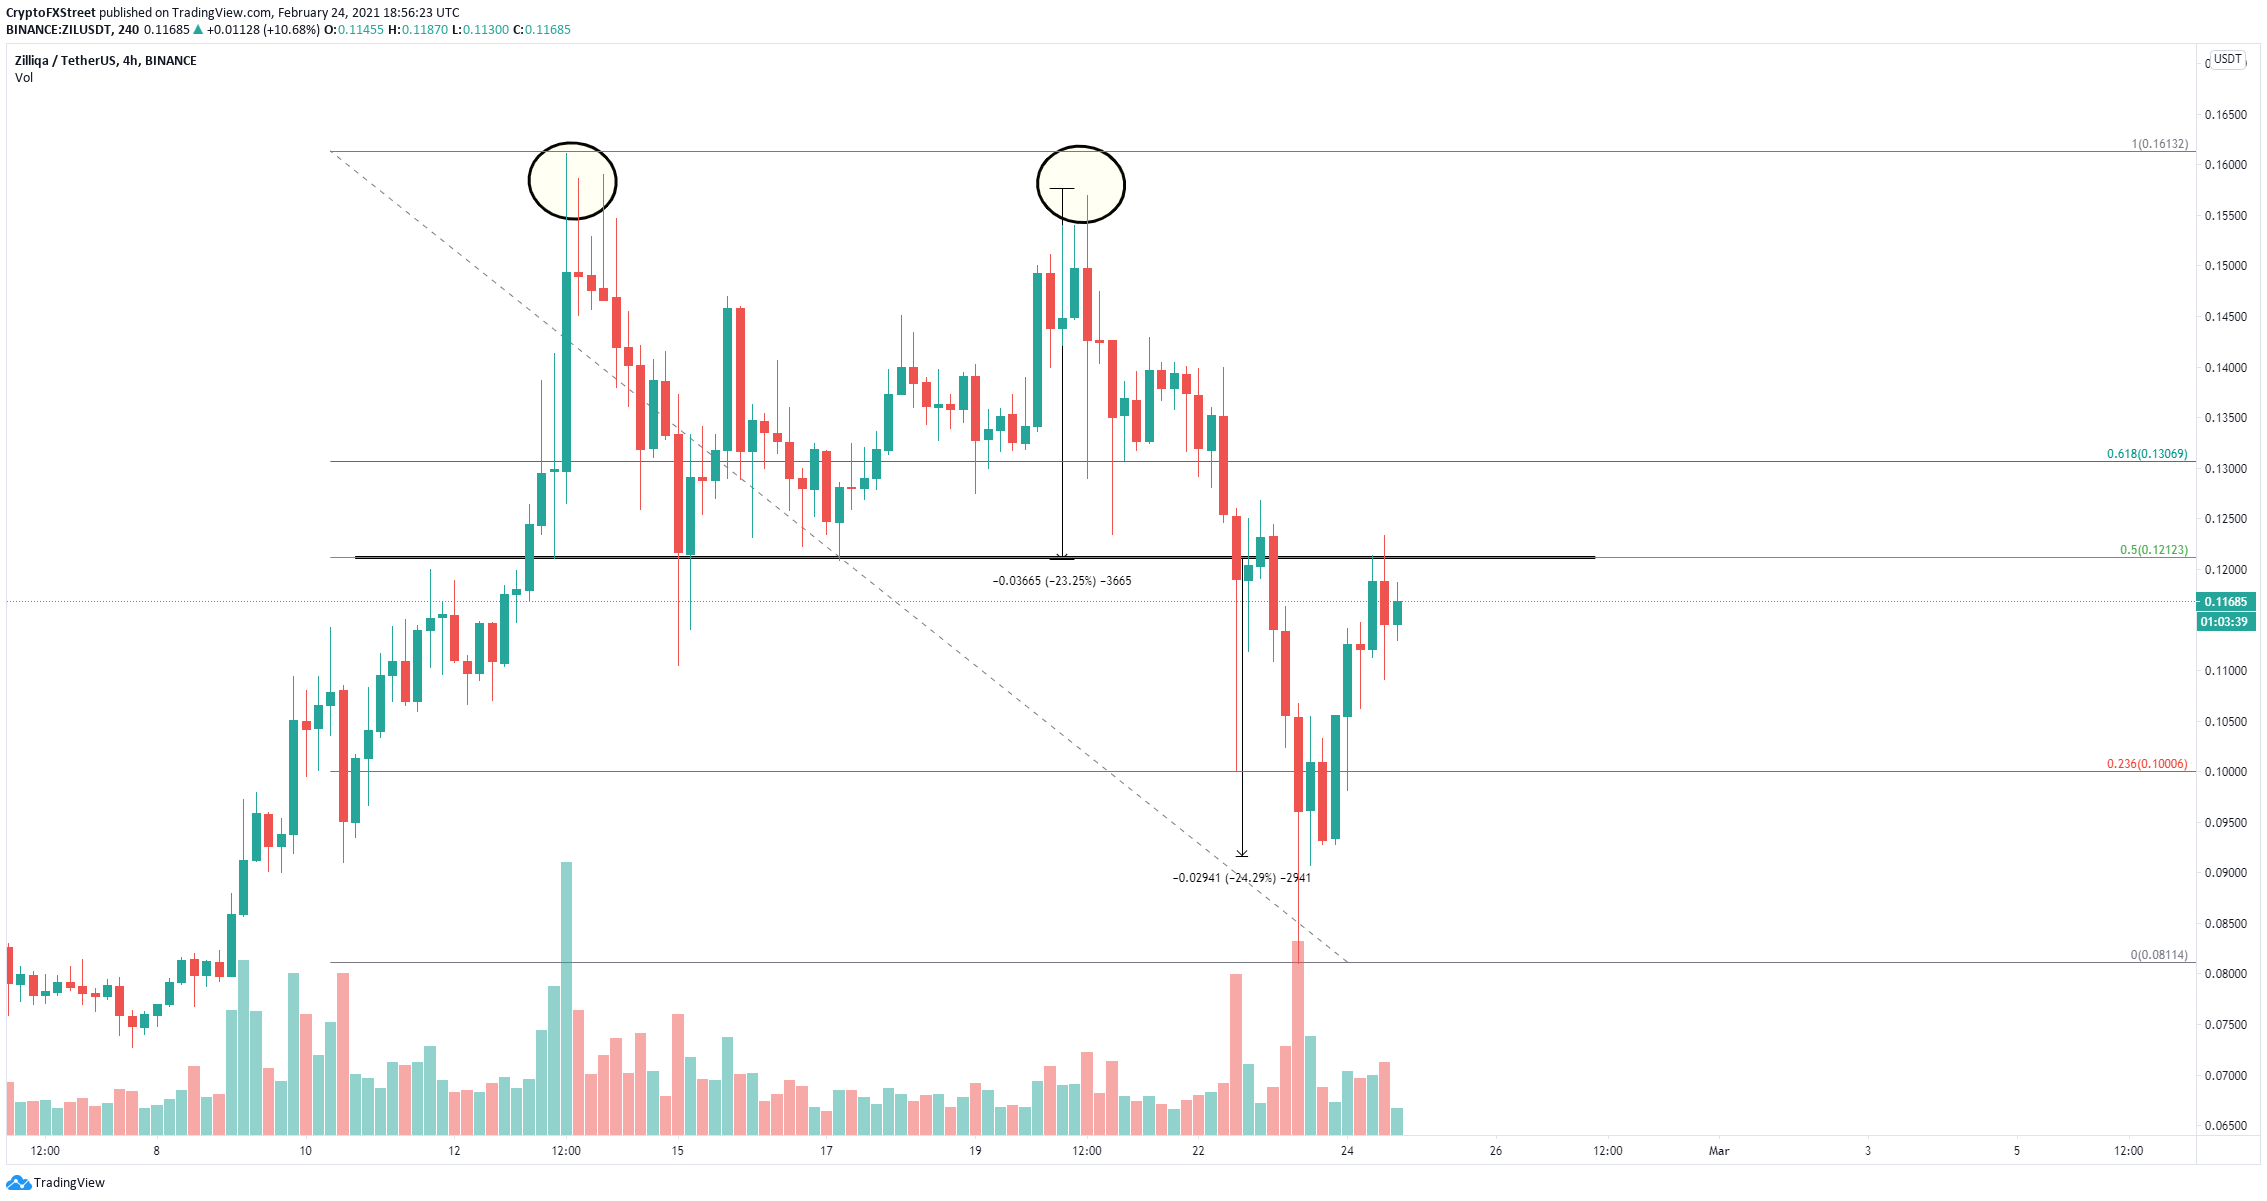
ZIL/USD 4-hour chart

The 50% Fibonacci retracement level perfectly coincides with the key resistance level at $0.121 adding even more credence to the bearish outlook. The next potential bearish target is down at $0.10 and eventually the previous low of $0.08.

To invalidate the bearish outlook, ZIL bulls must climb above $0.121 and see a candlestick close on the 4-hour chart. The next barrier is located at $0.13, which is the 61.8% Fibonacci level before a jump towards $0.16. 

Author

Lorenzo Stroe

Lorenzo Stroe

Independent Analyst

Lorenzo is an experienced Technical Analyst and Content Writer who has been working in the cryptocurrency industry since 2012. He also has a passion for trading.

More from Lorenzo Stroe
Share:

Editor's Picks

Ripple bulls defend key support amid waning retail demand and ETF inflows

XRP ticks up above $1.40 support, but waning retail demand suggests caution. XRP attracts $4 million in spot ETF inflows on Thursday, signaling renewed institutional investor interest.

Crypto Today: Bitcoin, Ethereum, XRP rebound as risk appetite improves

Bitcoin rises marginally, nearing the immediate resistance of $68,000 at the time of writing on Friday. Major altcoins, including Ethereum and Ripple, hold key support levels as bulls aim to maintain marginal intraday gains.

Bitcoin Weekly Forecast: No recovery in sight 

Bitcoin price continues to trade sideways between $65,729 and $71,746, extending its consolidation since February 7. US-spot ETFs record an outflow of $403.90 million through Thursday, pointing to the fifth consecutive week of withdrawals.

Pi Network Price Forecast: PI recovery stalls amid profit-taking

Pi Network tests 50-day EMA support on Friday, after a 5% decline the previous day. PiScan data shows large deposits on CEXs totaling over 4 million PI tokens in the last 24 hours, reflecting an exodus of investors taking profits.

Bitcoin Price Annual Forecast: BTC holds long-term bullish structure heading into 2026

Bitcoin (BTC) is wrapping up 2025 as one of its most eventful years, defined by unprecedented institutional participation, major regulatory developments, and extreme price volatility.

Bitcoin: No recovery in sight

Bitcoin (BTC) price continues to trade within a range-bound zone, hovering around $67,000 at the time of writing on Friday, and falling slightly so far this week, with no signs of recovery.