Zilliqa Price Forecast: ZIL is on the verge of a 20% move
- Zilliqa price has closed below stable support provided by Bollinger Band's middle line, suggesting an incoming drop.
- ZIL has also broken out of descending triangle on the 1-hour chart, adding credence to the bearish outlook.
- This sell-off may be mitigated around the $0.107 support level provided by the 200 one-hour MA.

Zilliqa price saw a breakdown of the critical level at $0.125 on the 4-hour chart due to a sudden spike in selling pressure caused by a market-wide correction.
Zilliqa price primed for a lower low
Zilliqa sliced through the $0.125 support barrier provided by the Bollinger Band's middle line triggering the SuperTrend indicator's sell signal. Now, ZIL continues to drop towards the Bollinger Band's lower end, which is the next demand level.
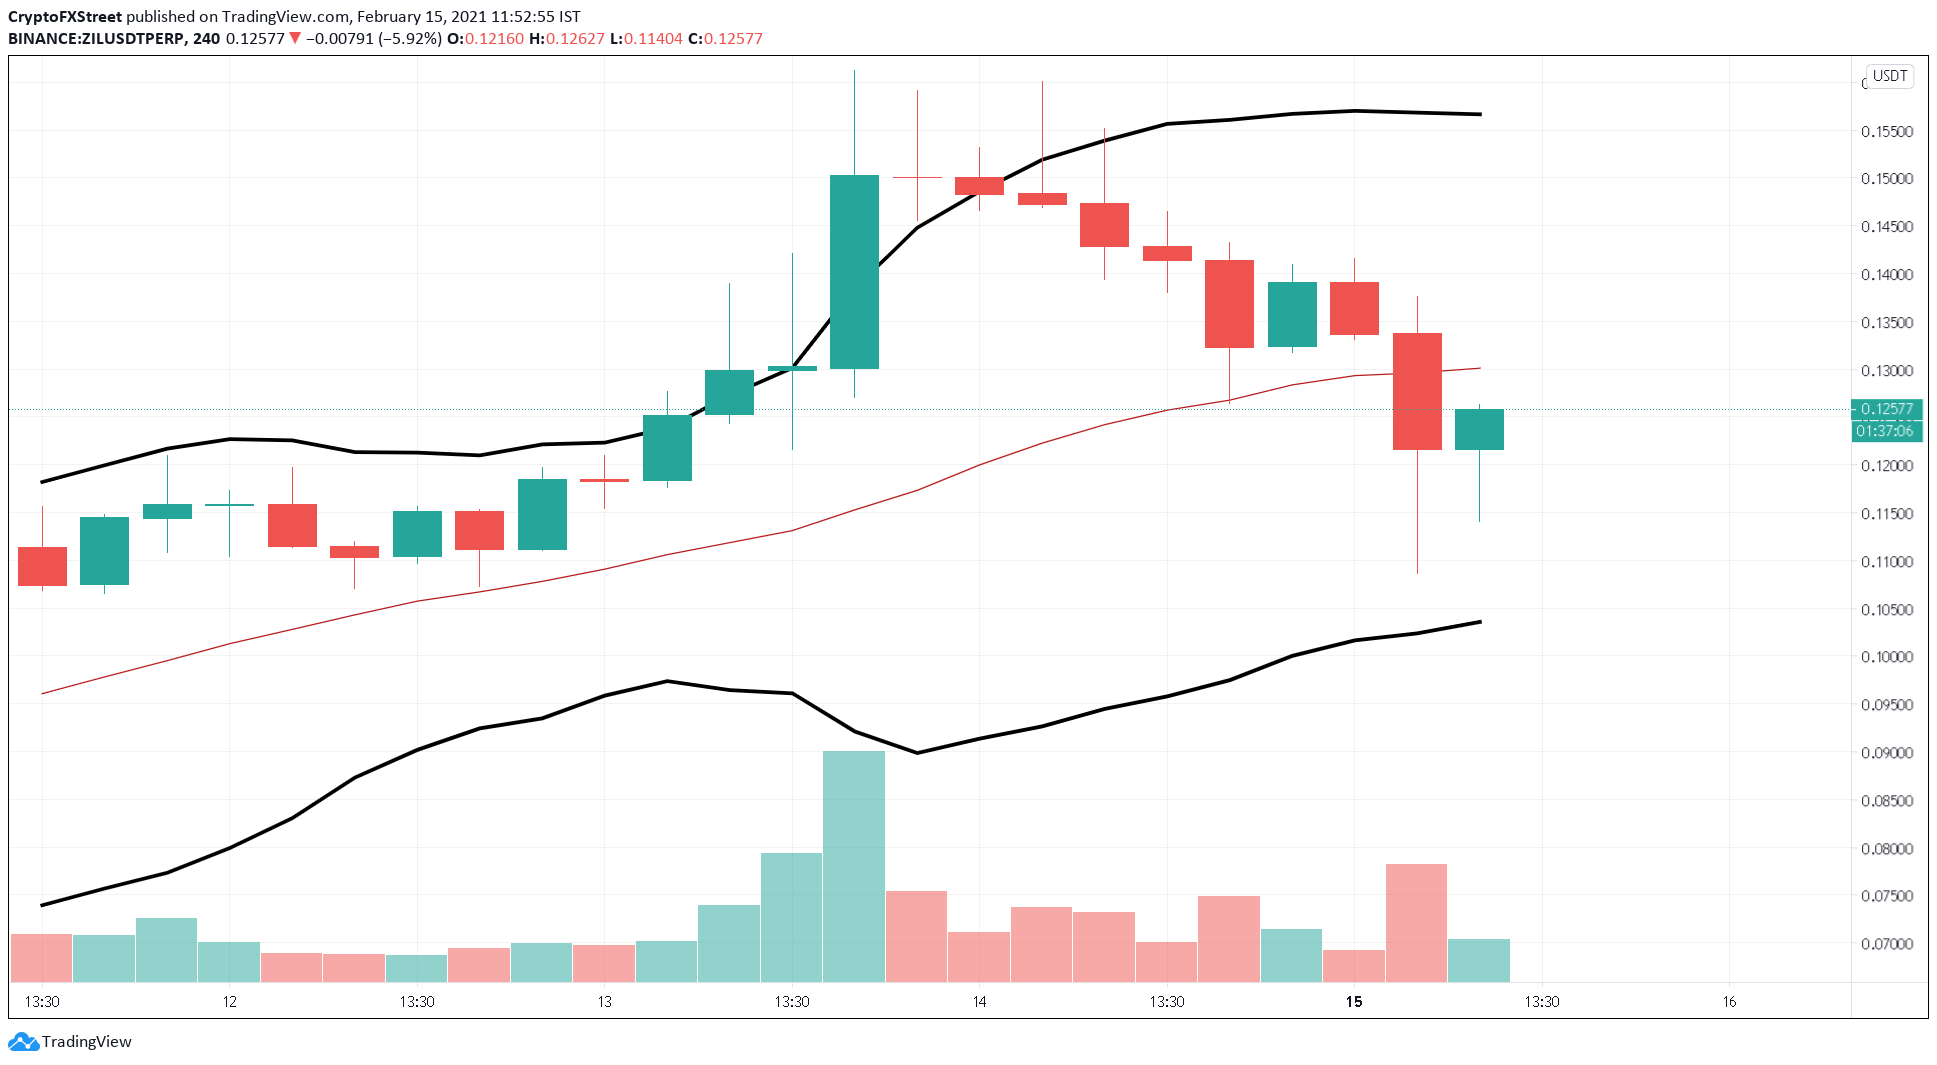
ZIL/USDT 4-hour chart
The 1-hour chart presents an additional bearish outlook for Zilliqa price due to the breach of the 100 one-hour MA. Moreover, a breakout from the descending triangle pattern suggests a 20% drop, which is the distance from the price’s highest point inside the triangle to the flat support.
In this case, ZIL's 20% correction from the pattern's x-axis projects $0.10 as the target.
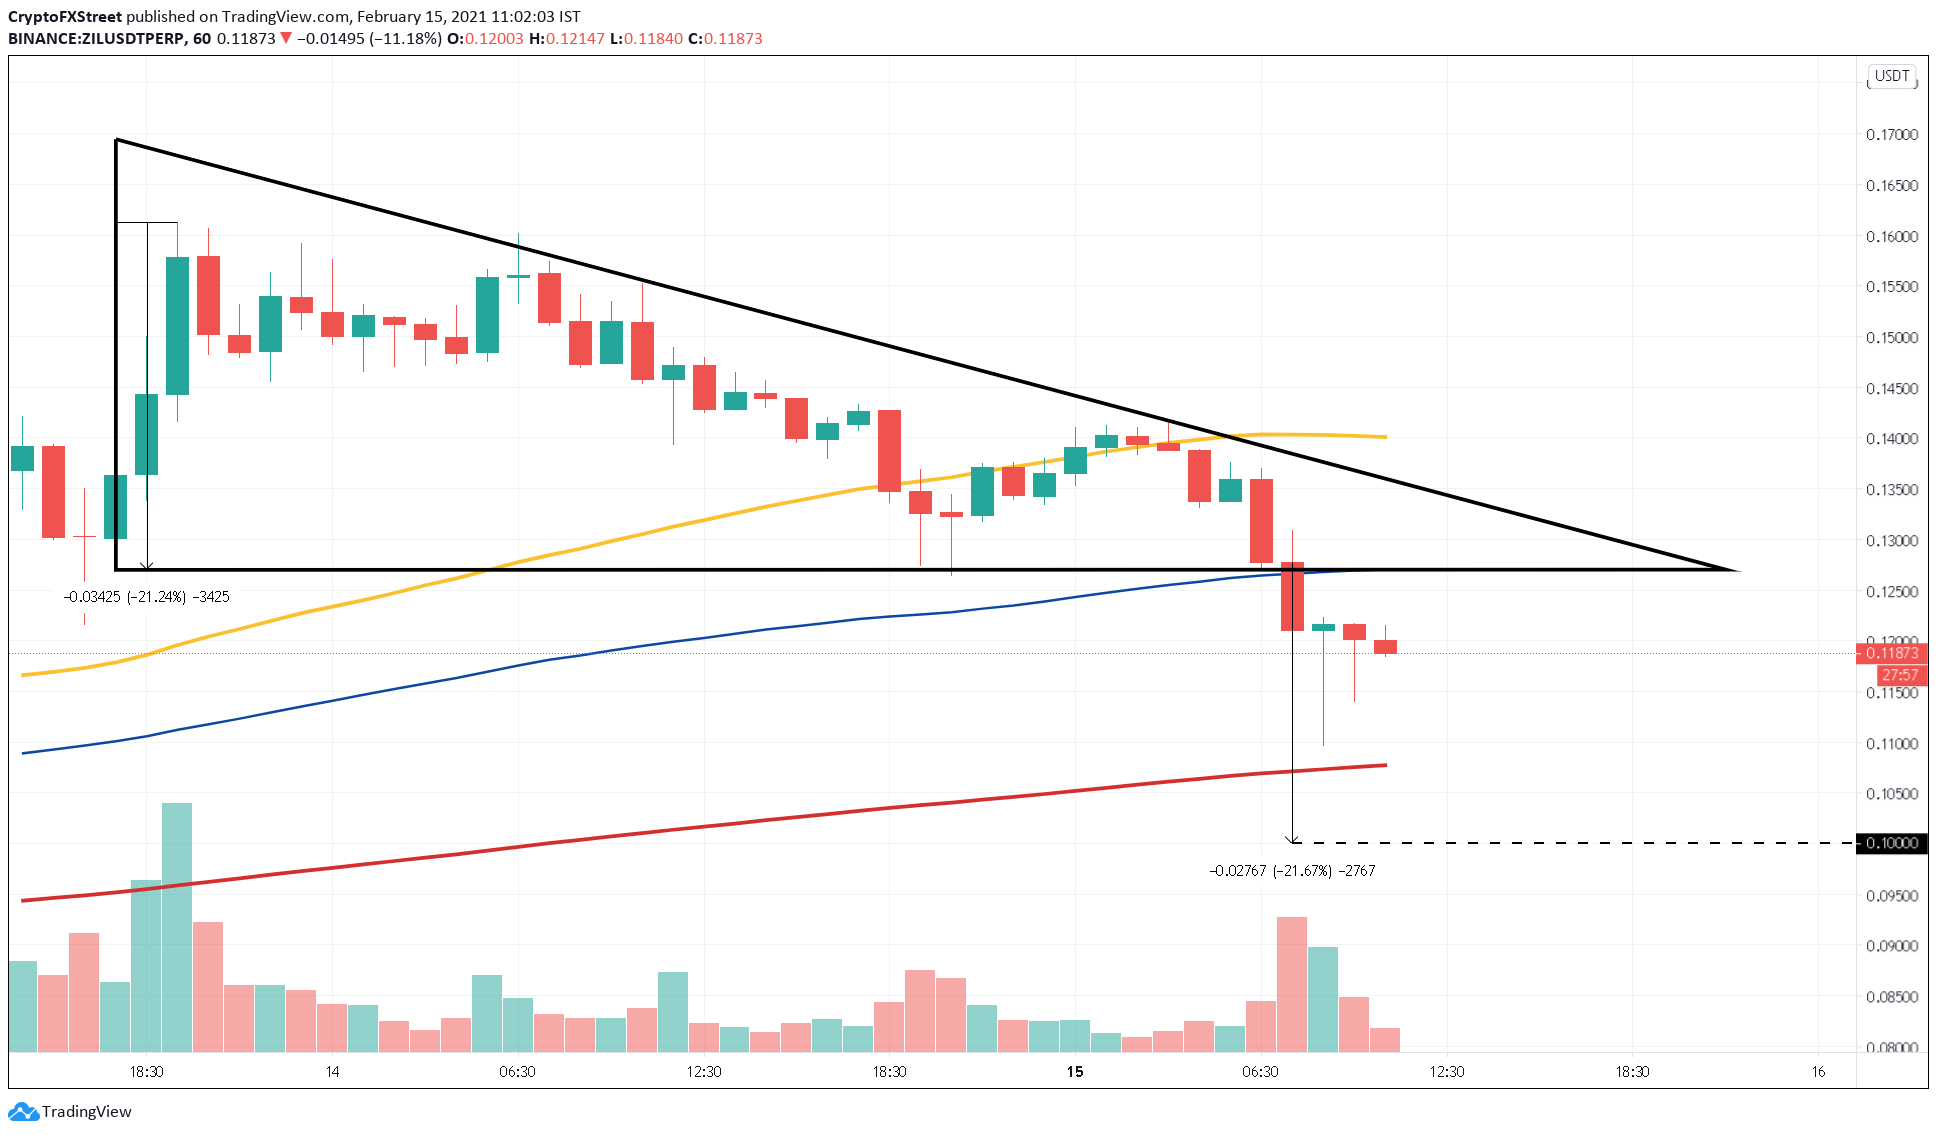
ZIL/USDT 1-hour chart
It is worth noting that the ZIL price correction towards the said target can be mitigated due to the presence of the 200 one-hour MA around the $0.107 level.
Therefore, if buyers continue to accumulate ZIL at $0.107, the resulting spike in buying pressure could push the price higher.
Only a 1-hour candlestick close above the 100 one-hour MA at $0.12, coinciding with the triangle's base, will invalidate Zilliqa's bearish thesis. Subsequent buying pressure projects a retest of the 50 one-hour MA around the $0.14 level.
Author

Akash Girimath
FXStreet
Akash Girimath is a Mechanical Engineer interested in the chaos of the financial markets. Trying to make sense of this convoluted yet fascinating space, he switched his engineering job to become a crypto reporter and analyst.


