Zcash Price Forecast: ZEC bulls eye $750 as Open Interest hits record $1.13 billion
- Zcash price extends its gains on Monday after surging by more than 47% the previous week.
- Derivatives data signals sustained bullish momentum, with Open Interest reaching a new all-time high of $1.13 billion and long positions climbing to a monthly peak.
- The technical analysis supports the bullish case, with ZEC targeting levels above $750.

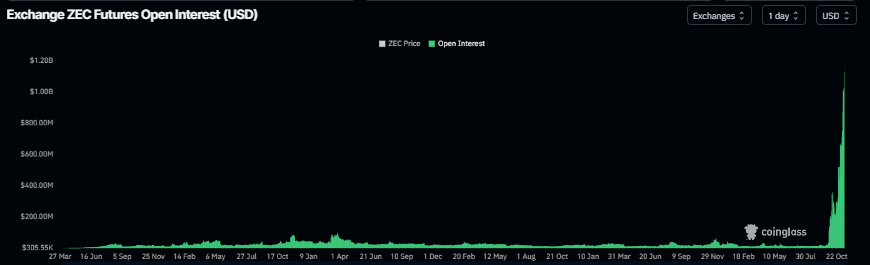
Zcash (ZEC) price continues its strong upward momentum, trading above $680 at the time of writing on Monday, building on last week’s 47% rally. Derivatives market data show growing bullish sentiment, with Open Interest (OI) soaring to a new all-time high of $1.13 billion and long positions hitting a monthly peak. The technical analysis further supports the bullish outlook, with ZEC poised to target levels above $750 if the momentum persists.
Zcash’s derivatives data shows bullish bias
CoinGlass’ data shows that ZEC futures OI at exchanges rose to a new all-time high of $1.13 billion on Monday. Rising OI represents new or additional money entering the market and new buying, which could fuel the current ZEC price rally.
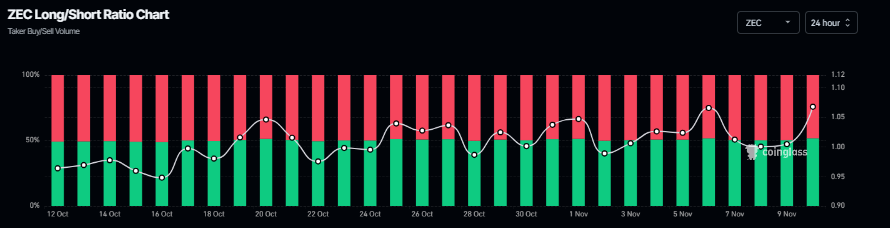
Additionally, the long-to-short ratio for the privacy-focused cryptocurrency stood at 1.06 on Monday, reaching the monthly high. This ratio, above one, reflects bullish sentiment in the markets, as more traders are betting on the ZEC to rally.
Some signs of concern
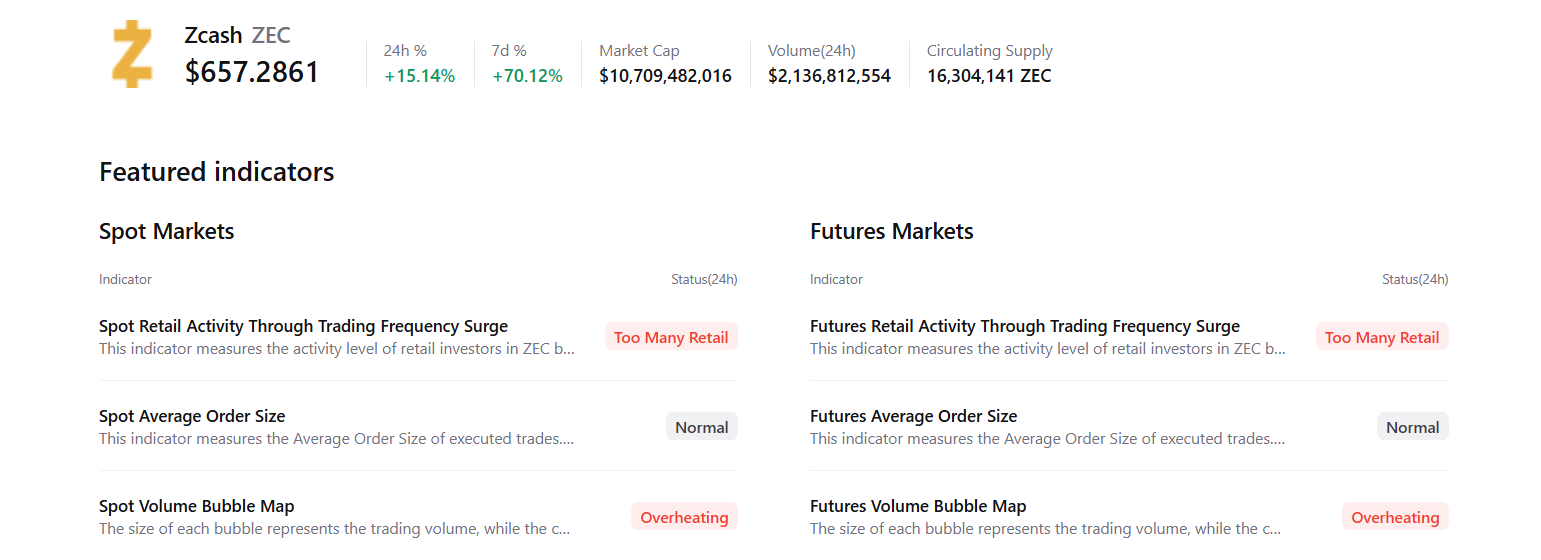
Despite the bullish outlook for ZEC, CryptoQuant’s summary data shows some signs of concern to watch for. Both the spot and futures markets are showing signs of retail activity potentially overheating.
Zcash Price Forecast: ZEC bulls eye $750 mark
Zcash price found support around the 161.8% Fibonacci extension at $578.53 on Sunday, after rallying more than 47%. At the time of writing on Monday, ZEC extends its gains, trading above $680.
If Zcash continues its upward trend, it could extend the rally toward the key psychological level at $750.
The Relative Strength Index (RSI) on the daily chart is 83, above the overbought threshold, indicating strong bullish momentum. Additionally, the Moving Average Convergence Divergence (MACD) showed a bullish crossover that remains intact, with rising green histograms above the neutral level, indicating the continuation of an upward trend.
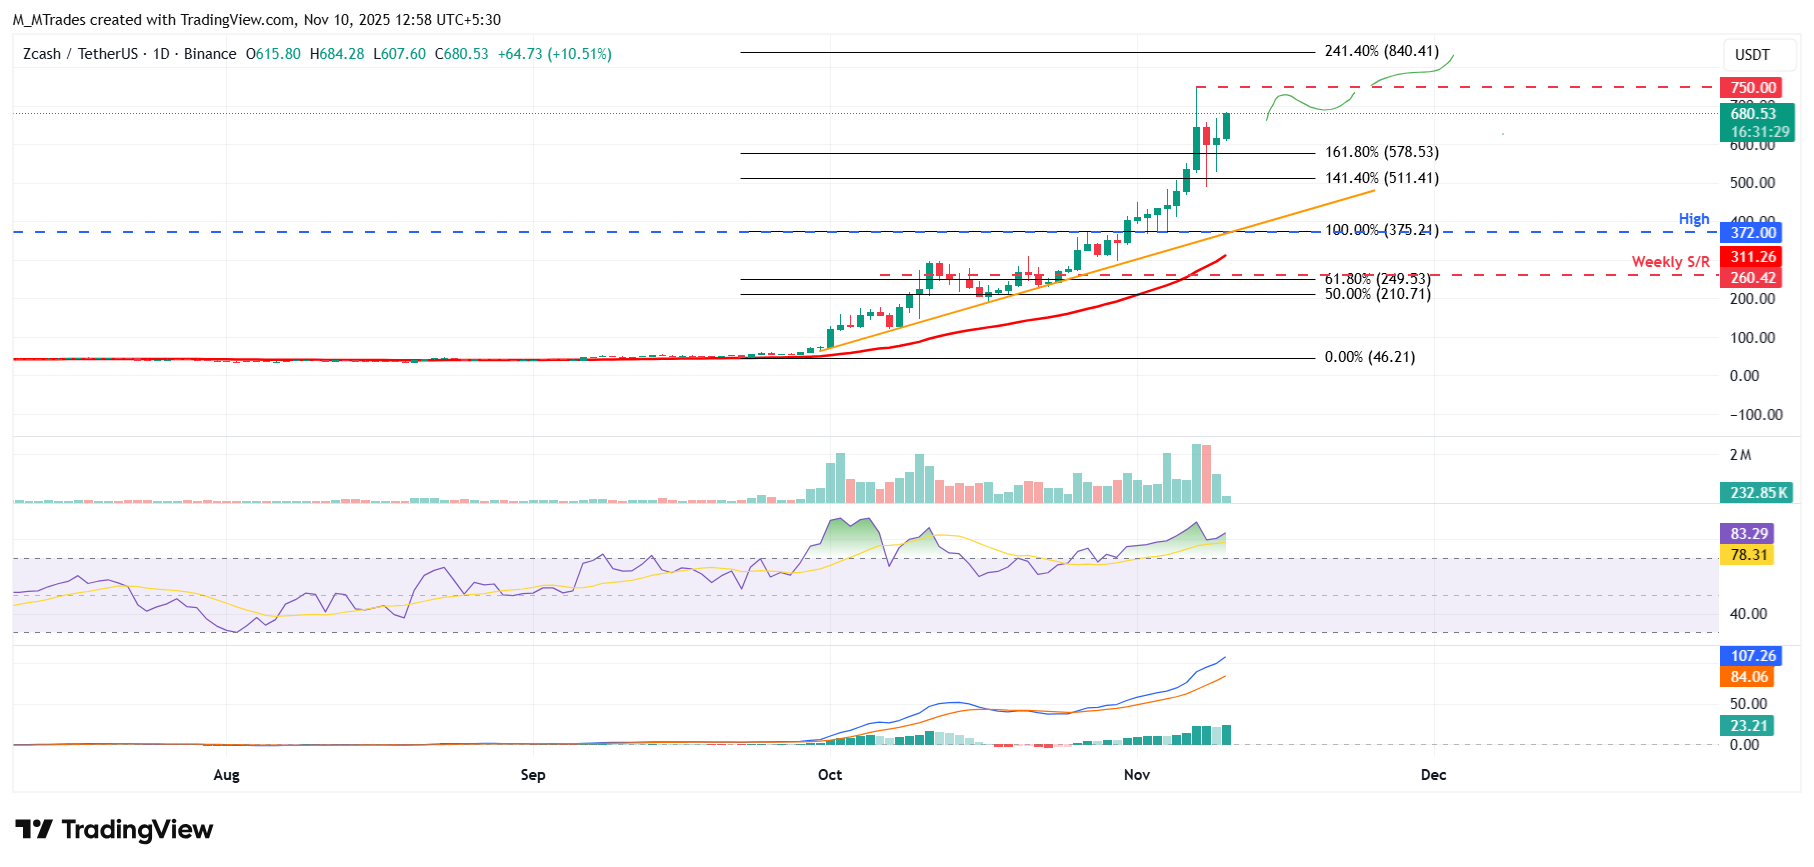
On the other hand, if ZEC faces a correction, it could extend the decline toward the daily support level at $511.41.
Author

Manish Chhetri
FXStreet
Manish Chhetri is a crypto specialist with over four years of experience in the cryptocurrency industry.




