Top 3 Price Prediction: Bitcoin, Ethereum, Ripple – BTC, ETH and XRP face downside risks as breakout attempts falter
- Bitcoin hovers near $87,400 on Wednesday after failing to secure a breakout above the $90,000 resistance.
- Ethereum slips below $3,000 after being rejected at its daily resistance level of $3,017.
- XRP trades around $1.86, edging lower after failing to break through key resistance near $1.96.

Bitcoin (BTC), Ethereum (ETH) and Ripple (XRP) continue to trade in red on Wednesday as recent breakout attempts lose momentum near key resistance levels. BTC failed to reclaim the $90,000, ETH slipped below $3,000, while XRP faced rejection near $1.96. Traders should be cautious as the near-term outlook for the top three cryptocurrencies remains bearish.
Bitcoin faces rejection from the $90,000 mark
Bitcoin price was retested at the psychological level of $90,000 on Monday and declined slightly the following day. At the time of writing on Wednesday, BTC hovers at around $87,400.
If BTC continues its correction, it could extend the decline toward the key support at $85,569.
The Relative Strength Index (RSI) is 42, below its neutral level of 50, indicating that bearish momentum is gaining traction. The Moving Average Convergence Divergence indicator showed a bullish crossover last week; however, the falling green histogram bars indicate fading bullish momentum.
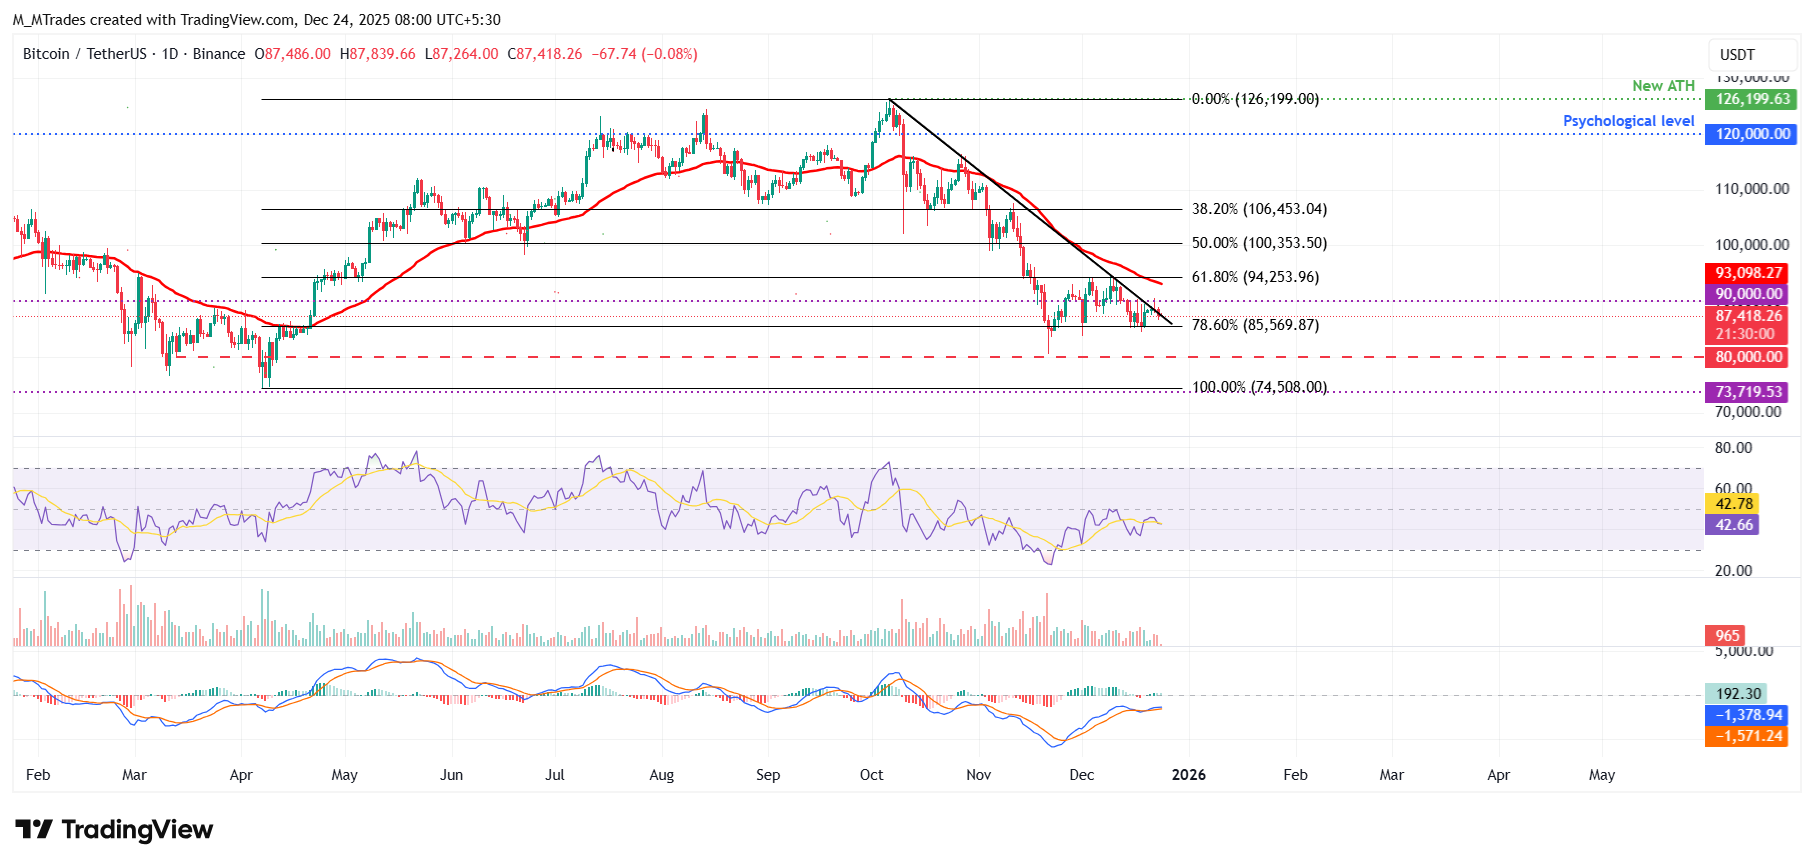
On the other hand, if BTC closes above the $90,000, it could extend the recovery toward the next resistance at $94,253.
Ethereum faces a pullback as it fails to close above key resistance
Ethereum price was rejected from the daily resistance level at $3,017 on Monday and declined 1.48% the next day. As of Wednesday, ETH is trading down at $2,944.
If ETH continues its correction, it could extend the decline toward the key support at $2,749.
The RSI is 44, below its neutral level of 50, indicating that bearish momentum is gaining traction. The MACD lines are also converging, indicating indecision among traders.
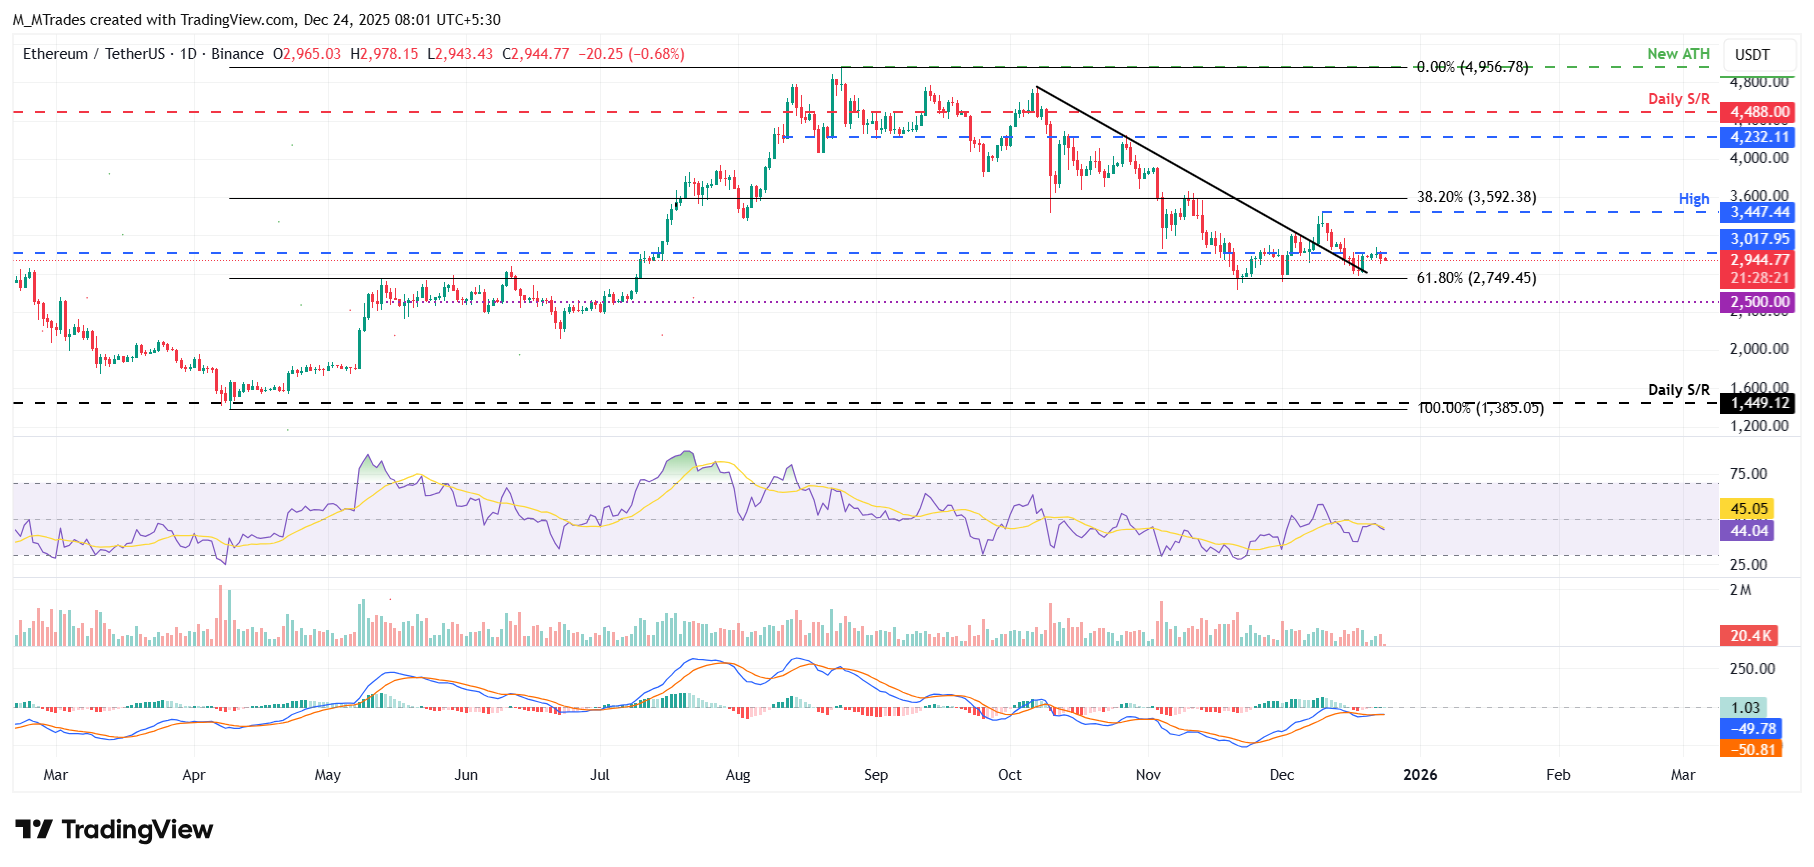
However, if ETH closes above $3,017 on a daily basis, it could extend the recovery toward the December 10 high at $3,447.
XRP bears are in control of the momentum
XRP was retested and rejected around the daily resistance level at $1.96 on Sunday, and it declined by 2.66% over the next two days. As of Wednesday, XRP is trading at $1.86.
If XRP continues its pullback, it could extend the decline toward the December 19 low of $1.77.
The RSI on the daily chart reads 42 below its neutral level of 50, indicating bearish momentum. The MACD lines are also converging, indicating indecision among traders.
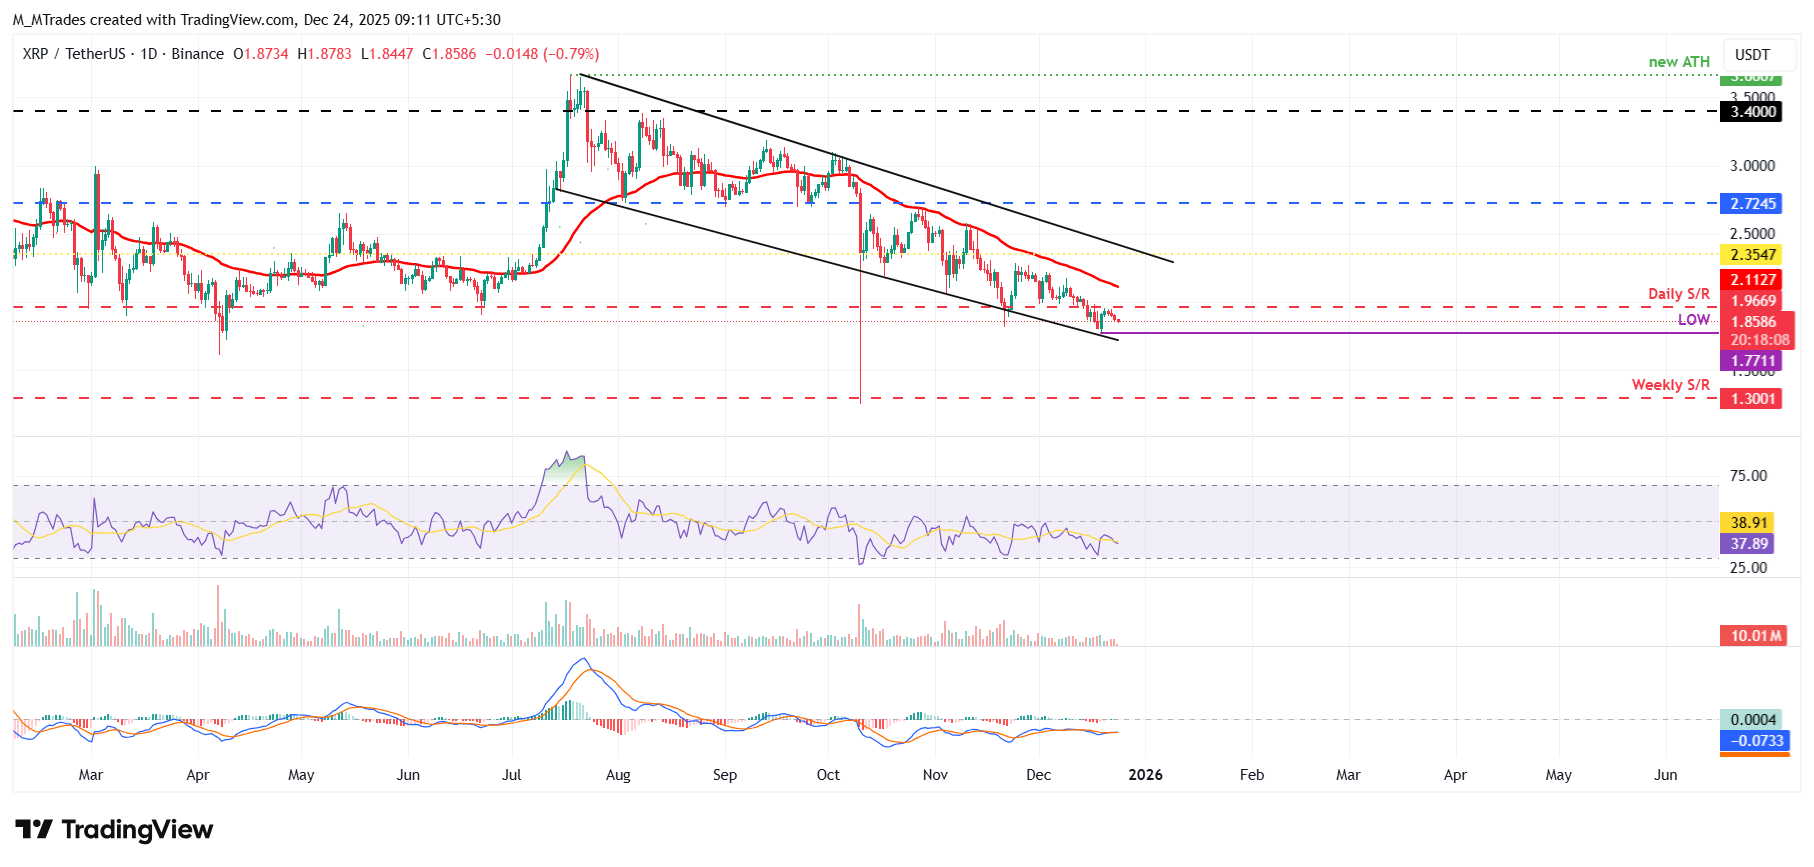
On the other hand, if XRP recovers, it could extend the advance toward the daily resistance at $1.96.
Open Interest, funding rate FAQs
Higher Open Interest is associated with higher liquidity and new capital inflow to the market. This is considered the equivalent of increase in efficiency and the ongoing trend continues. When Open Interest decreases, it is considered a sign of liquidation in the market, investors are leaving and the overall demand for an asset is on a decline, fueling a bearish sentiment among investors.
Funding fees bridge the difference between spot prices and prices of futures contracts of an asset by increasing liquidation risks faced by traders. A consistently high and positive funding rate implies there is a bullish sentiment among market participants and there is an expectation of a price hike. A consistently negative funding rate for an asset implies a bearish sentiment, indicating that traders expect the cryptocurrency’s price to fall and a bearish trend reversal is likely to occur.
Author

Manish Chhetri
FXStreet
Manish Chhetri is a crypto specialist with over four years of experience in the cryptocurrency industry.


