Pepe Price Forecast: PEPE at risk of a bearish holiday season as whales offload
- Pepe declines on Wednesday, extending the 2% loss from the previous day.
- On-chain data shows a steady decrease in large-wallet investor holdings, indicating a loss of confidence.
- Derivatives data reflect a surge in Open Interest amid negative funding rates, suggesting fresh capital inflow as bearish interest persists.

Pepe (PEPE) is down 2% at press time on Wednesday, trading in the red for the fourth consecutive week with a nearly 4% loss so far this week. The frog-themed meme coin is losing support of large-wallet investors, commonly referred to as whales, while derivatives data indicate a bearish incline in traders' interest.
The technical outlook for PEPE points to potential further losses toward the December 18 low at $0.00000363.
Declining confidence among whales fuels selling pressure
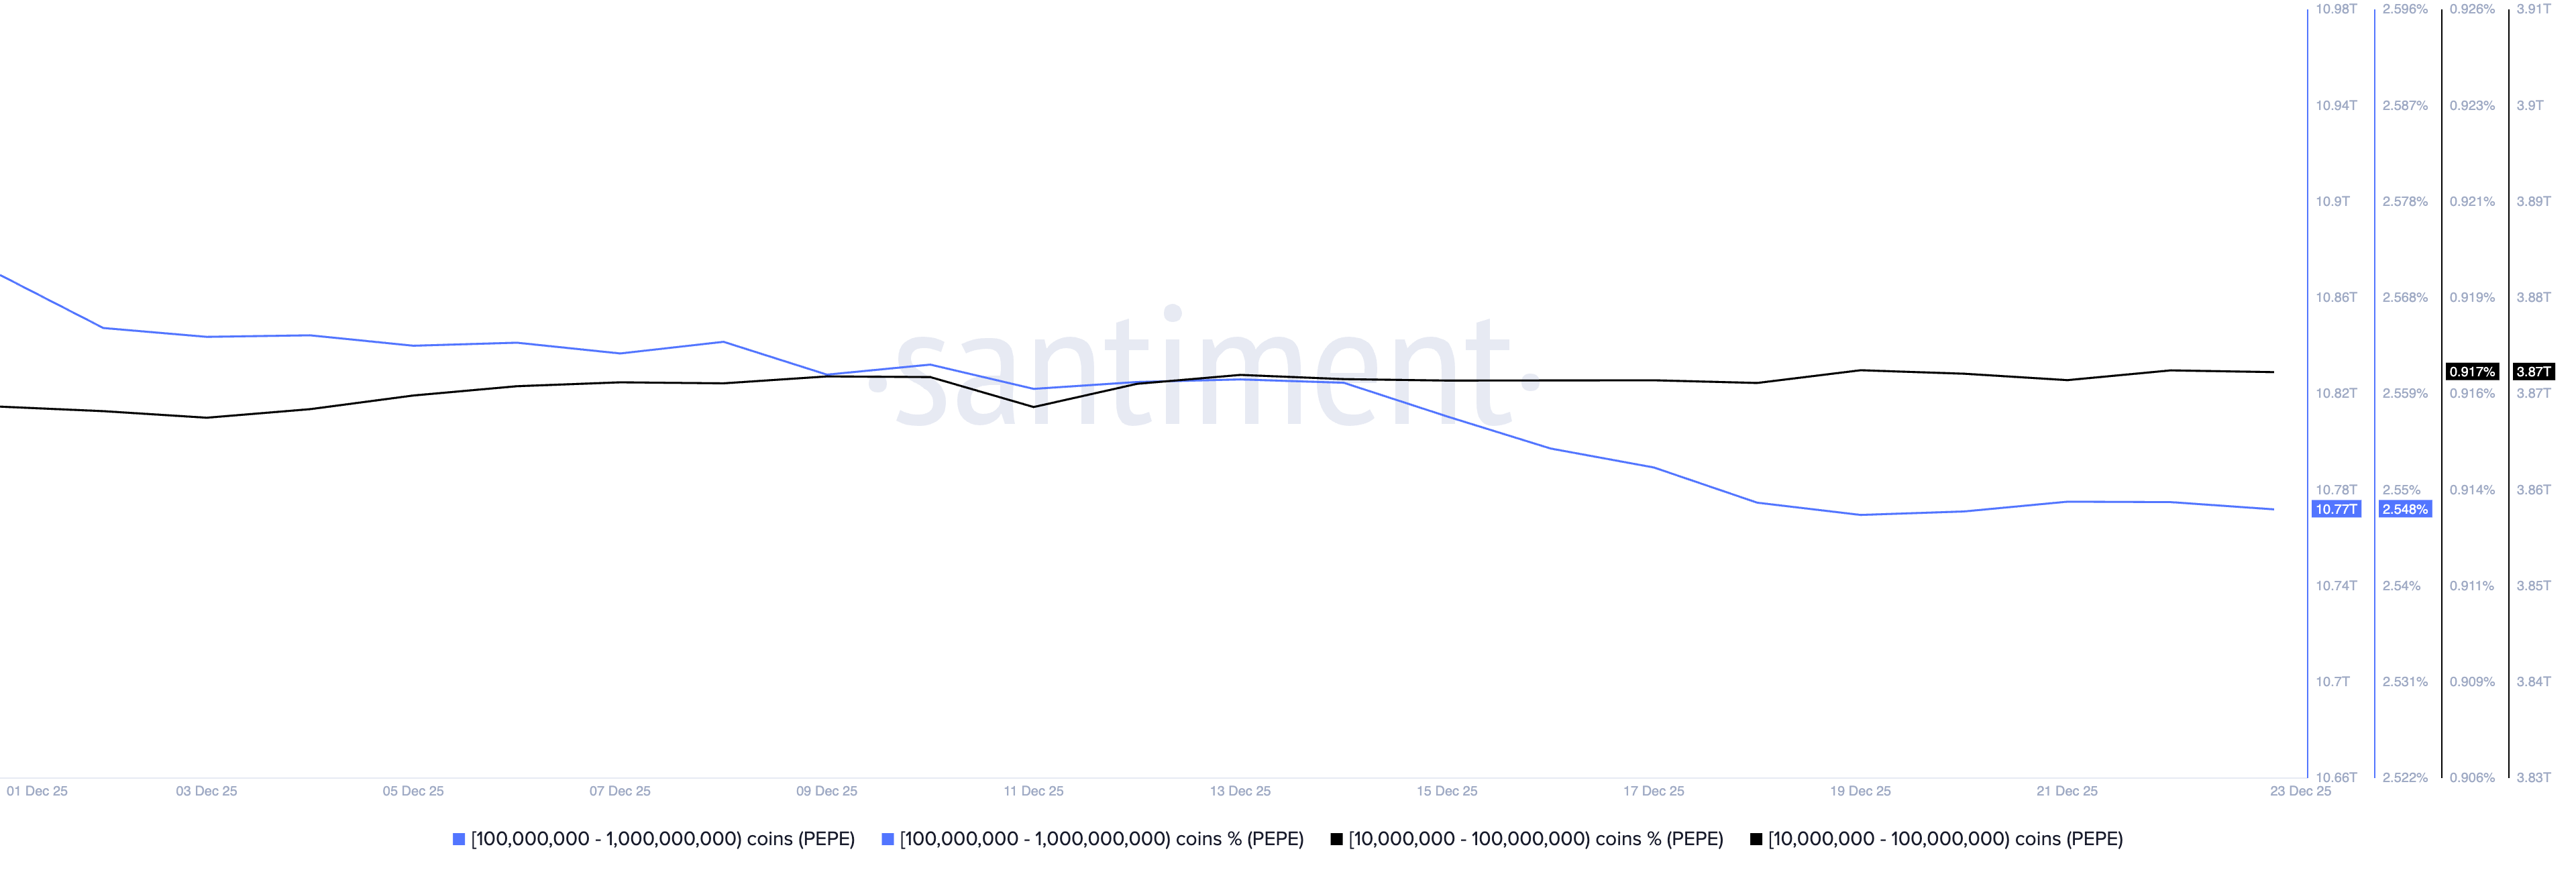
Large-wallet investors are trimming their PEPE holdings, fueling the supply pressure and suggesting a decline in confidence. Santiment data shows that investors with 100 million to 1 billion PEPE hold 10.77 trillion tokens (2.54% of circulating supply), down from 10.87 trillion PEPE (2.57% of circulating supply) on December 1.
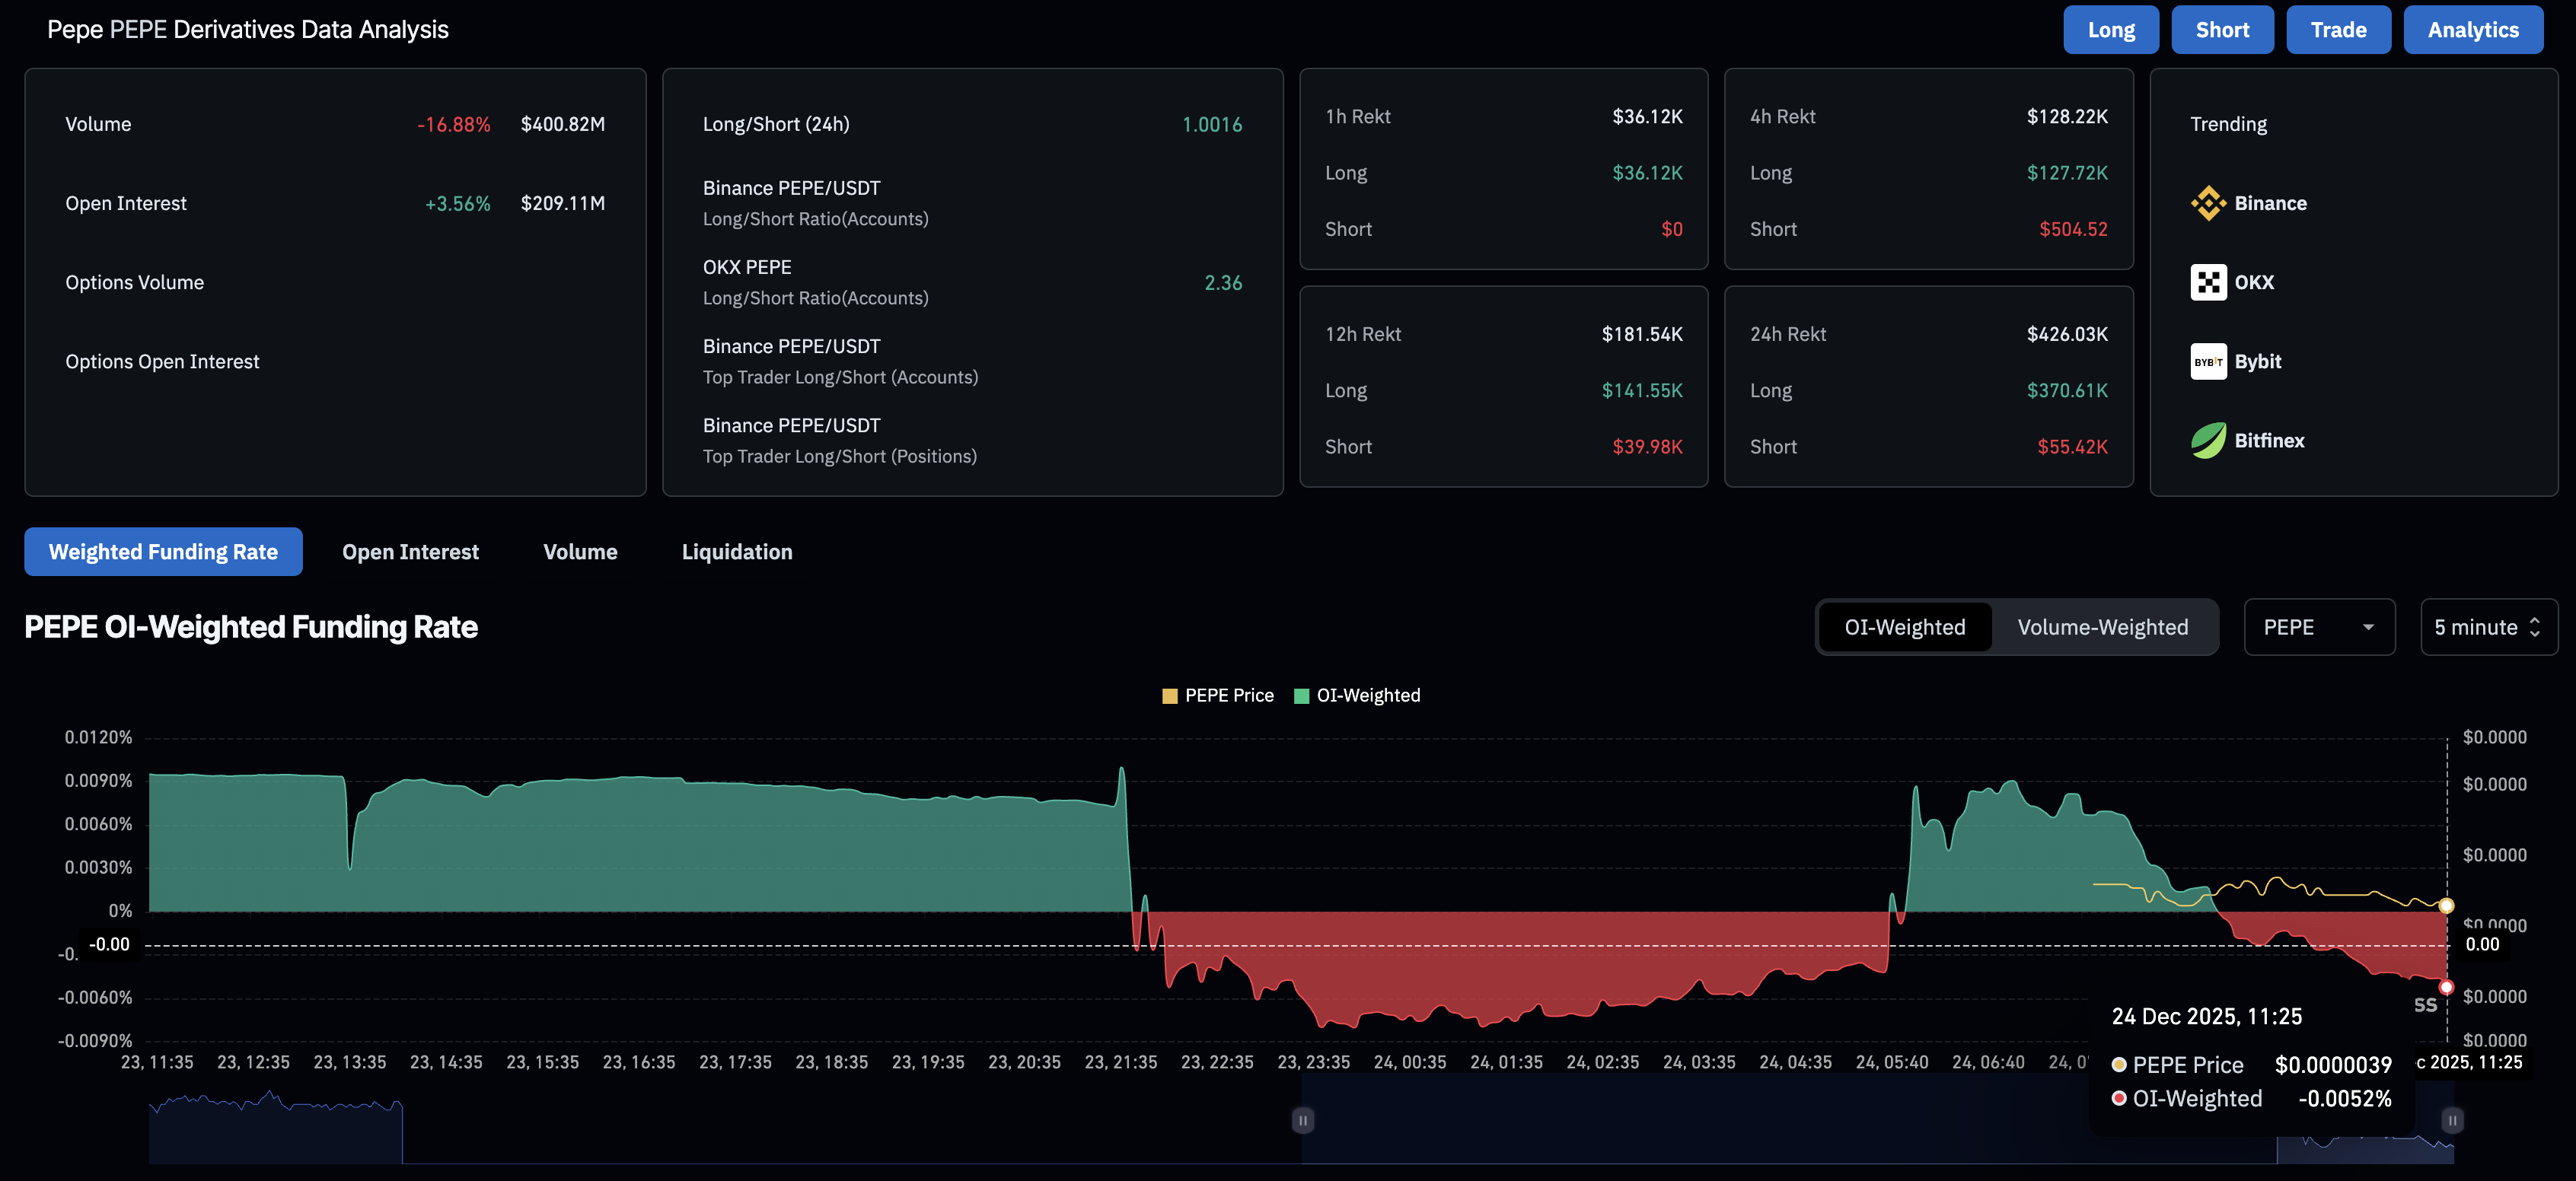
On the derivatives side, CoinGlass data shows a 3.56% increase in PEPE futures Open Interest over the last 24 hours to $209.11 million, suggesting that traders are allocating more capital, increasing their risk exposure.
However, the negative funding rate of -0.0052% indicates a bearish tilt in traders' sentiment, as they pay a premium to hold short positions.
Technical outlook: Will PEPE exceed its December low?
Pepe extends the bearish reversal from the local resistance trendline connecting the December 9 and 22 highs on the 4-hour logarithmic chart, near $0.00000400. At the time of writing, PEPE is down 2% on Wednesday, aiming for the December 18 low at $0.00000363, close to the S1 Pivot Point at $0.00000364.
If PEPE slips below this level, it could extend the decline to the S2 Pivot Point at $0.00000326.
The momentum indicators on the 4-hour timeframe indicate a steady increase in selling pressure. The Relative Strength Index (RSI) is at 39, pointing lower toward the oversold zone, reversing from the halfway line as selling pressure resurfaces.
Meanwhile, the Moving Average Convergence Divergence (MACD) is in a clear downtrend, below its signal line, which indicates a rise in bearish momentum.
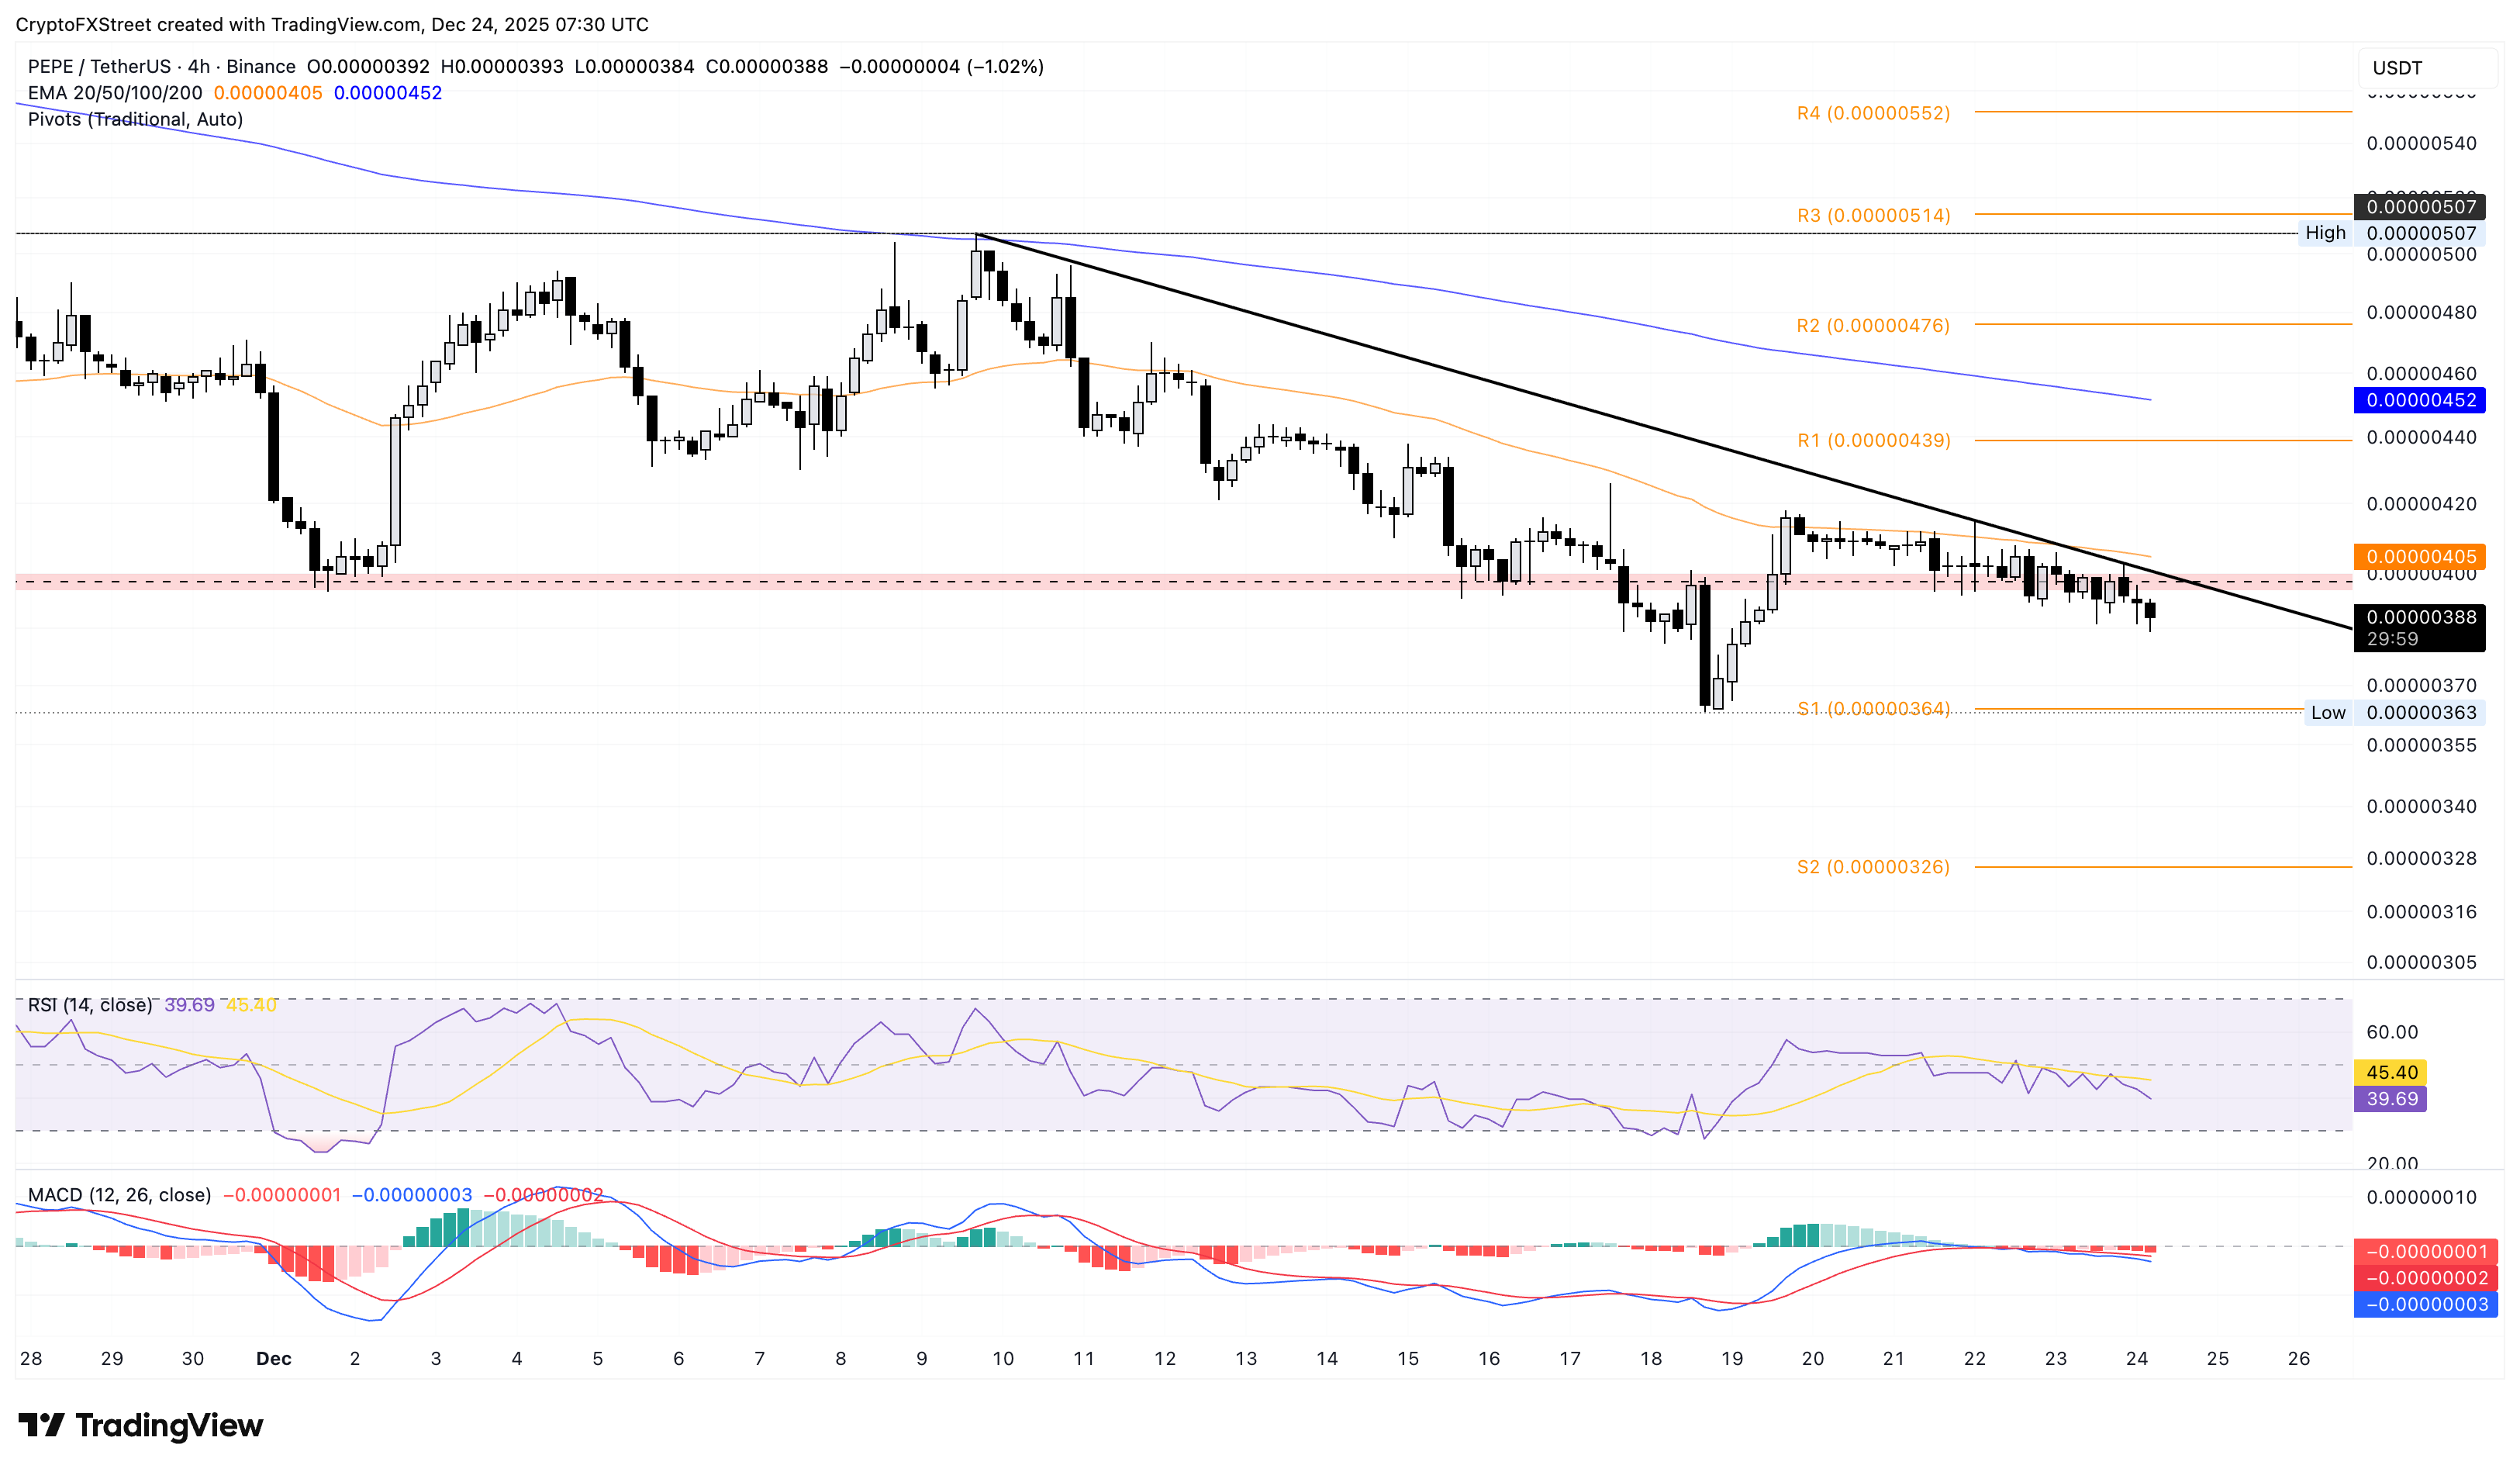
Looking up, a potential rebound in PEPE should surpass the $0.00000400 level to confirm the bullish breakout of the resistance trendline. If so, PEPE could target the R1 Pivot Point at $0.00000439.
Author

Vishal Dixit
FXStreet
Vishal Dixit holds a B.Sc. in Chemistry from Wilson College but found his true calling in the world of crypto.



